Super Force Signals - A Leading
Market Timing Service
We Take Every Trade Ourselves
Gold Momentum Leads Price Higher
Morris Hubbartt
Weekly Market Update Excerpt
posted Jul 6, 2012
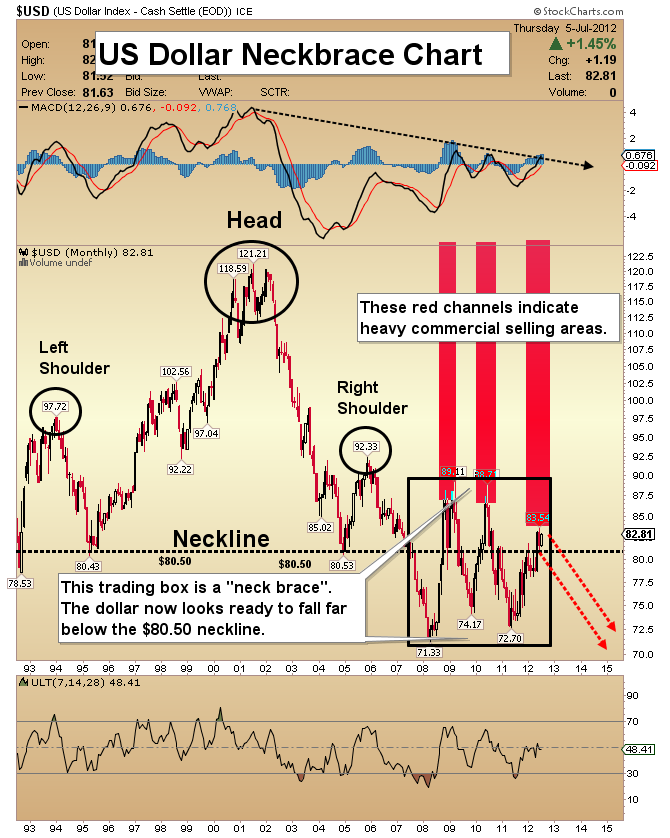
US Dollar Neckbrace Chart
- Dating all the way back to 2001, dollar rallies based on a strong American economy have been almost non-existent. The dollar has really only strengthened when there have been problems in our economy and abroad.
- The three rallies in the dollar since 2008 have resulted from panicked investors rushing to buy the dollar. Fundamentally, it appears that America’s debt problems have broken the dollar’s neck.
- Note the enormous size of the head & shoulders top pattern. Technically, the dollar also has a broken neck, but the neck is in what could be termed a “neckbrace”.
- What would happen to the dollar if a euro-style crisis came to America? The answer may be too horrific to think about right now.
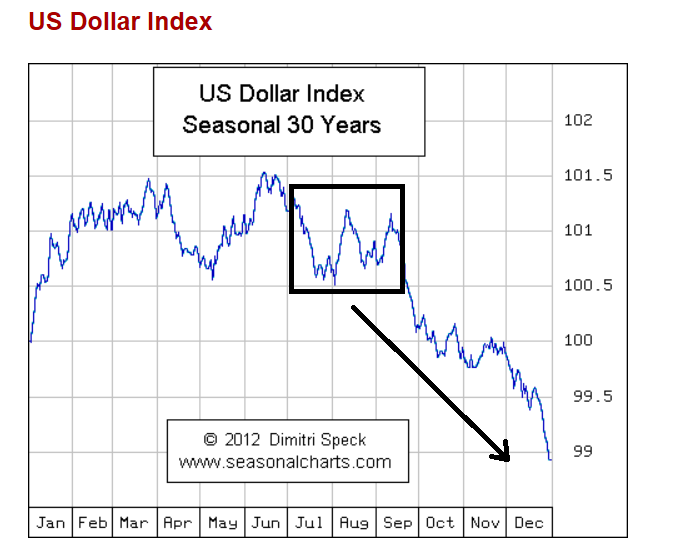
US Dollar Seasonal Action Chart
- Like this seasonal chart, my technical analysis indicates that the dollar should turn lower as summer ends.
- A presidential election year can often bring some additional strength to the dollar. Seasonal declines can be delayed. That could be the case if Mitt Romney continues to fare well at the polls, or President Obama makes convincing “I’m a strong dollar man” statements.
- Unfortunately, the dollar’s broken neck can’t be repaired by polls or dollar man statements. Repair is likely to come, but only after much lower dollar prices have occurred.
- Since the lows of 2008, the United States has added about $5 trillion in new debt. The size of this debt is preventing the dollar from mounting any kind of serious rally.
- The target of the enormous head & shoulders pattern is about 40. A decline of that magnitude could drive gold prices much higher.
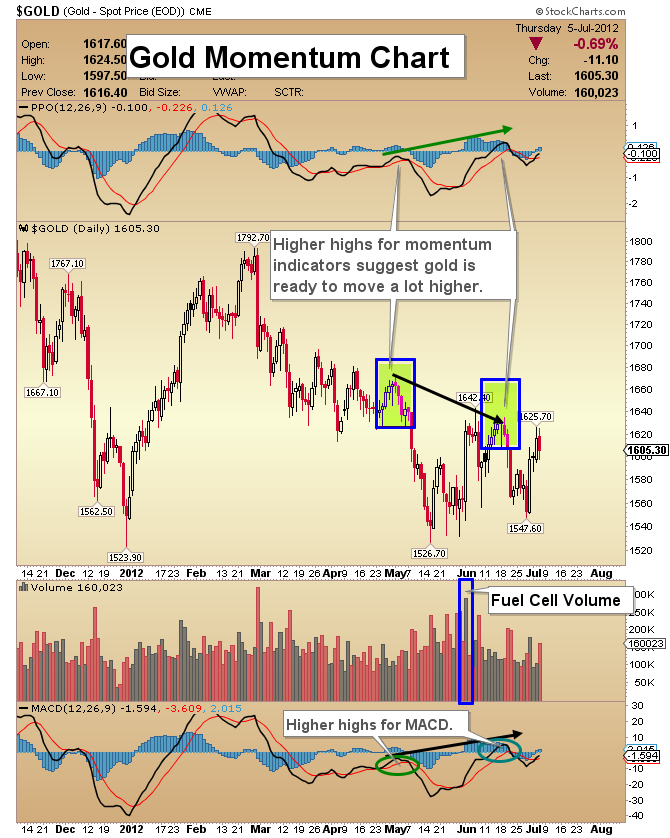
Gold Momentum Chart
- From a technical standpoint, the gold market can be best described as building technical momentum. Technical momentum indicators are moving higher, creating a very bullish “non-confirmation” with the gold price.
- Note the FCV (fuel cell volume) bar on the chart. When a FCV signal occurs alongside bullish movement of the momentum indicators, much higher prices are very likely.
- MACD and PPO are very good at indicating changes in technical momentum. Both have made higher highs while gold itself has made lower lows. This is a strongly bullish situation.
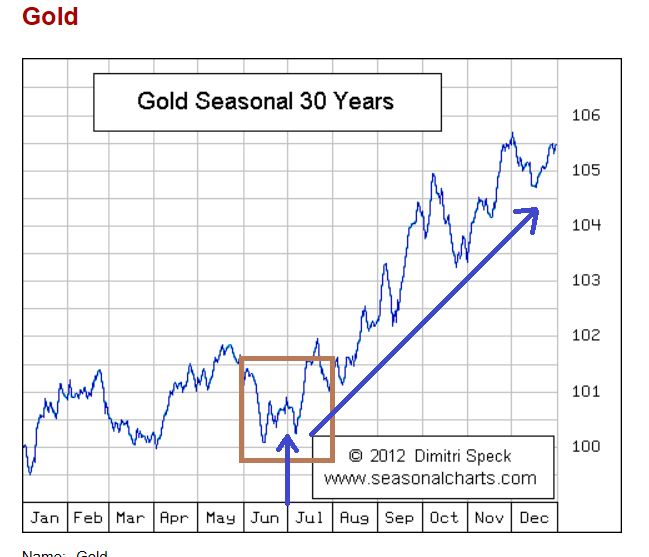
Gold Seasonal Action Chart
- Gold typically puts in a decent bottom in June and then advances into the fall. This is not the type of data you should “bet the farm on”, yet it does makes sense to look at the seasonal factors when investing your money.
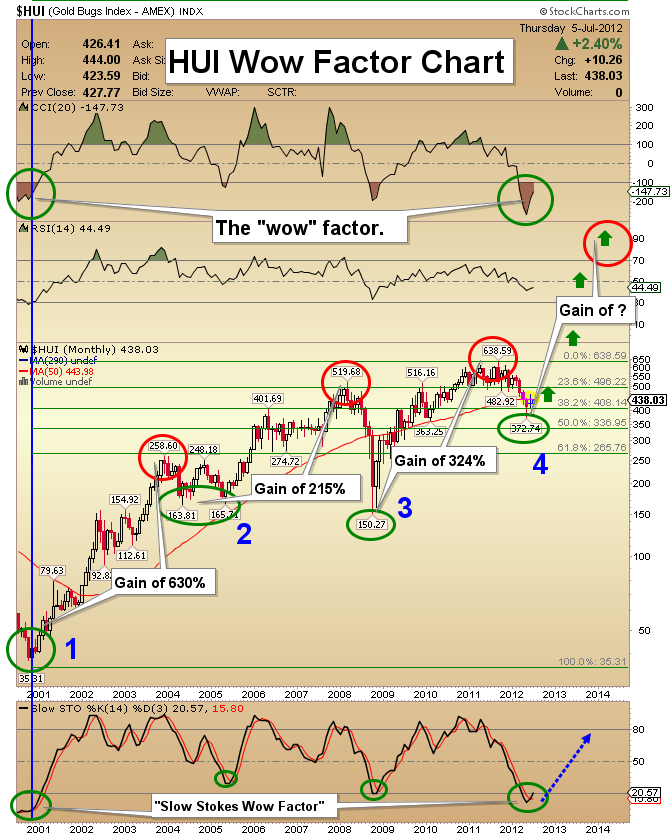
HUI “Wow Factor” Chart
- For evaluating the entire precious metals sector, this HUI index chart is probably the most important one to study now. As major bottoms occur, senior equities tend to lead the initial metals rally higher.
- Since the great bull market in gold began, there have been 3 enormous primary waves taking gold higher, and 3 very frightening sell-offs taking it lower.
- Some analysts have compared the recent sell-off in gold stocks to the 2008 crash. I think there is some similarity there, but both the CCI and “Slow Stokes” indicators suggest the current situation can be best compared to the 2001 bear market lows.
- From that low, the HUI index appreciated by about 600% before experiencing a brutal sell-off, and I believe the potential exists for a very similar advance to occur now.
- The strongest signals given by CCI and the Slow Stokes indicator tend to be sharp and crisp in appearance on the chart. That’s the situation in play here.
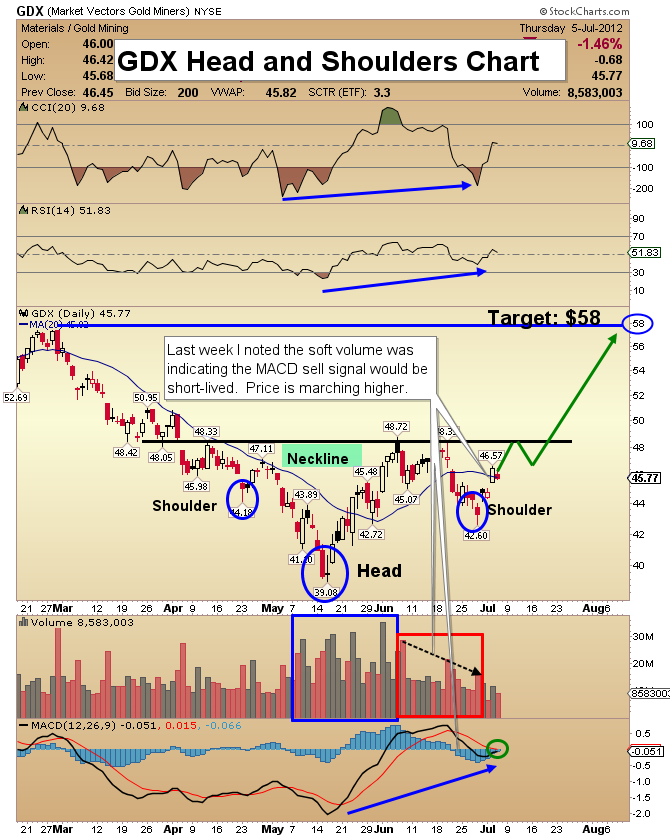
GDX Head & Shoulders Chart
- I mentioned a week ago that the GDX pullback could be short-lived, due to the fact that the volume was very soft, in comparison to the fuel cell bottom.
- Another outstanding feature on this GDX chart is the fact that the inverse head and shoulders pattern is still intact. A week ago the technical pattern looked to be in jeopardy, and it seemed ready to transition into a double bottom formation.
- Even if that had happened, $58 would still be the technical target price.
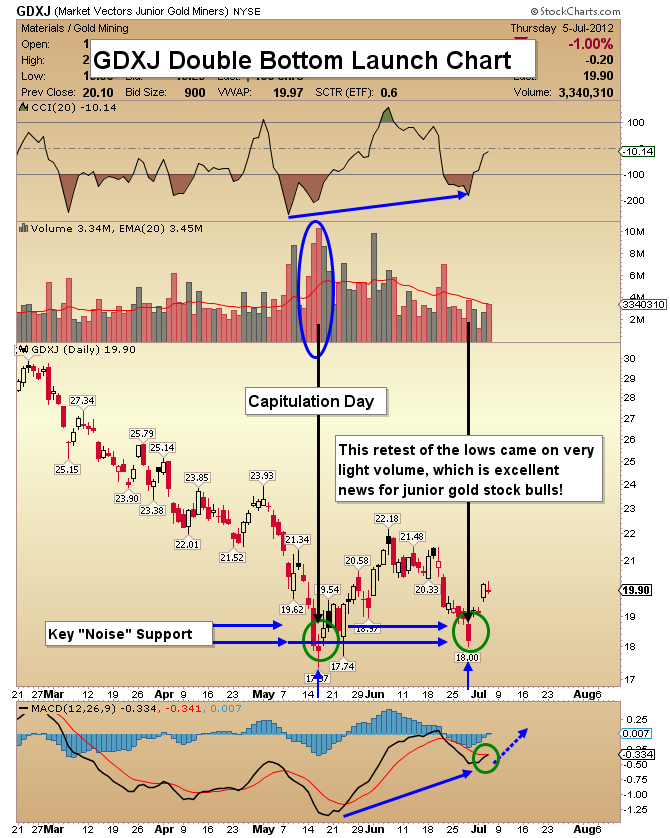
GDXJ Double Bottom Launch Chart
- Gold juniors will likely be one of the strongest sectors of the precious metals market over the next few years. A double bottom pattern is in play.
- After the capitulation day that occurred in mid-May, GDXJ is exhibiting classic technical action on the second leg down.
- Volume on the decline is just a fraction of what occurred going into the capitulation low, which is exactly what I want to see now.
- There is a clear indication that the sellers are exhausted. When there are no more sellers, if buyers exist, price must rise.
Silver Game Changer Chart
- Silver bullion broke down to a new low a week ago, yet silver stocks did not. This may be a substantial technical non-confirmation. It’s been a long time since silver stocks have led bullion.
- The two FCV (fuel cell volume) signal days are another very bullish feature, in play now on this silver chart.
- Silver should be purchased in physical form due to the volatile nature of its price.
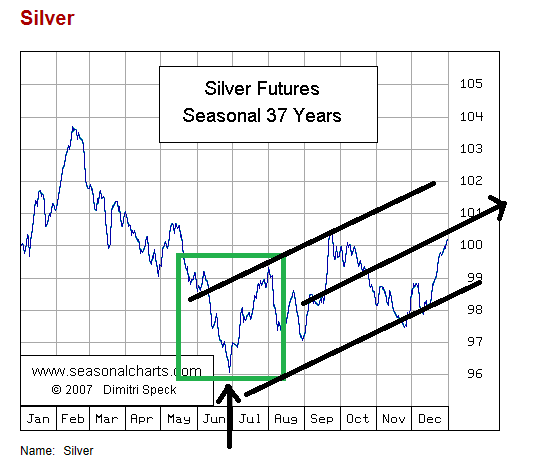
Silver Seasonal Action Chart
- This chart shows you the typical price movement of silver over a twelve month time frame, with about 37 years of data. Silver classically bottoms in June. It then embarks on a volatile road to higher prices. Combined with other technical indicators, this seasonal chart indicates that much higher prices are coming!
Friday, Jul 3, 2026 Super Force Signals Unique Introduction For 321Gold Readers:
Send me an email to admin@supergoldsignals.com and I’ll send you my free “Inflation Thunder Now!” gold and silver stocks video report. I’ll also include 3 of my next Super Force Surge Signals free of charge, as I send them to paid subscribers. Thank you!
|
Stay alert for our Super Gold alerts, sent by email to subscribers,
for both the daily charts on Super Force Signals at www.supergoldsignals.com and for the 60 minute
charts at www.supergoldsignals.com
About Super
Gold Signals:
Our Surge Gold Signals are created thru our proprietary blend
of the highest quality technical analysis and many years of successful
business building. We are two business owners with excellent synergy.
We understand risk and reward. Our subscribers are generally successfully
business owners, people like yourself with speculative funds,
looking for serious management of your risk and reward in the
market.
Frank Johnson:
Executive Editor, Macro Risk Manager.
Morris Hubbartt: Chief Market Analyst, Trading Risk Specialist.
website: www.supergoldsignals.com
email:
admin@supergoldsignals.com
email: admin@supergold60.com
Mail:
1276 Lakeview Drive
Oakville, Ontario, L6H 2M8
Canada
###
Jul 6, 2012
Morris Hubbartt
321gold
Ltd

|
