Super Force Signals - A Leading
Market Timing Service
We Take Every Trade Ourselves
All Gold Stock Hands On HUI Deck
Morris Hubbartt
Weekly Market Update Excerpt
posted Jun 29, 2012
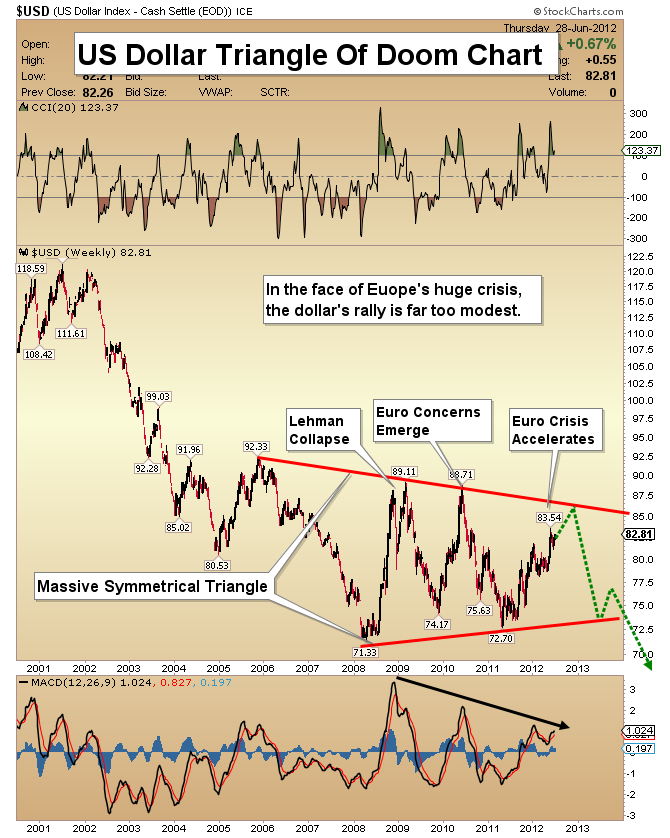
Historical Weekly Dollar Chart
- The US dollar is the “world reserve currency”. The euro crisis continues, so it will likely continue to attract capital in the short term. My chart analysis suggests that the dollar could rally as high as 85.
- In the longer term, getting your money out of fiat currency and into physical gold & silver is probably a very good idea. Ultimately, I see the dollar reversing its recent gains and making new all-time lows.
- The MACD indicator shows very little power. If this is all the power the US dollar can muster while the euro crisis rages like an inferno, what will happen to the dollar if the crisis were to begin waning?
- The CCI indicator is at a spike high.
- Note the circled area. The “smart money” commercial traders are more negative on the dollar than at any time since 2004.
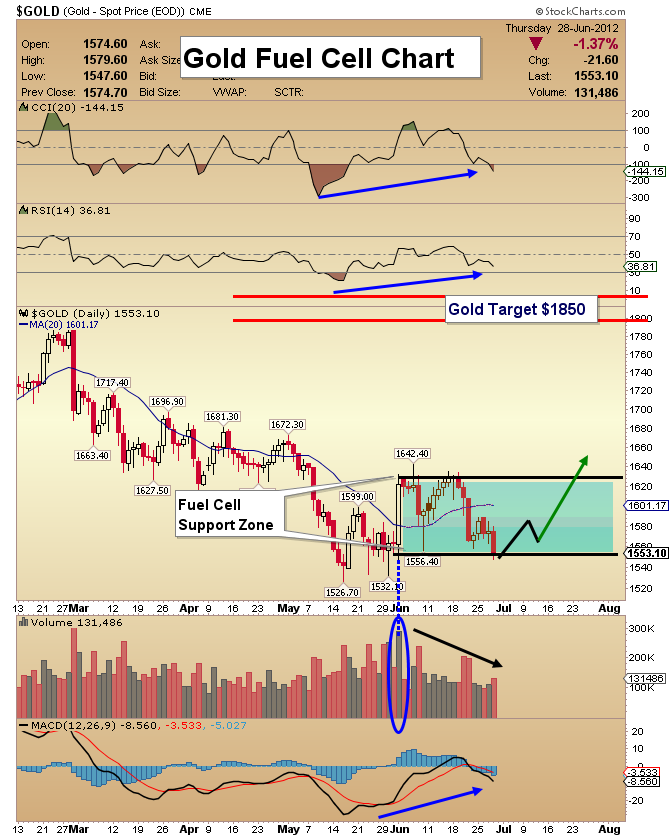
Gold Fuel Cell Chart
- The debt crisis in Europe continues to intensify. Banks are being downgraded and the world economy is showing signs of stress. A higher gold price is probably the only solution to this debt problem.
- One of the key developments in the gold market over the past few months has been consistent buying by commercial traders.
- It’s easy to forget about days that are technically significant in the market, and just stare at today’s price action. On June 1st gold delivered a fuel cell volume signal (FCV).
- A FCV occurs after a long price decline, when the price turns higher on greater volume than has occurred for several weeks. That’s what happened in the gold market on June 1st.
- Note the rising trend of the CCI and RSI indicators. Volume is contracting while the price drifts lower. The technical action is bullish.
- Gold often bottoms in the mid-June timeframe. My analysis projects that the $1850 area will be acquired in the coming weeks.
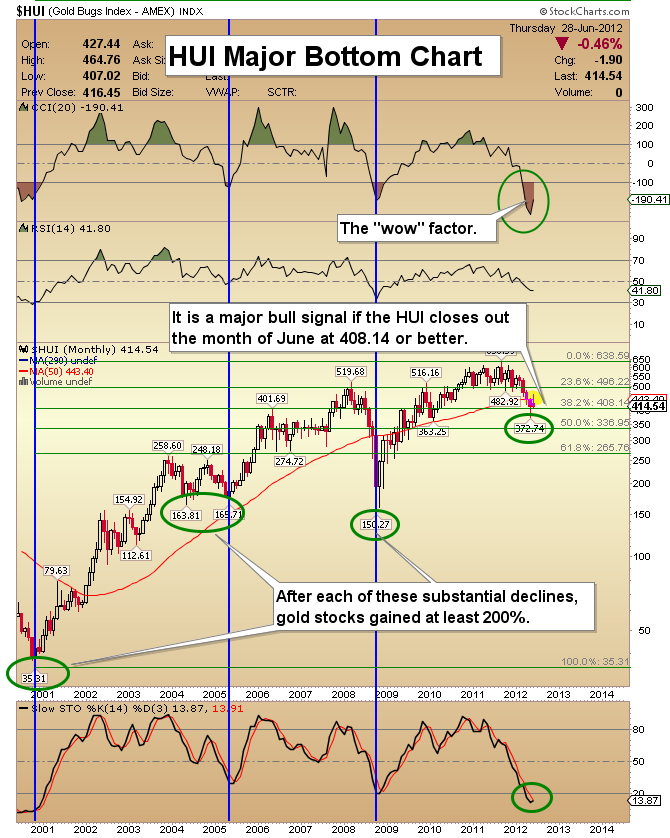
HUI Major Bottom Chart
- As we approach the end of the first half of the year, I want to evaluate where we are in gold equities. I believe the entire precious metals sector is putting in a major bottom. The next leg of the bull market could be a phase where we see spectacular gains.
- The senior gold companies are now the leaders of the sector. This is very bullish for the entire precious metals complex.
- The senior equities sector has passed an important test by outperforming the other precious metal sectors. If the HUI closes out the June quarter above 408.14, another milestone will be achieved. That’s the 38.2% Fibonacci retracement number, and it represents a 38.2% retracement of the entire bull market.
- The process of putting in a major bottom shakes out most investors. Try your best, to hang on to your positions. I will politely ask all “gold stock hands” to man the HUI deck until the close of trading today!
GDX Double Bottom Chart
- After making a meaningful low in May, GDX had become somewhat overbought on this rally. MACD is rolling over. That said, volume is very soft, so MACD will likely turn back up and push GDX higher.
- One bullish feature of the chart was an inverse head and shoulders formation, which projected that GDX could rise to $58. That h&s pattern seems to be changing into a double bottom, with the same neckline and bullish target.
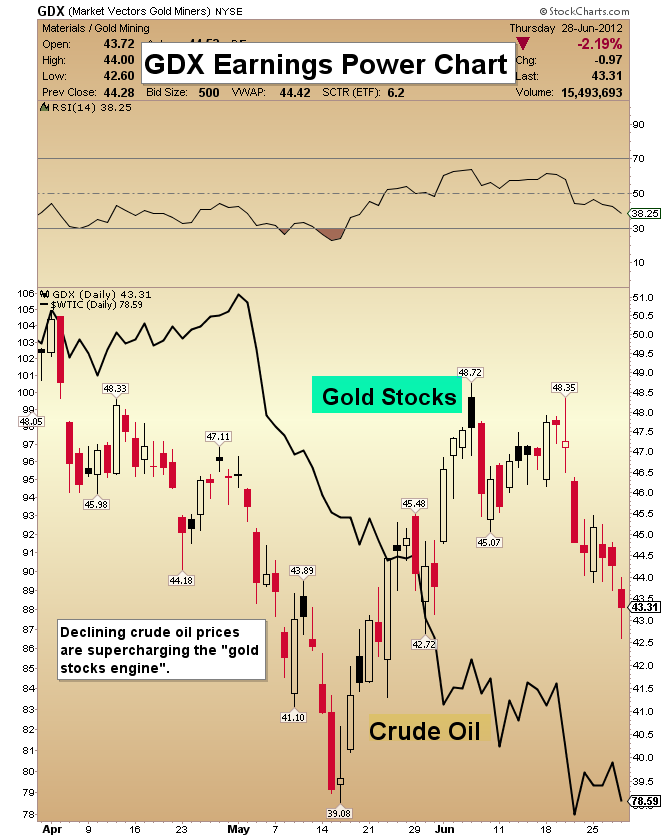
GDX Earnings Power Chart
- I believe one of the most overlooked facts in gold stocks is earnings power. In many cases, gold can be purchased at a substantial discount by buying the gold miners.
- The price of oil has been plunging lower recently and that intensifies the tremendous value of miners. Crude is a substantial expense to gold mining companies.
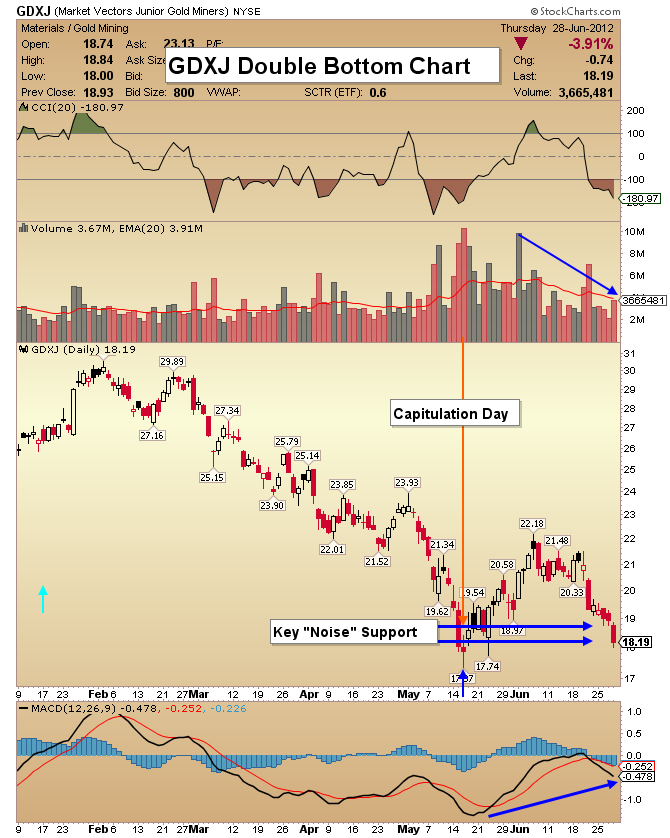
GDXJ Double Bottom Chart
- The GDXJ chart highlights the price action around what appears to be a “capitulation bottom”.
- Since the panic low occurred, volume on up days has dominated that of down days. Recently, the price has rolled over, and volume is subdued.
- Note the key areas of support, and the healthy action of the MACD indicator.
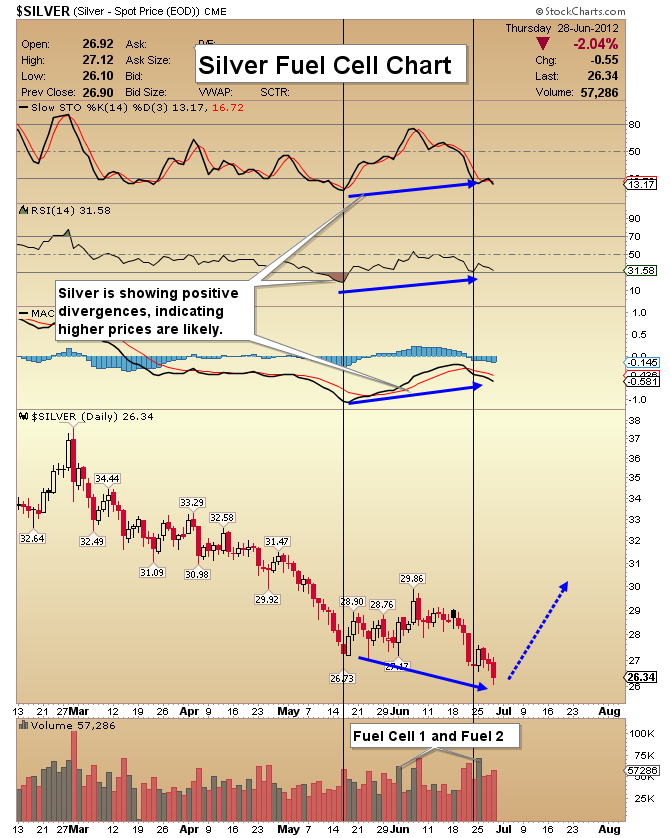
Silver Fuel Cell Chart
- Silver is trading near the lows of the year. This is an important time to be a buyer.
- Recently, there was a FCV signal. Ideally, the price should move higher after the signal. That didn’t happen this time, but it doesn’t totally negate the significance of the fuel cell indicator. It simply puts the silver asset on “accumulation notice”.
- An additional FCV indicator was offered this week, with even greater volume. Commercial traders appear to be strong buyers.
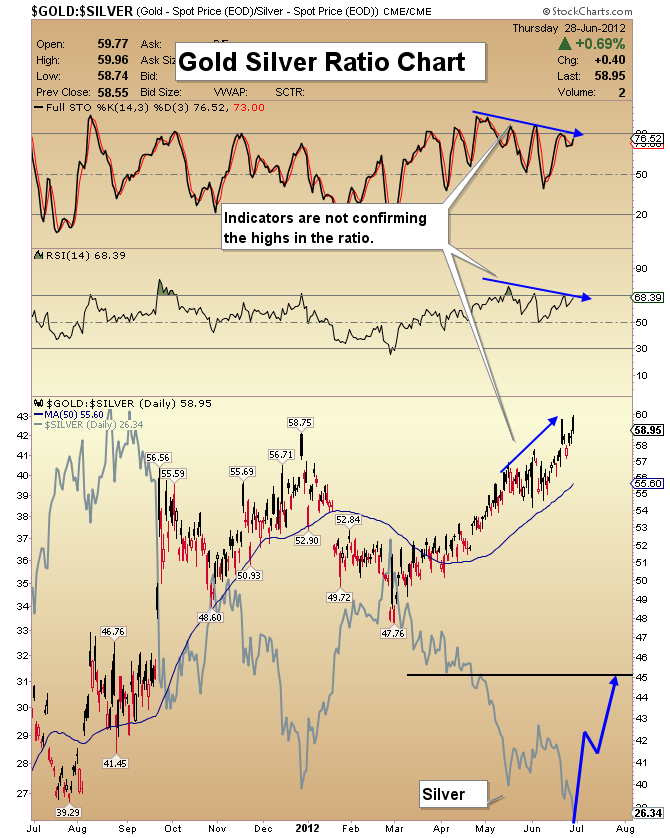
Gold Versus Silver Ratio Chart
- While gold has been outperforming silver, this chart now has many negative technical divergences. Rather than underperforming gold, silver may be close to a point of outperforming it.
- If silver begins to outperform, it adds evidence to my thesis that a major bottom is occurring in all precious metals sectors!
Friday, Jul 3, 2026 Super Force Signals Unique Introduction For 321Gold Readers:
Send me an email to admin@supergoldsignals.com and I’ll send you my free “Inflation Thunder Now!” gold and silver stocks video report. I’ll also include 3 of my next Super Force Surge Signals free of charge, as I send them to paid subscribers. Thank you!
|
Stay alert for our Super Gold alerts, sent by email to subscribers,
for both the daily charts on Super Force Signals at www.supergoldsignals.com and for the 60 minute
charts at www.supergoldsignals.com
About Super
Gold Signals:
Our Surge Gold Signals are created thru our proprietary blend
of the highest quality technical analysis and many years of successful
business building. We are two business owners with excellent synergy.
We understand risk and reward. Our subscribers are generally successfully
business owners, people like yourself with speculative funds,
looking for serious management of your risk and reward in the
market.
Frank Johnson:
Executive Editor, Macro Risk Manager.
Morris Hubbartt: Chief Market Analyst, Trading Risk Specialist.
website: www.supergoldsignals.com
email:
admin@supergoldsignals.com
email: admin@supergold60.com
Mail:
1276 Lakeview Drive
Oakville, Ontario, L6H 2M8
Canada
###
Jun 29, 2012
Morris Hubbartt
321gold
Ltd

|
