Super Force Signals - A Leading Market Timing Service
We Take Every Trade Ourselves
Gold $1155 - $1227 Key Support Morris Hubbartt
Weekly Market Update Excerpt
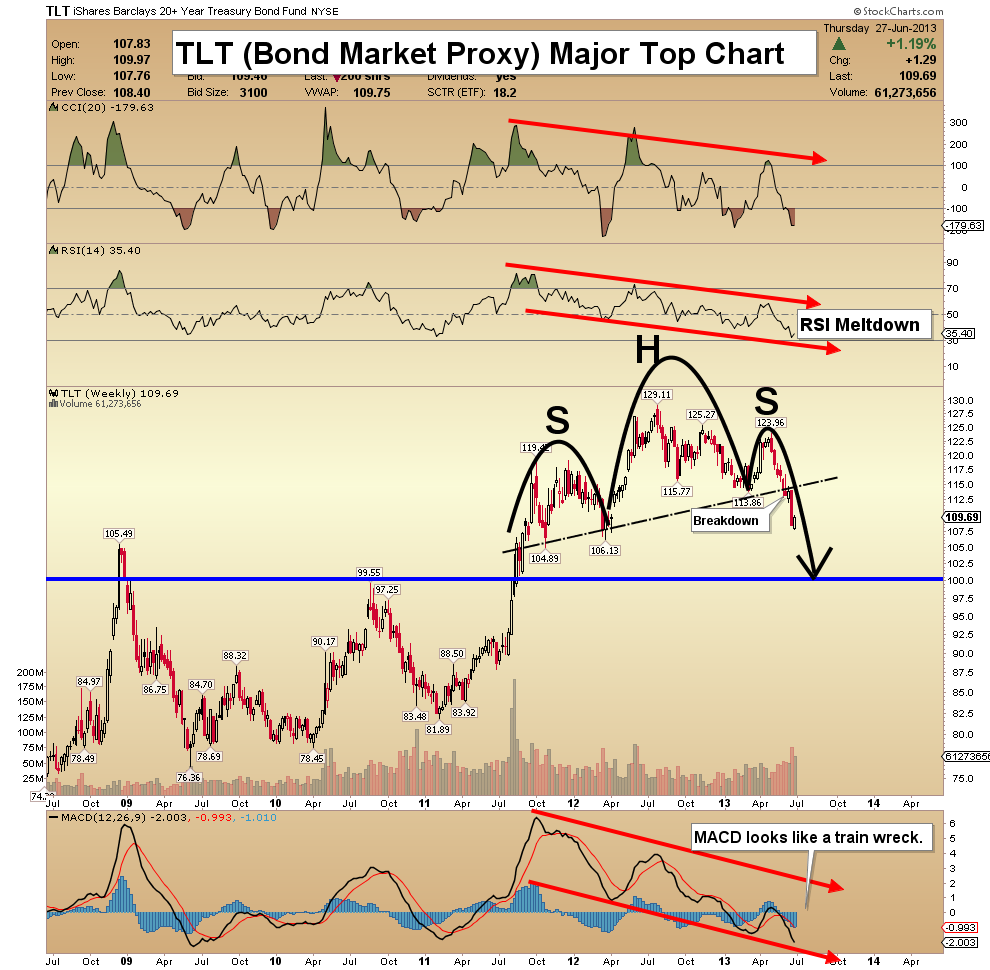
posted Jun 28, 2013 TLT (T-Bond Proxy ETF) Major Top Chart - The US bond market has become a poor vehicle for long term investment. Rates are low, and most small investors cannot afford to buy a T-Bond that costs $135,000.
- Even if they could afford it, QE tapering could cause large capital losses on their investment.
- From a technical perspective, TLT looks quite bearish. The head and shoulders top breakdown on this weekly chart is predicting lower prices. On a shorter term basis, a bounce back to the neckline is what I’m anticipating.
- My recommendation is to avoid the bond market, or short it.
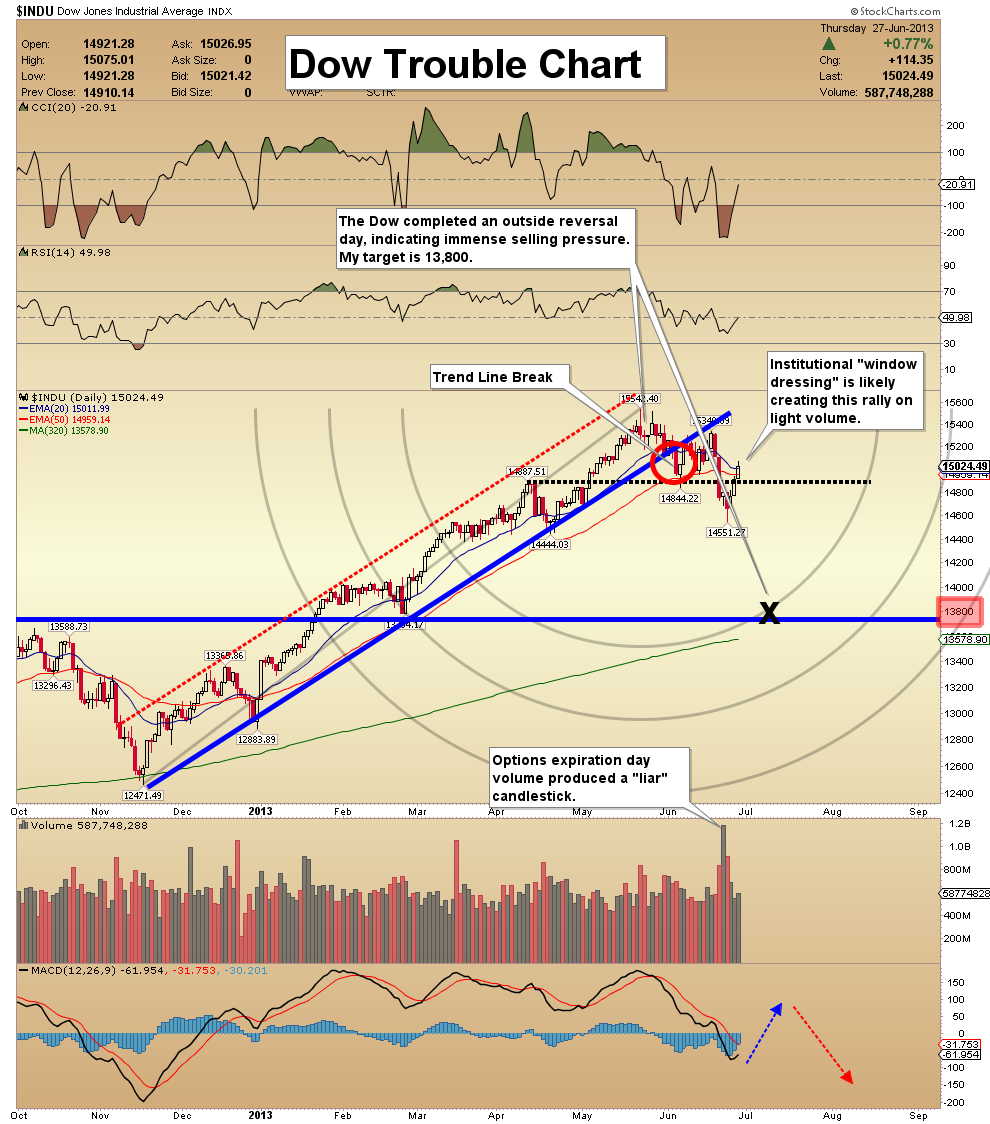
Dow Meltdown Chart - Several weeks ago, the US stock market gave a huge warning, with an outside reversal day. I’ve highlighted that on this chart, and called it a “shadow of death”.
- To date, that shadow of death day has marked the high for the Dow.
- Volume is now generally soft on up days, which is bearish.
- From a sentiment standpoint, very few bulls have thrown in the towel, and that’s also bearish.
- I see the Dow falling to 13,800 or lower.
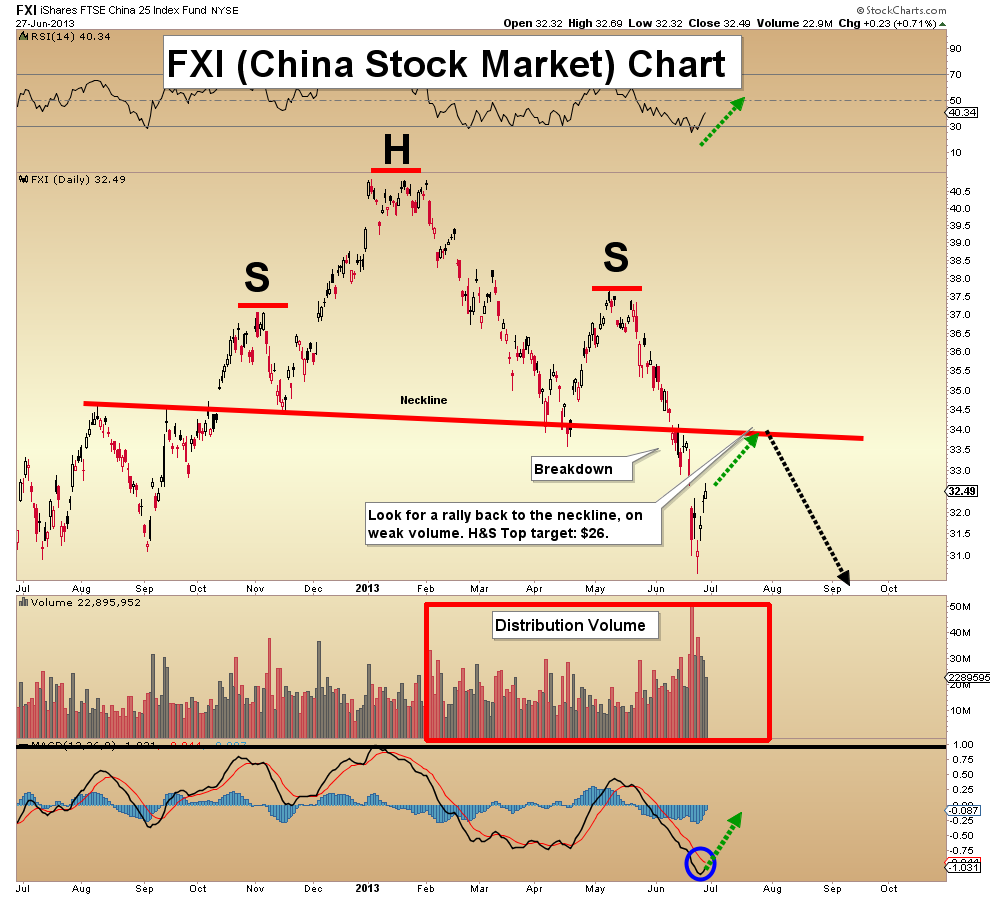
FXI (China Stock Market Proxy ETF) Chart - The Chinese stock market has been the leader to the downside, and for good reasons. The Chinese economy is the engine of world growth, because it is the world’s largest manufacturing nation.
- Like the US bond market, the Chinese stock market also has a large head & shoulders top pattern in play.
- There is heavy distribution volume, although this market is oversold and probably due for a small move higher.
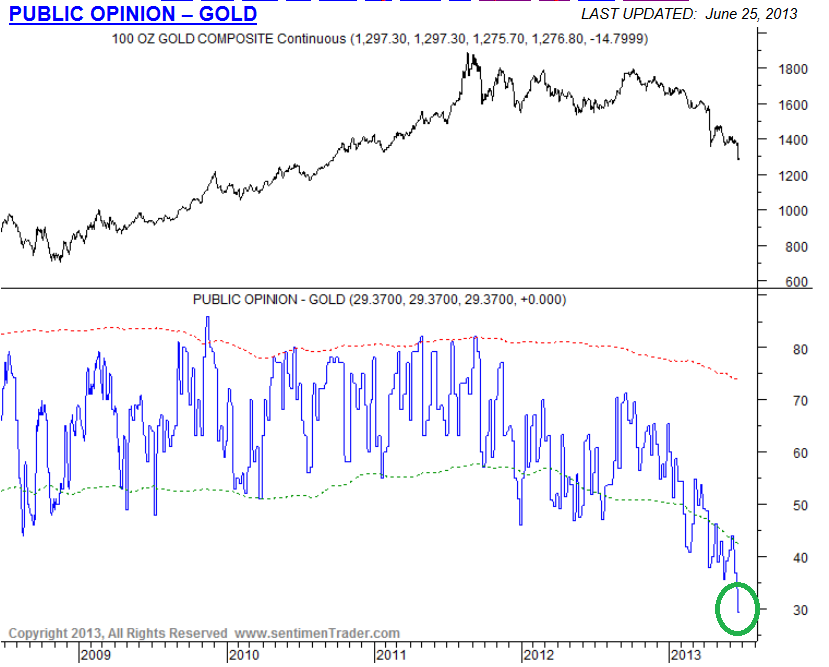
Gold Public Opinion Chart - Commercial traders are bullish, and the public is more negative than at any time in recent history, including the 2008-2009 lows.
- The public may be correct, but only in the short term. Their long term track record is disastrous, so this is probably a very good time to accumulate physical metals.
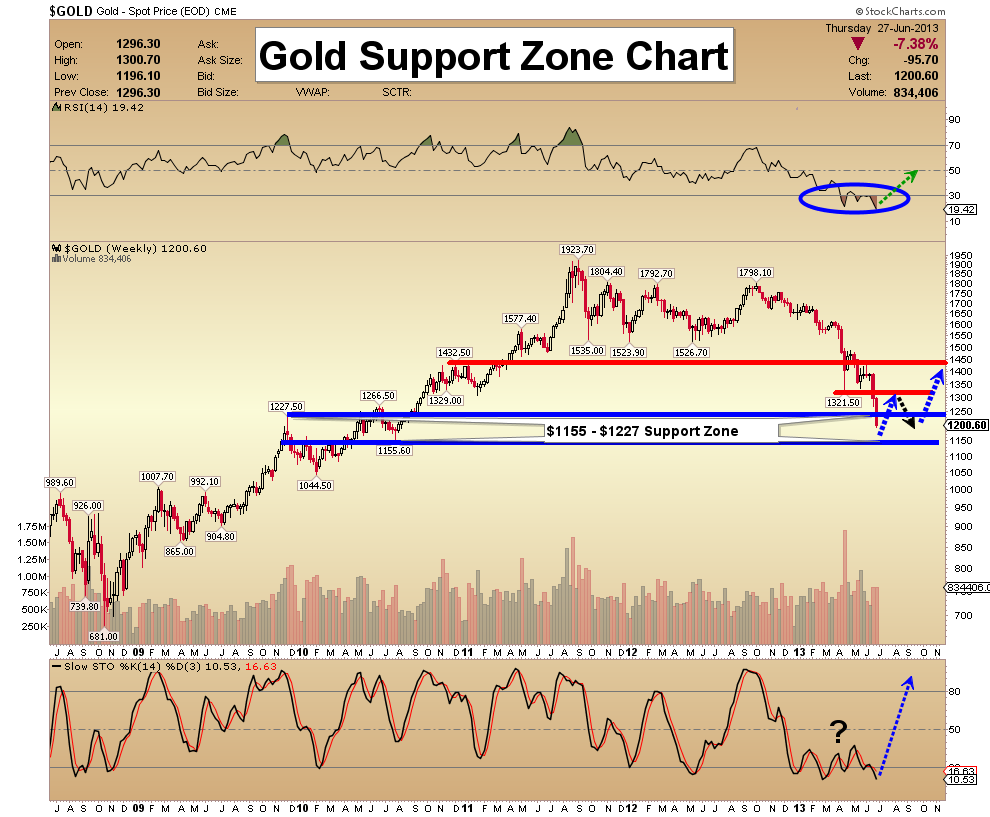
Gold Support Zone Chart - Several weeks ago I said I was looking for a move to either $1580 or $1260.
- The bearish target has been acquired (unfortunately).
- Gold is now trading in the large $1155 - $1227 support zone. I’m forecasting a bounce to $1321, followed by a pullback to around $1200.
- From there, there should be a stronger rally, to about $1432.
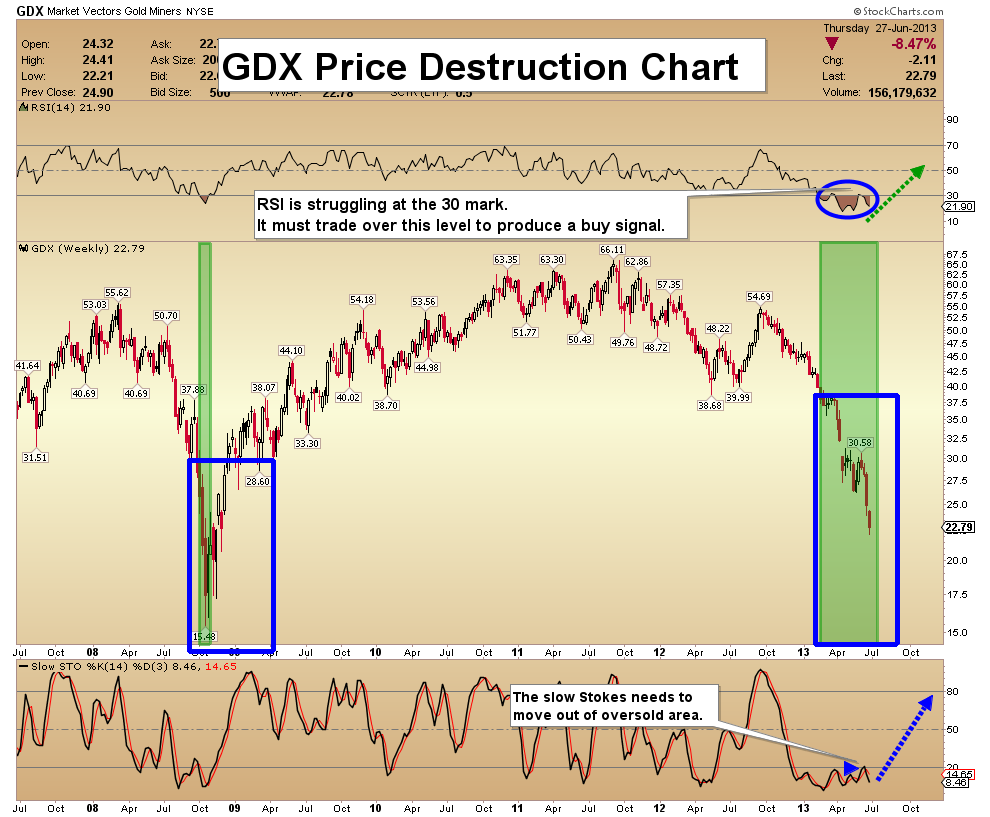
GDX Price Destruction Chart - Compared to the gold price, gold stocks are cheaper now than they were in the bottom of the 2008 lows.
- Buying this type of gold stocks “destruction” makes sense, but investors have to be prepared for even lower prices!
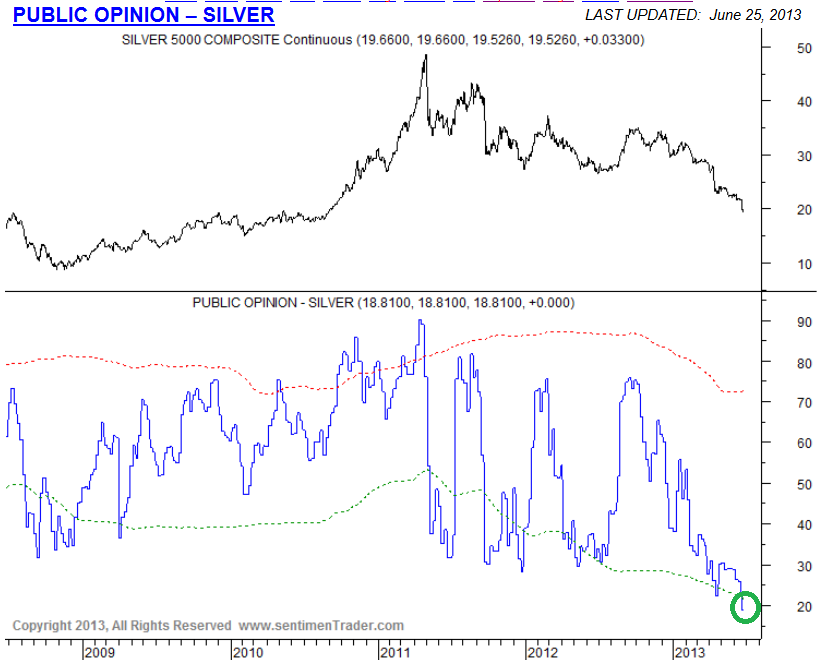
Silver Public Opinion Chart - This chart shows that the public is running for the exit door, in the silver market.
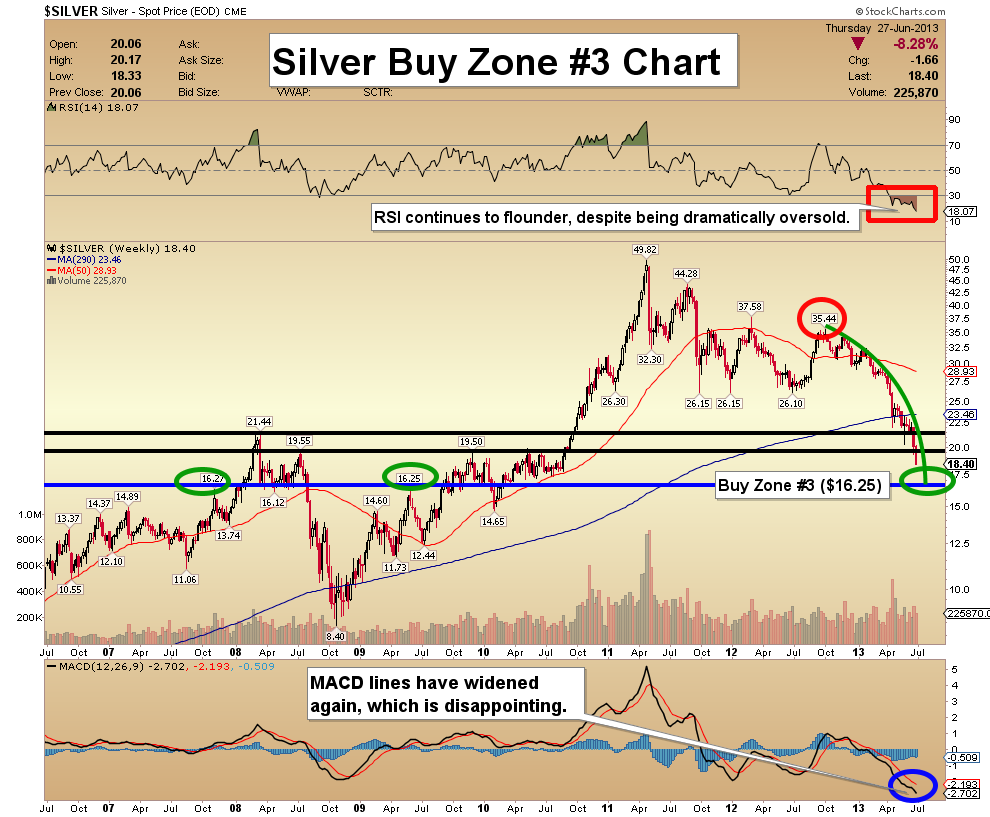
Silver Buy Zone #3 Chart - This week, I spoke to an elderly fellow who has accumulated silver for decades. He has been buying it since the 1960s, and he’s not concerned about the current price action at all.
- In less than a year, silver has fallen almost 50% from the highs in the $35.44 area. Silver investors should be more patient than gold investors, because of these volatile price swings.
- Note the green parabolic downtrend line on this chart. The price has crashed through strong support at $21.44 and $19.55. I think the support at $16.25 (highlighted with green circles) is strong enough to break that parabolic line, and get a decent rally started!
Friday, Jul 3, 2026 Super Force Signals Unique Introduction For 321Gold Readers:
Send me an email to admin@supergoldsignals.com and I’ll send you my free “Inflation Thunder Now!” gold and silver stocks video report. I’ll also include 3 of my next Super Force Surge Signals free of charge, as I send them to paid subscribers. Thank you!
|
Stay alert for our Super Gold alerts, sent by email to subscribers,
for both the daily charts on Super Force Signals at www.supergoldsignals.com and for the 60 minute
charts at www.supergoldsignals.com
About Super
Gold Signals:
Our Surge Gold Signals are created thru our proprietary blend
of the highest quality technical analysis and many years of successful
business building. We are two business owners with excellent synergy.
We understand risk and reward. Our subscribers are generally successfully
business owners, people like yourself with speculative funds,
looking for serious management of your risk and reward in the
market.
Frank Johnson:
Executive Editor, Macro Risk Manager.
Morris Hubbartt: Chief Market Analyst, Trading Risk Specialist.
website: www.supergoldsignals.com
email:
admin@supergoldsignals.com
email: admin@supergold60.com
Mail:
1276 Lakeview Drive
Oakville, Ontario, L6H 2M8
Canada
### Jun 28, 2013
Morris Hubbartt
321gold Ltd
 |
