Super Force Signals - A Leading
Market Timing Service
We Take Every Trade Ourselves
Gold Stocks Bottom While SP500 Tops Out!
Morris Hubbartt
Weekly Market Update Excerpt
posted Jun 24, 2011
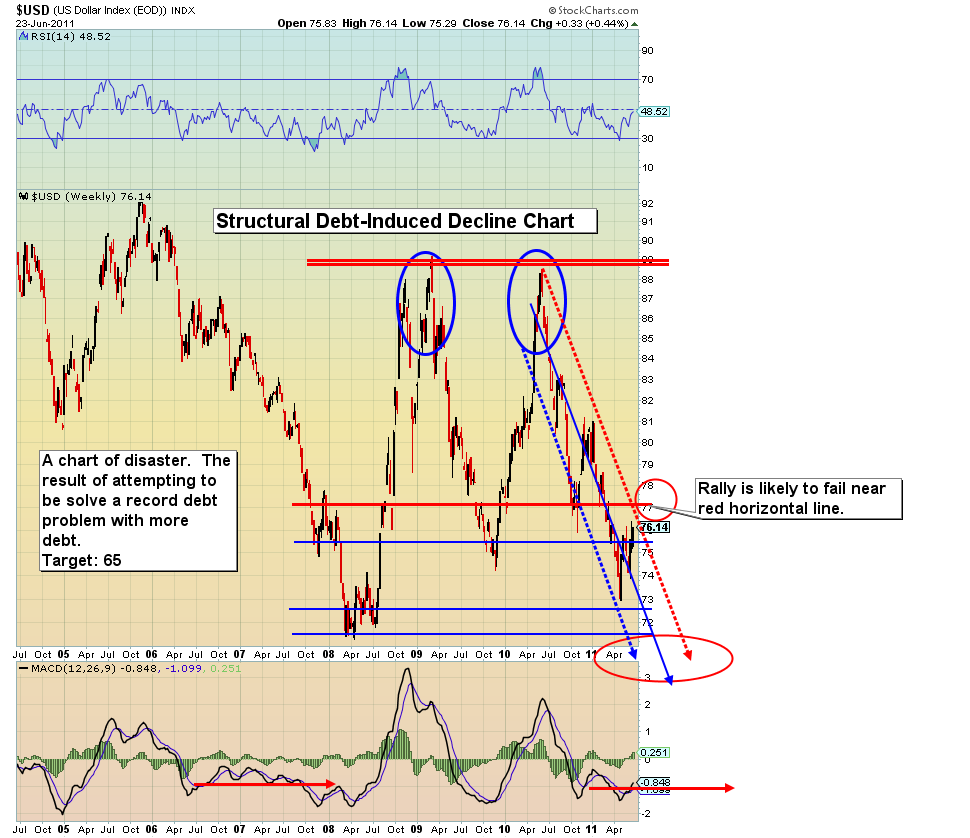
US Dollar Chart
Dollar Commentary
• In the short term, the dollar is rallying against other paper currencies like the Euro. In the long term, the Euro is a junk bond currency, just like the dollar.
• Money in the bank is a big part of the American Dream. The problem is that when nations keep interest rates artificially low, to continue issuing debt (and paying a bit of it back), the value of the nation’s currency melts away.
• Rather than compare the two largest currencies to each other, I prefer to see you compare them to gold.
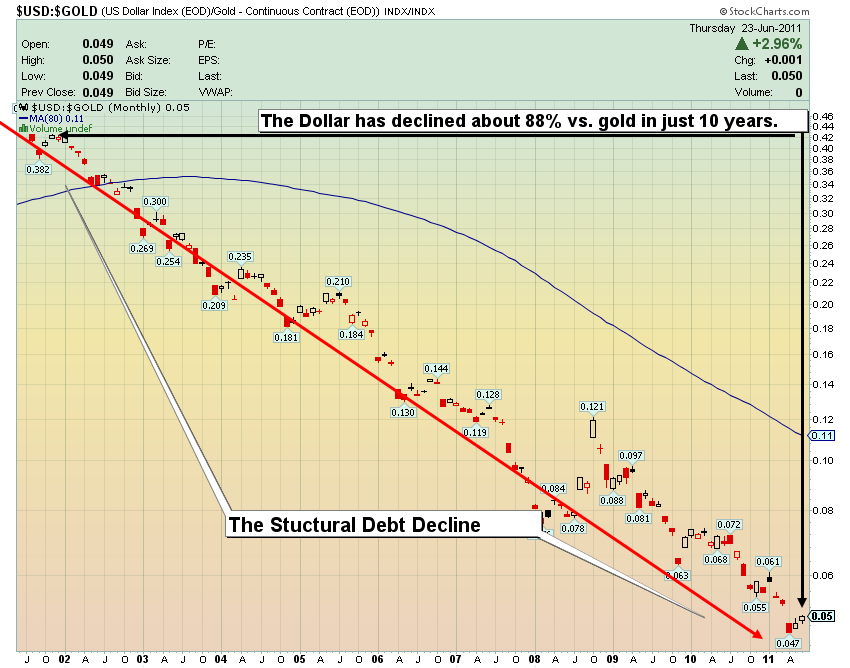
US Dollar vs. Gold Chart
• The US economy has serious structural problems. In ten years, the dollar is down 88% against gold. The US keeps rates low, even though real inflation is on the move. Modern surveys about inflation, exempt food and energy, which are very important products used by all consumers.
• The debt is so large the Fed’s hands may be tied, but what would happen if they did raise rates? Consider the mortgages that the government owns through Fannie Mae and Freddie Mac. If rates go up, individuals’ payments go up, more houses go into foreclosure and the house pricing problem just gets bigger.
• On the other hand, if rates stay low, the currency melts and more and more inflation hits the economy, breaking down the standard of living.
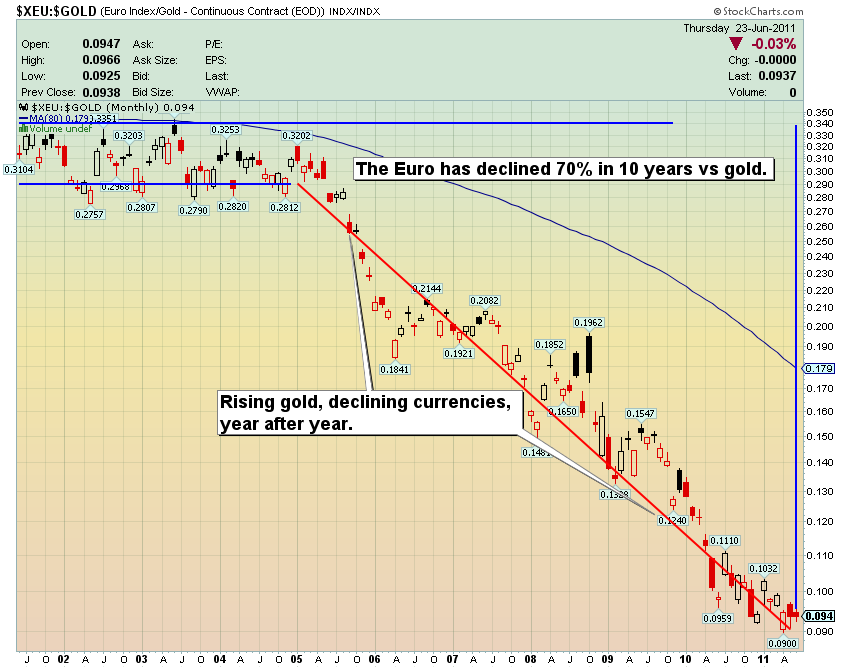
Euro vs. Gold Chart
• The Euro has also declined substantially compared to gold, down 70% over ten years. Typically, if the dollar is up, then the euro is down, yet both of these currencies are down substantially in comparison to gold.
• There really is no easy solution to the debt problem, but there is protection. A look at these charts demonstrates how much better off you are in gold than in fiat currency. Debt accumulation is rising at a record pace right now. A look at the charts makes it clear gold is more than a currency; it is the ultimate asset in a debt crisis.
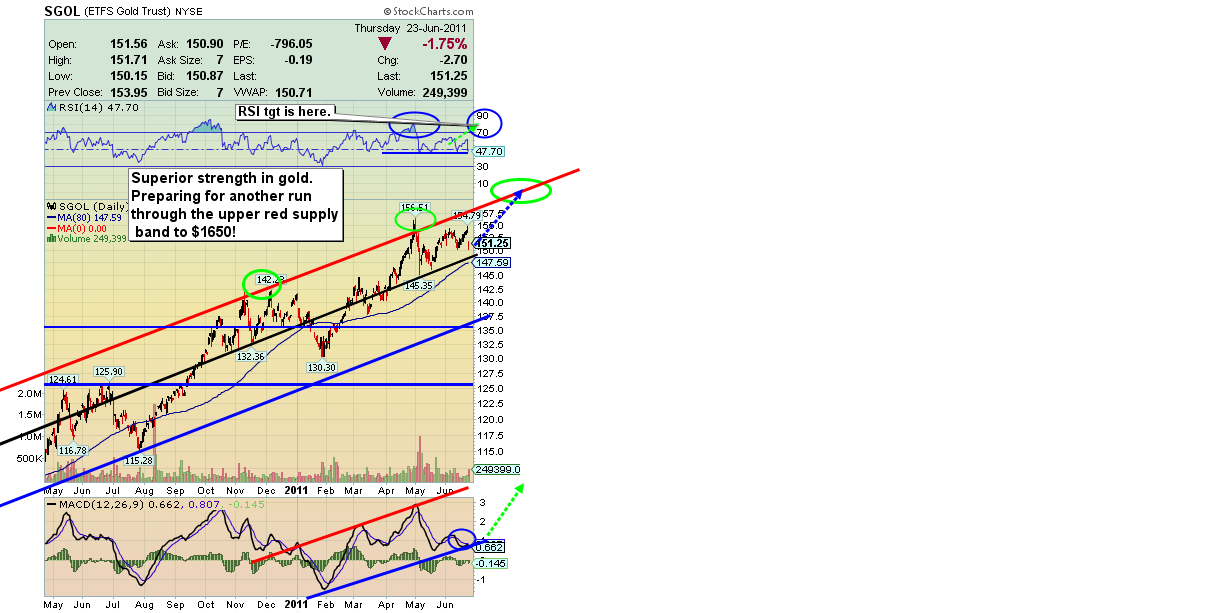
SGOL (Gold Bullion Proxy) 14 Month Chart
• I remain a long term bull with buy signals in play on the entire precious metals sector. I continue to call for a breakout in the sector in the late June to early July timeframe, with new highs projected at around $1650 for gold bullion. Timing is the trickiest part of analysis. My internal indicators are pointing to new highs in the August timeframe for gold. Use market volatility to lower the cost of your core positions.
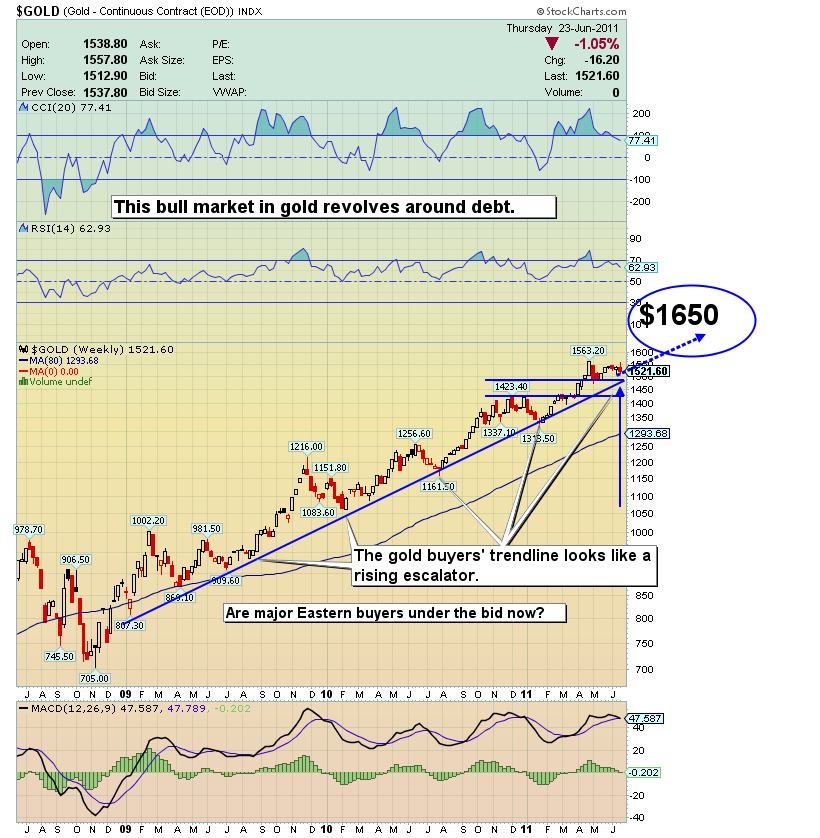
Gold 3 Year Major Trend Chart
• There are many technicians now saying the seasonal analysis is wrong and gold must go down. My technical work suggests opposite. Selling gold this year based on seasonal analysis could be your greatest mistake of the year.
• Why sell gold in a debt crisis? Use rallies in the dollar to exit the dollar, not to buy more dollars. Buy the metal and hold the metal. Only very small positions should be used for trading. The vast majority of the portfolio should be held for much higher prices.
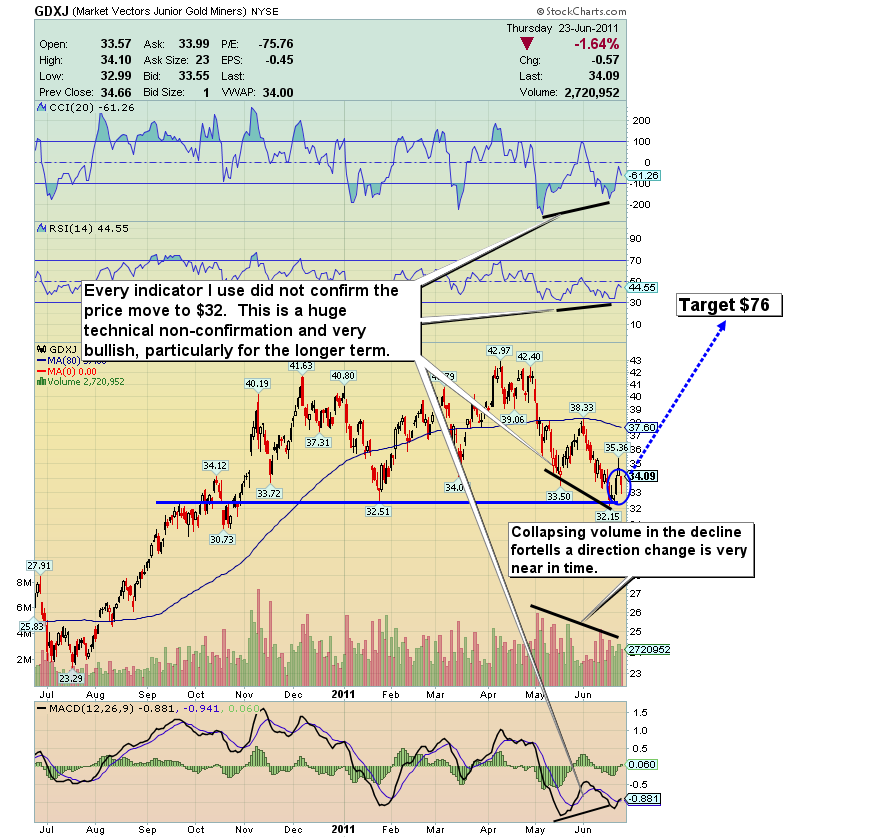
GDXJ Bull Set-Up Chart
• The gift of gold stocks! There is no doubt that the recent moves in gold stocks are tough to watch, but you may want to refocus the frustration into a fresh perspective.
• I have advised people with bank CDs to transfer some money out of the banking system, and to buy physical gold with it because the income from CDs is now paltry. Those who have done so even a year ago are up 25%. Gold is up over 70% and Silver is up over 100% in the last three years.
• “The US is the largest debtor nation in the history of the world”. – Jim Rogers. Gold will be the tool to revalue debt. That revaluation brings me to compare gold stocks to gold.
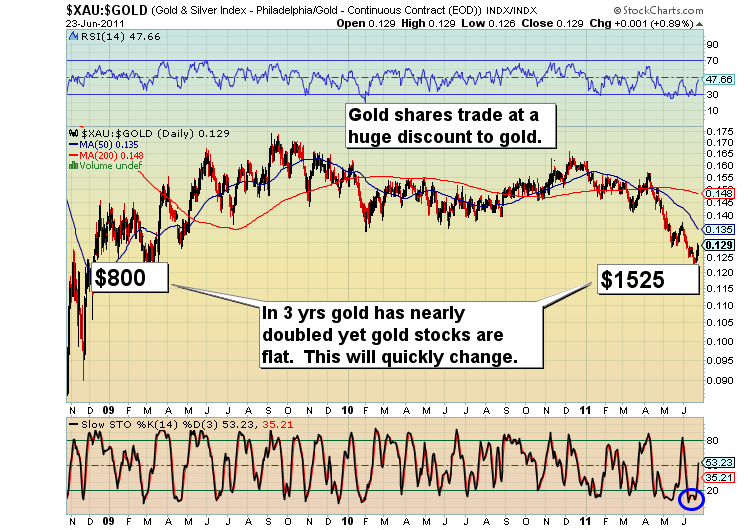
XAU vs. Gold Chart
XAU vs. Gold Analysis
• On the above chart you can see that gold has nearly doubled while gold stocks are flat. Generally speaking these gold companies have very healthy balance sheets and the product they mine is up 70% in three years, while their stocks prices have gone nowhere. That is an enormous buy signal!
• A lot of money has been made in the physical metals. The gold stocks have disappointed, but remain grossly undervalued. Buy the diversified GDX and GDXJ and take advantage of what could be the greatest bargain in the investment world!
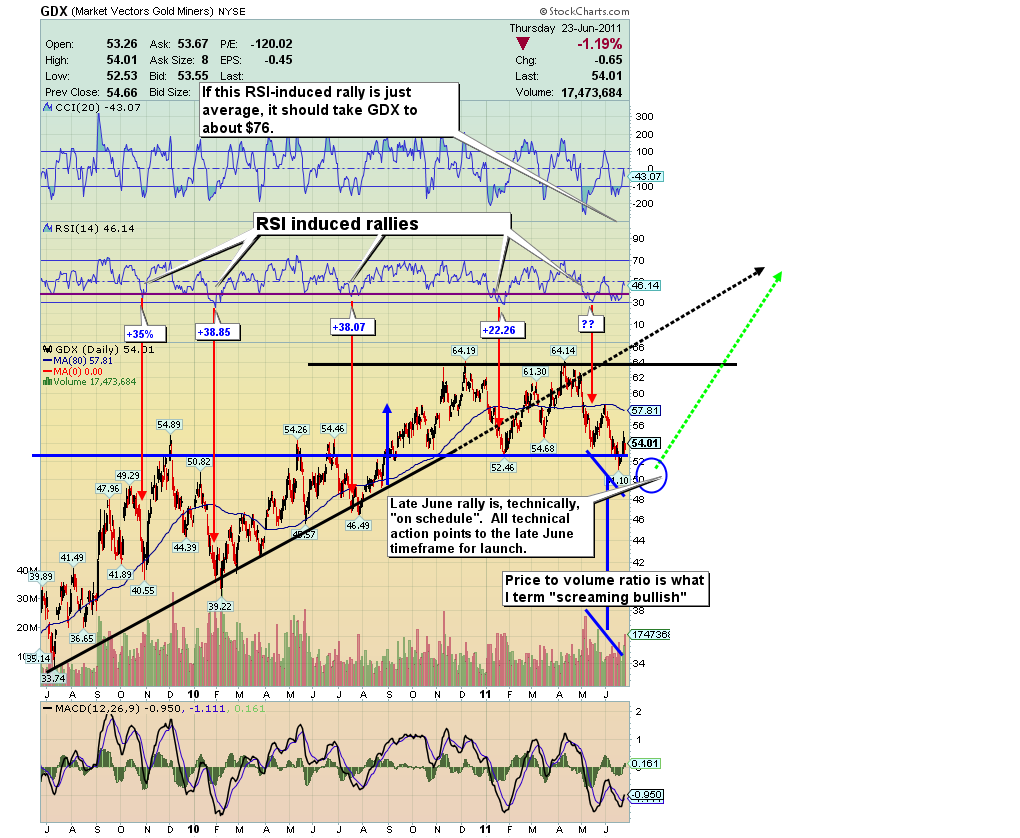
GDX 14 Month RSI-Induced Rallies Chart
• The late June bottom target I have indicated continues to look like the ideal place for the next meaningful up leg to start. The returns from low RSI readings in the past put the target in line with my January 2012 target of $72.
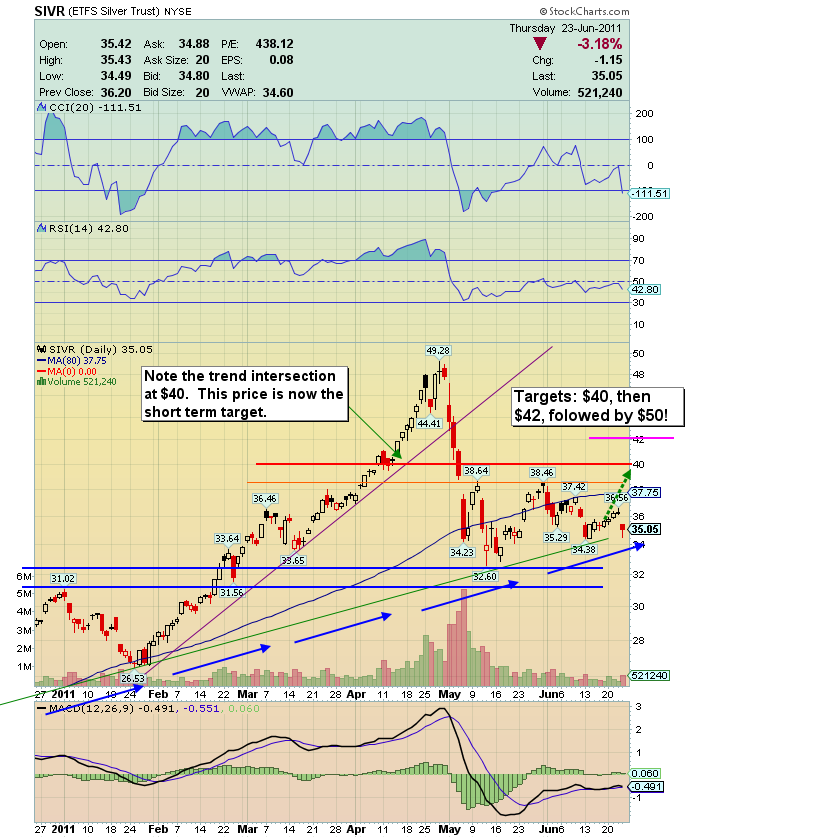
SIVR (Silver Bullion Proxy) Six Month Chart
• Silver is acting very healthy and resilient after the explosive move to the upside in the spring, considering that just a one week decline erased an entire third of its value in dollars. An associate who manages a metals fund reminded me this week that silver’s normal action is for rallies to begin slowly and build momentum as the rally matures.
• I targeted $50 earlier in the year and that target was acquired. I am expecting a move up to $42 in the short term, with $50 being seriously taken out by year-end. I’ve been a buyer of physical metal into this correction and urge you to do the same.
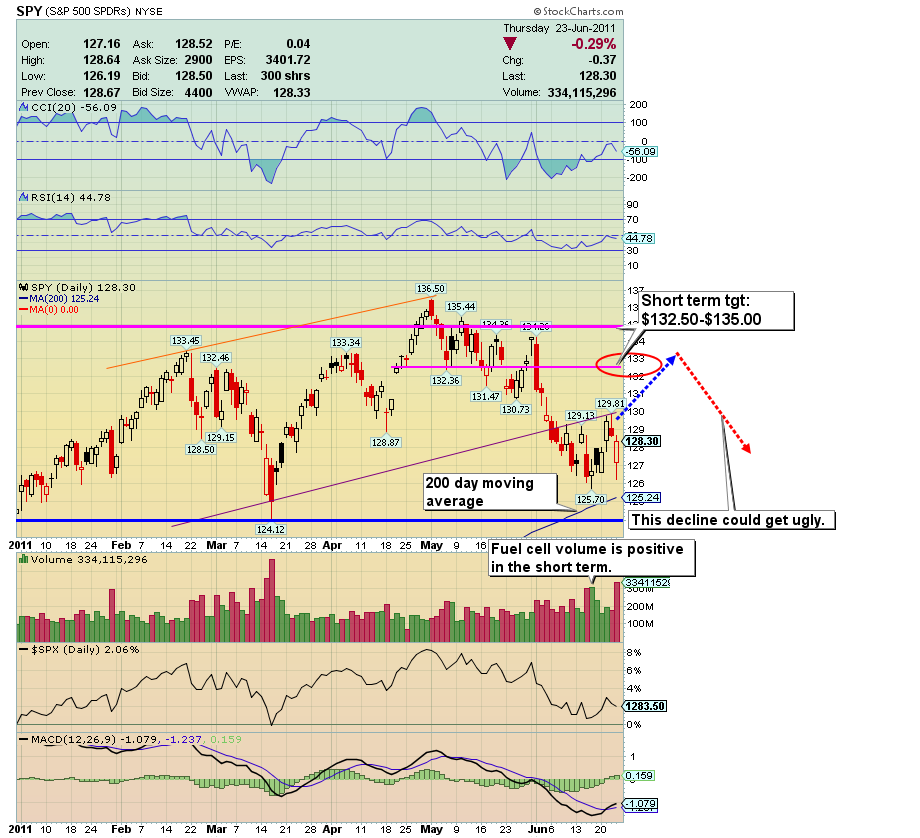
SPY (SP500 PROXY) 6 Month Chart
• I have included a look at the S&P 500 this week. The bigger picture is a bit ominous, but for now I have buy signals in play, and an upper target of 1350 over the next several weeks. After several down weeks dating back to May, the market is now oversold.
• The stock market is trading on an enormous amount of fear, and volume patterns point to a short term move higher, but there is a chance the March lows will be tested. From there, short term strength will likely continue to the $1350 target. I recommend selling into the target instead of waiting for price to hit the exact target.
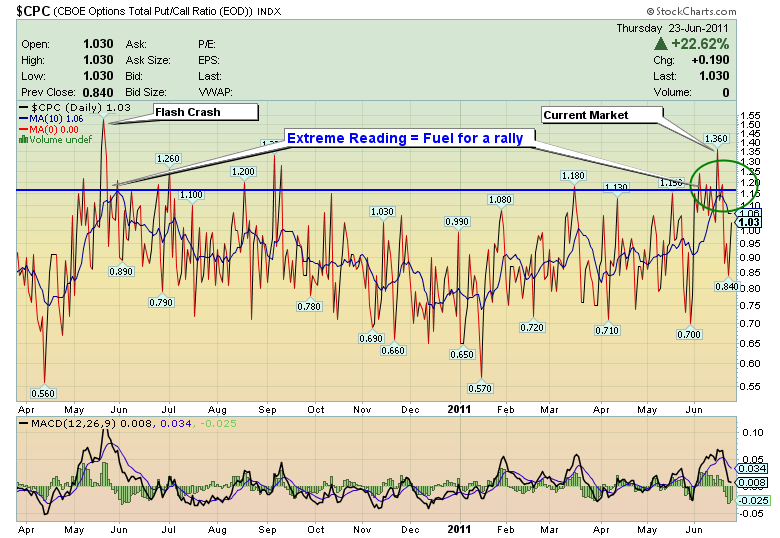
• Note my “Fuel Cell Volume Indicator” from June 16th, which told me the low was in. Also helping me to identify the bottom was the extreme reading of the put call ratio. Note the chart below. This ratio was in the nose bleed territory from where meaningful rallies often begin. Overall, I see this as nothing more than a relief rally, and what follows the relief rally could be fairly ugly.
Put to Call Ratio Chart
• Once the market works off the fear-induced short term rally the longer term market looks headed for trouble. A sharp sell off into late summer and into early fall seems probable.
• A report just put out by Mark Hulbert on stock market sentiment is quite interesting. Here is an excerpt.“...In other words, even though bullish sentiment has fallen by quite a bit since late April, that decline is not inconsistent with that witnessed at the beginnings of prior bear markets…”
• This market has legs in the short term, but real structural issues, and that means a deep correction, or worse, is likely after the relief rally runs its course. Markets have phases. Gold stocks won’t necessarily follow the stock market down.
• As with the seasonal issue, be careful about assuming that gold stocks are going down just because the stock market is in trouble. The viability of paper currencies was not questioned by most money managers in 2008, but now many are losing confidence in paper money!
Friday, Jul 24, 2026 Super Force Signals Unique Introduction For 321Gold Readers:
Send me an email to admin@supergoldsignals.com and I’ll send you my free “Inflation Thunder Now!” gold and silver stocks video report. I’ll also include 3 of my next Super Force Surge Signals free of charge, as I send them to paid subscribers. Thank you!
|
Stay alert for our Super Gold alerts, sent by email to subscribers,
for both the daily charts on Super Force Signals at www.supergoldsignals.com and for the 60 minute
charts at www.supergoldsignals.com
About Super
Gold Signals:
Our Surge Gold Signals are created thru our proprietary blend
of the highest quality technical analysis and many years of successful
business building. We are two business owners with excellent synergy.
We understand risk and reward. Our subscribers are generally successfully
business owners, people like yourself with speculative funds,
looking for serious management of your risk and reward in the
market.
Frank Johnson:
Executive Editor, Macro Risk Manager.
Morris Hubbartt: Chief Market Analyst, Trading Risk Specialist.
website: www.supergoldsignals.com
email:
admin@supergoldsignals.com
email: admin@supergold60.com
Mail:
1276 Lakeview Drive
Oakville, Ontario, L6H 2M8
Canada
###
Jun 24, 2011
Morris Hubbartt
321gold
Ltd
|
