Super Force Signals - A Leading
Market Timing Service
We Take Every Trade Ourselves
Fibonacci: Gold Stocks Thermometer
Morris Hubbartt
Weekly Market Update Excerpt
posted Jun 22, 2012
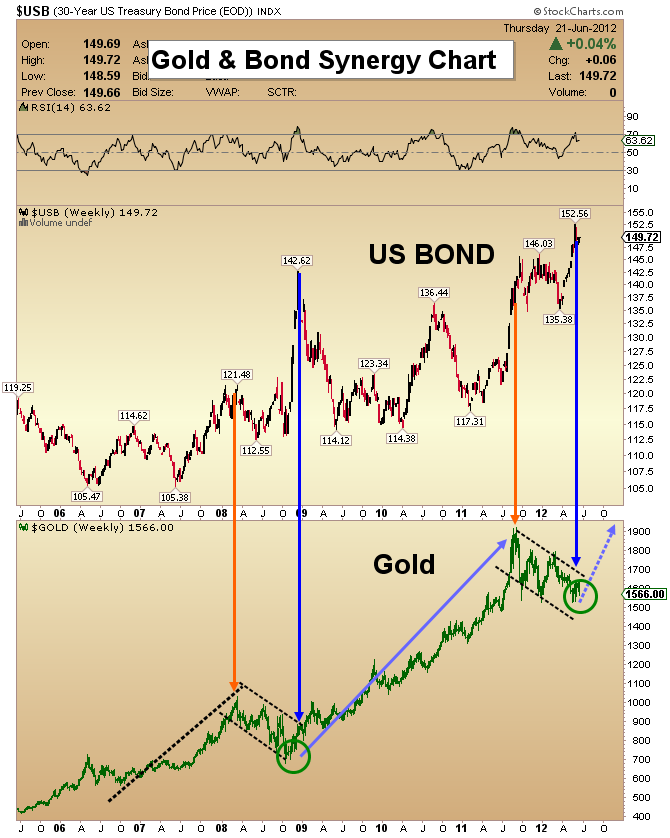
Gold & Bond Synergy Chart
- The US Bond market is a debt market. Evaluating the US bond from a fundamental view point shows there are several things that make the US bond a long term investment to avoid.
- The dollar is being diluted by the Federal Reserve’s quantitative easing programs. Upon maturity, bond investors are set to be paid with a currency worth much less than when the bond was issued.
- Most governments seem to be hopelessly addicted to spending money. The debt in the United States is now nearing $16 trillion, which is an amount too large to be honestly repaid.
- The deficit is now growing by roughly $1 trillion every year. It overwhelms GDP growth. For every dollar collected in tax revenue, an additional dollar is being borrowed. Higher taxes can’t fix the economy. They will slow it down and create even bigger deficits.
- From a technical stand point, the bond is overbought, yet it could become even more overbought.
- The gold & bond synergy chart that I am highlighting this week shows how the bond’s price action can signal the end of a gold market correction.
- Note the bullish rectangle technical pattern on gold in 2008, and how similar that is to today’s market. When bond prices are substantially extended, as they seem to be now, gold can begin a big move higher.
- Why become a creditor and buy debt you probably can’t collect on, when you can buy gold instead?
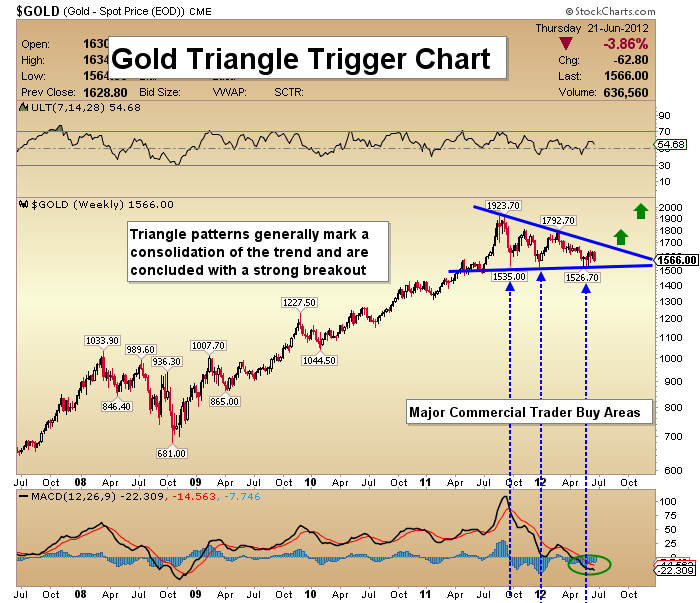
Gold Triangle Trigger Chart
- Gold appears to be completing its correction. A triangle formation is very bullish, and the MACD indicator at the bottom of this chart will likely be the trigger that shoots the gold bullet up and out of this triangle.
- Because this price pattern is most prominent on the weekly chart, it carries more “technical weight” than if it only appeared on a daily one.
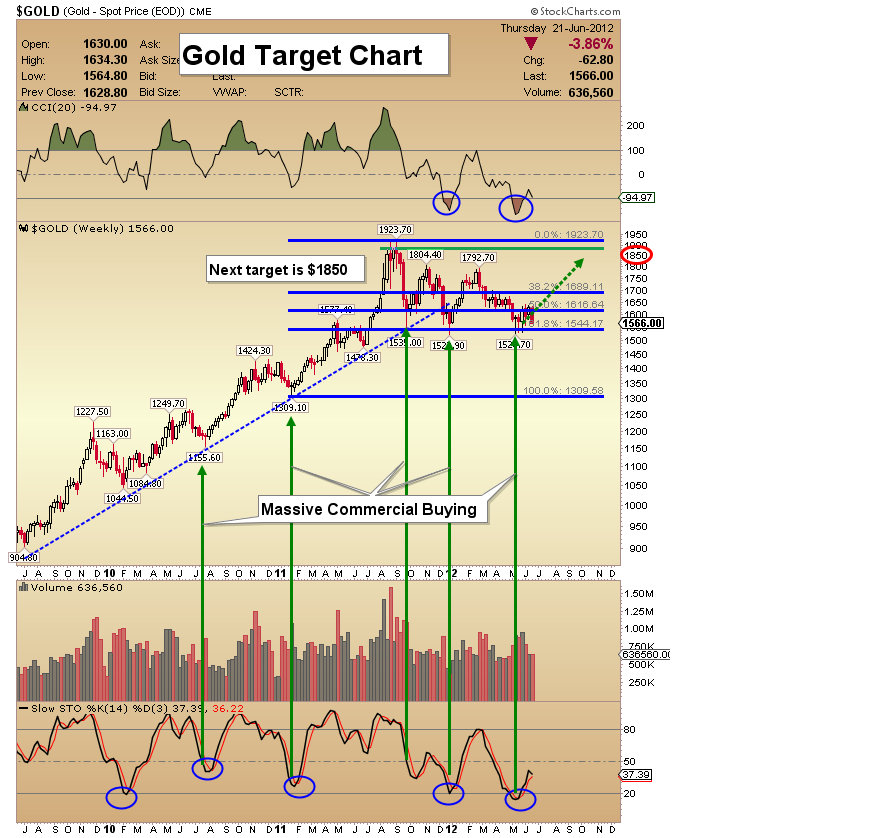
Gold Target Chart
- The 61.8% Fibonacci retracement line of the move from about $1309 to $1923 has been the main support for gold at the lows of this correction. Substantial commercial buying has occurred each time the price has declined towards $1544.
- The posture of the “Slow Stokes” and the CCI indicator are also bullish.
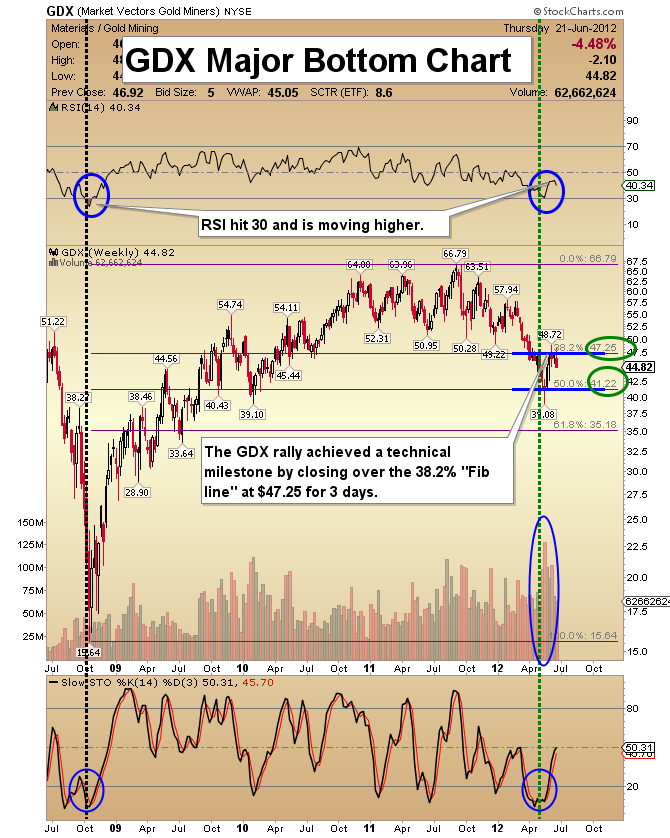
GDX Major Bottom Chart
- Senior gold stocks are arguably now leading the precious metals sector. GDX is doing battle at the important Fibonacci 38% bull market retracement level. The number I have been watching closely is $47.25.
- As of today, we have now had three closes above that level. The “three day close” is an event which confirms technical strength. My work targets $53.50-$55.
- A move above $48.50, if it comes on strong volume, would be further confirmation of a new bull phase.
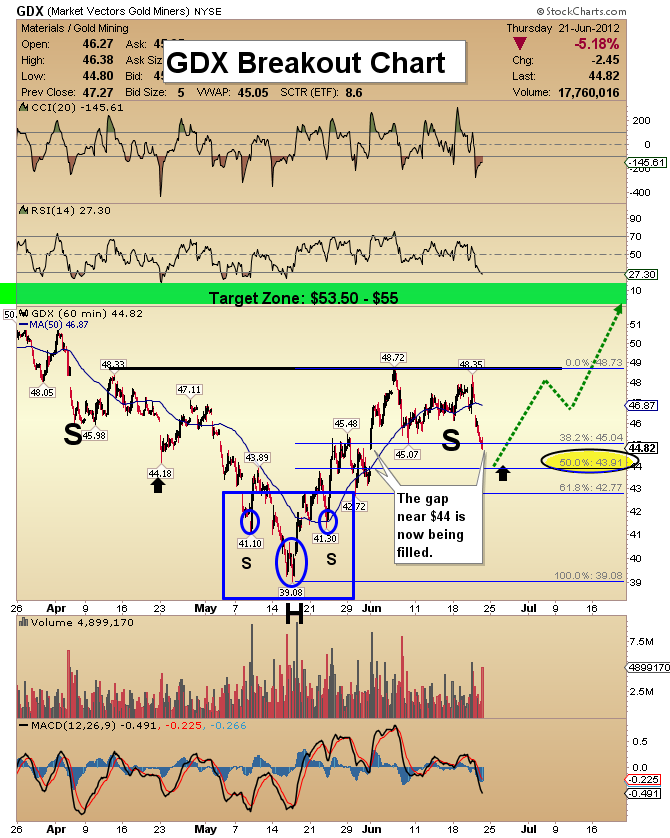
GDX Breakout Chart
- My work suggests that GDX will acquire the $53.50-$55 target area in late July. Senior gold stocks have performed quite impressively over the past month. Note that gap in the $44 area that has not been filled.
- The gap could be filled without negating the head and shoulders formation. The 50% Fibonacci retracement line sits at $43.91, which is right where that gap is. The Fibonacci indicator can be viewed as the gold stock thermometer, and it says a pullback to $44 is normal, healthy, and needed!
- Higher prices for GDX are very likely in July, with growing volatility.
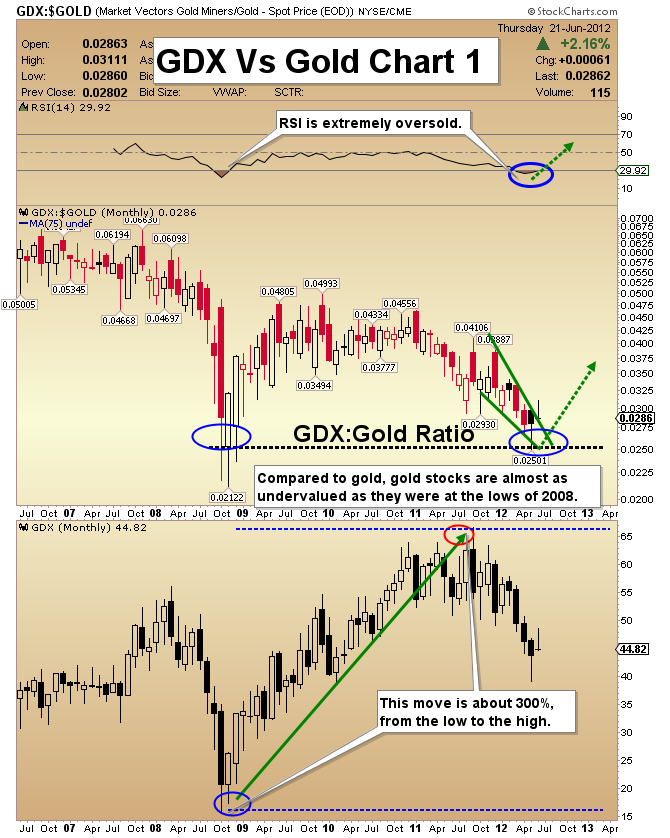
GDX vs Gold Chart #1
- The valuation of gold equities is astounding at current levels, compared to gold. The above ratio chart shows GDX is still nearly as undervalued as when it traded at $15-$20!
- It appears that a breakout has occurred, much like happened at the lows of 2008, when gold stocks gained about 300%.
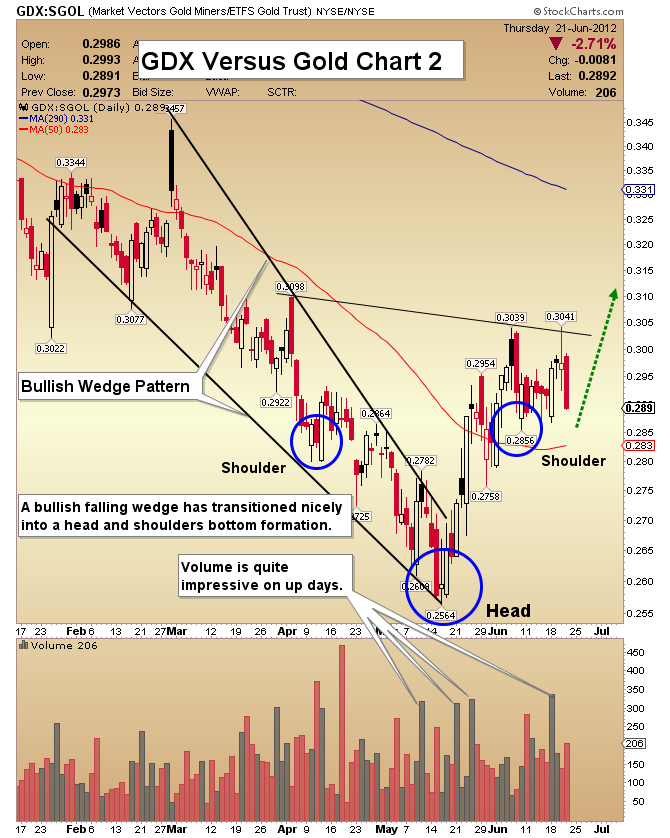
GDX vs Gold Chart #2
- The breakout from the wedge has been followed by the development of a solid head and shoulders pattern.
- Another outstanding feature of this breakout is the powerful volume, indicating the move has probably only just started.
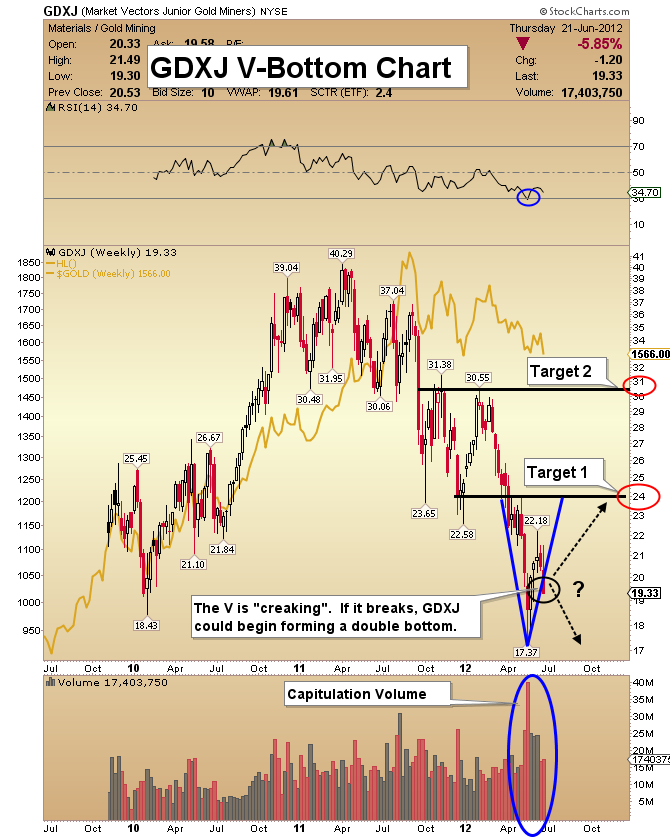
GDXJ V-Bottom Chart
- One of the key technical highlights in GDXJ has been the capitulation volume that occurred at the recent lows. I hoped the V-bottom would have helped to push GDXJ as high as $24, before a serious correction set in.
- So far that has been the case, yet price does need to accomplish that $24 level, or this market may abort the V-bottom and begin a double bottoming process.
- Double bottoms can be frightening to experience, but they are very bullish events.
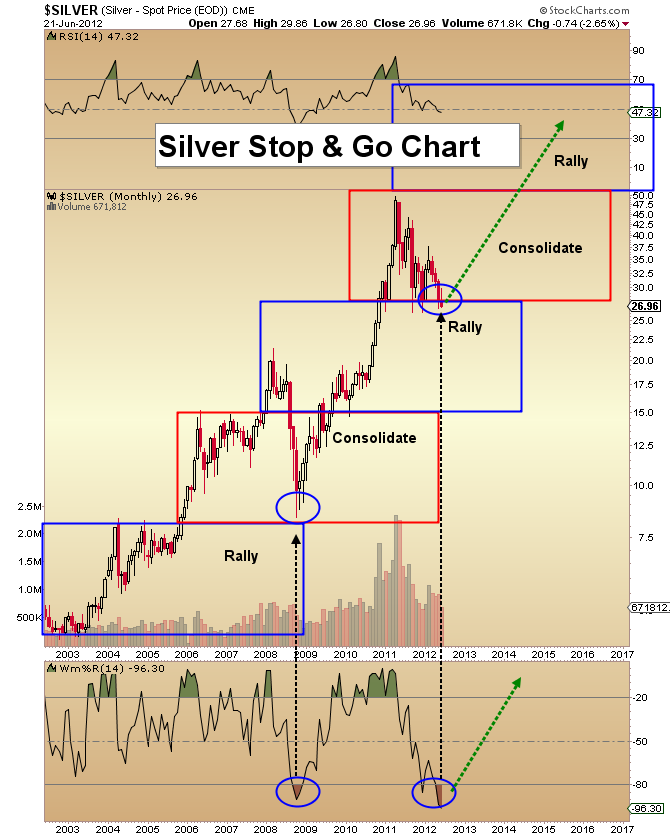
Silver Stop & Go Chart
- Silver is one of my favorite assets. I am highlighting a monthly chart of the white metal this week.
- Some technical indicators are now more oversold than at the lows of the 2008 crisis. Note the position of the Williams oscillator. Tremendous value is presenting itself to silver investors.
- Continued strong buying by commercial traders suggests substantially higher prices are likely.
- I’m not concerned that silver is lagging gold here. That’s normal at the beginning of a bull move in precious metals. June is seasonally a tough month for silver, but July can be excellent. Position yourself in June, so you profit in July!
Friday, Jul 24, 2026 Super Force Signals Unique Introduction For 321Gold Readers:
Send me an email to admin@supergoldsignals.com and I’ll send you my free “Inflation Thunder Now!” gold and silver stocks video report. I’ll also include 3 of my next Super Force Surge Signals free of charge, as I send them to paid subscribers. Thank you!
|
Stay alert for our Super Gold alerts, sent by email to subscribers,
for both the daily charts on Super Force Signals at www.supergoldsignals.com and for the 60 minute
charts at www.supergoldsignals.com
About Super
Gold Signals:
Our Surge Gold Signals are created thru our proprietary blend
of the highest quality technical analysis and many years of successful
business building. We are two business owners with excellent synergy.
We understand risk and reward. Our subscribers are generally successfully
business owners, people like yourself with speculative funds,
looking for serious management of your risk and reward in the
market.
Frank Johnson:
Executive Editor, Macro Risk Manager.
Morris Hubbartt: Chief Market Analyst, Trading Risk Specialist.
website: www.supergoldsignals.com
email:
admin@supergoldsignals.com
email: admin@supergold60.com
Mail:
1276 Lakeview Drive
Oakville, Ontario, L6H 2M8
Canada
###
Jun 22, 2012
Morris Hubbartt
321gold
Ltd

|
