Super Force Signals - A Leading
Market Timing Service
We Take Every Trade Ourselves
Gold and Sugar
Morris Hubbartt
Weekly Market Update Excerpt
posted Jun 17, 2011
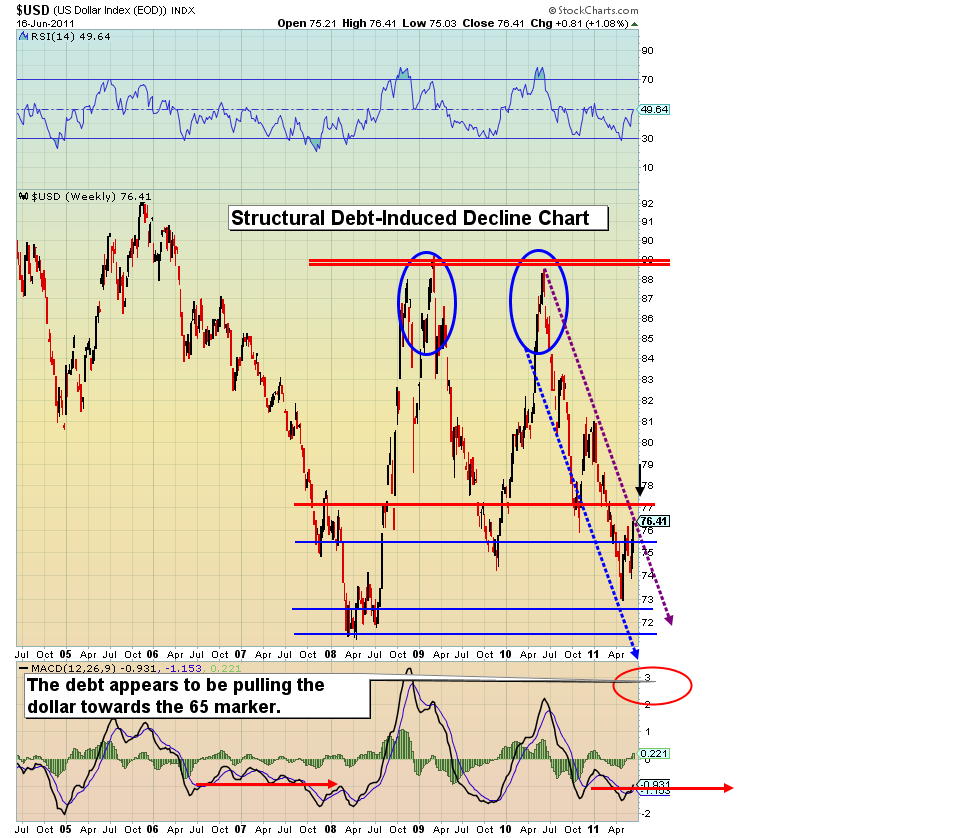
US Dollar Chart
Dollar Commentary
- Charts are created by fundamentals and liquidity flows. There is a debt train locomotive, and it should pull the US dollar chart train lower and lower, for many years to come.
- The enormous balance sheet damage of the last three years has created a weakening economy. This is not as dollar positive as it might initially seem. Massive damage is now being done to the Euro. As Europeans live a fiat currency and debt nightmare, they are starting to move not to the dollar, but to gold. Don’t be too quick to waste capital shorting the Euro that could be used to buy physical gold.
- There are limited solutions for a nation with a debt so big that it can never be repaid. That is America today. A slow-bleed death of the dollar is the most likely scenario to resolve this situation. My longer term target for the dollar on the $USD chart is 65, with an autumn 2011 time target.
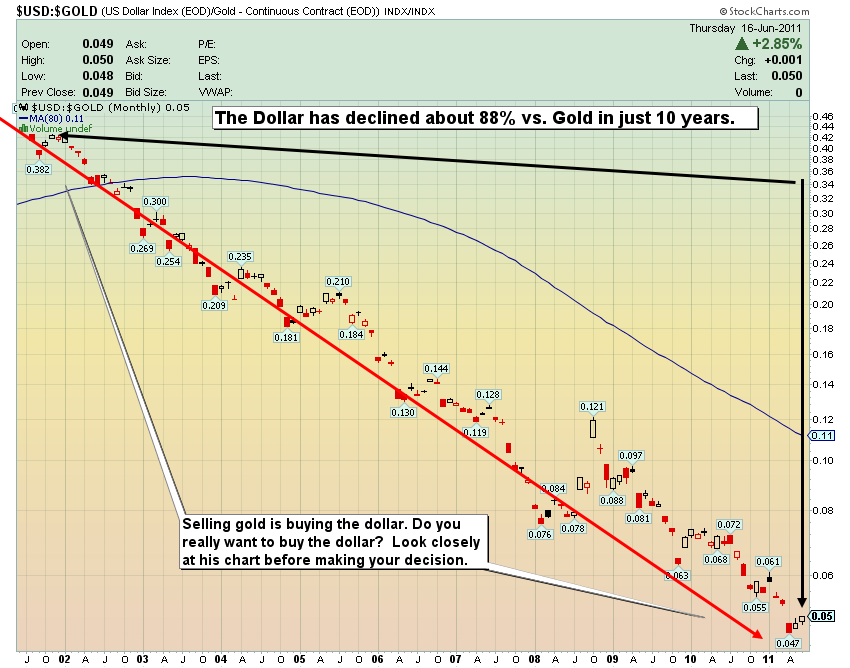
US Dollar Versus Gold Long Term Chart
- Take a good look at this chart. Look at the declining dollar vs. gold. Do you really want to sell your gold for dollars?
- This second chart I included for the US Dollar this week speaks volumes about gold as well as the dollar. We have a global debt crisis in the western world that probably dwarfs anything in the history books. Consider the debt of Europe, pile on the debt of the USA, then ice the debt cake with unfunded liabilities. There is a financial bomb inside that cake.
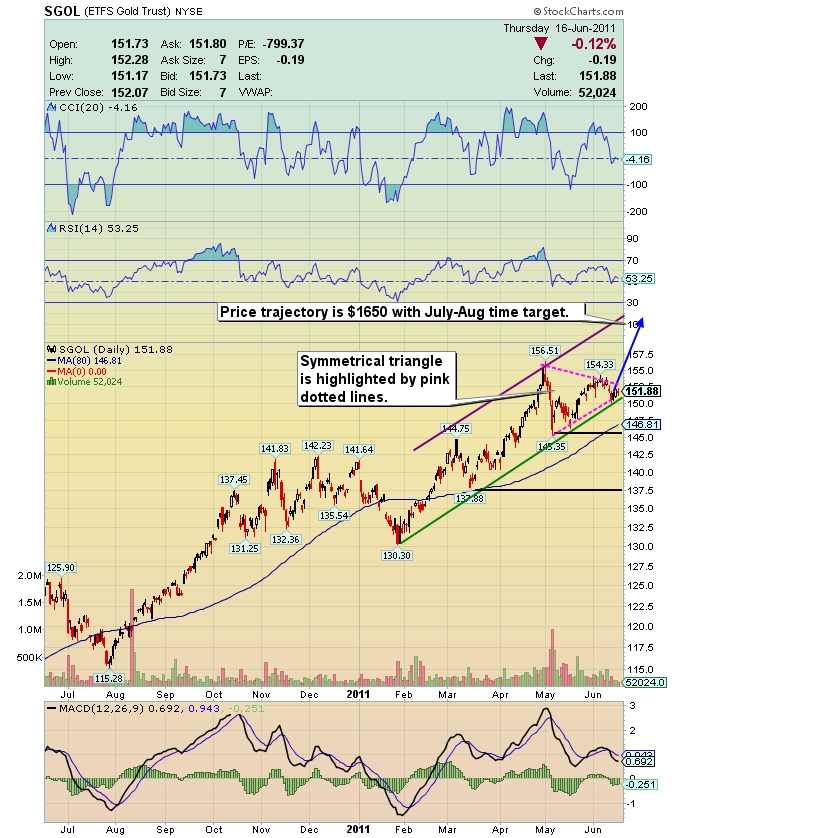
SGOL (gold bullion proxy) 12 Month Chart
- The consolidation process continues in gold. I look for the next breakout to occur in late June or early in July. The above chart paints an impressive picture for you.
- 30% of your physical metals should be kept outside the banking system. Get yourself to that number before the coming upside action gets underway, because once the train leaves the station, you may not be able to catch it.
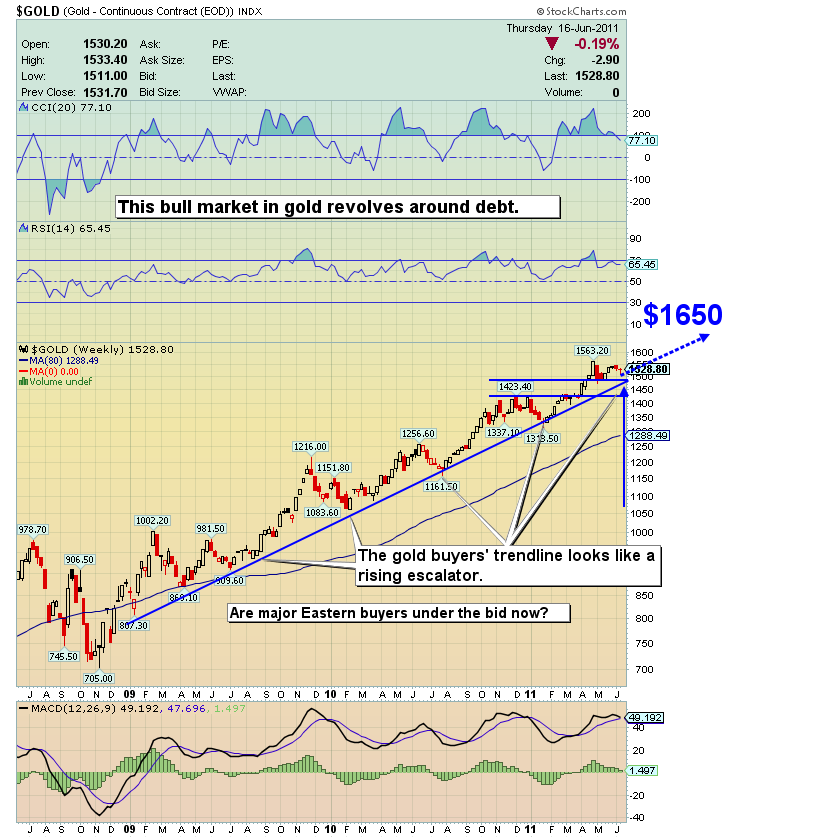
Gold 3 Year Weekly Chart
- Some of the greatest “demand fuel” under the gold market is the Eastern buying. China has an enormous need for metal. They probably have financial superpower status in mind, which means they need even more gold. Note the chart and the strong bid support on every pullback. I sometimes refer to the 3 year gold weekly chart as the “rising escalator” chart.
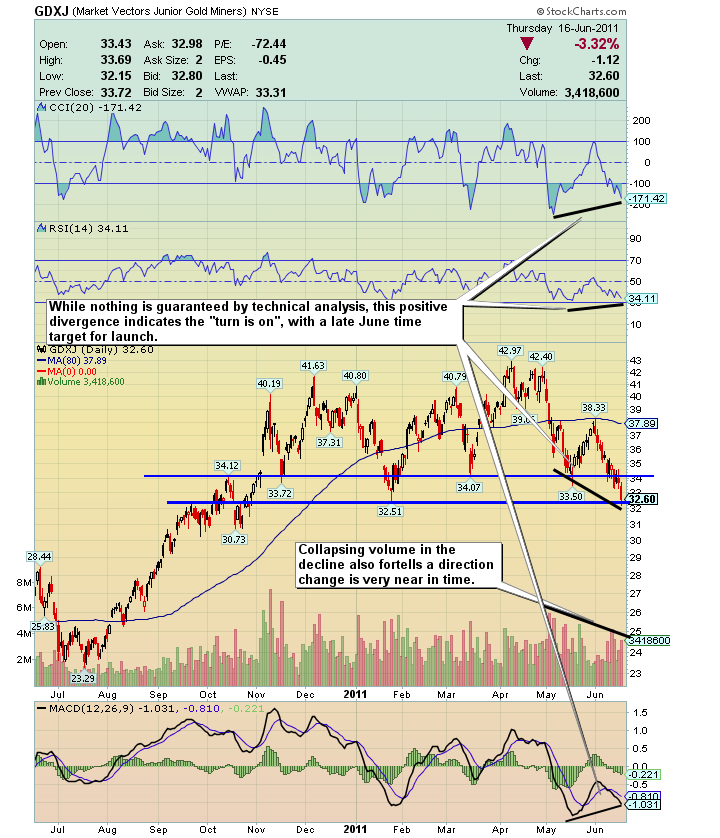
GDXJ Positive Divergences Chart
- I put new buys on GDX and GDXJ in the last couple of days. The above chart speaks volumes about the divergences that predict an abrupt end to the current decline. This has been a hard correction for gold stock holders, and the decline now looks to be in the final phase. Examine the chart. The technical divergences are compelling.
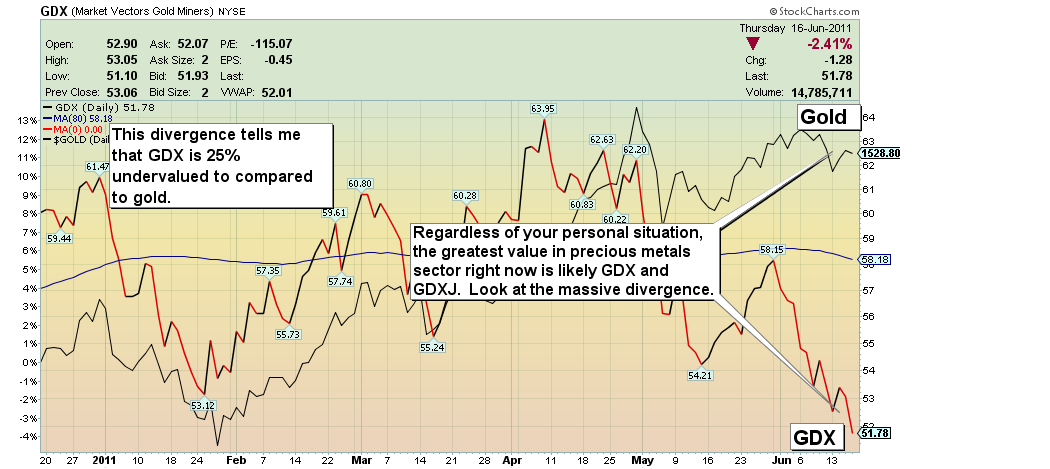
GDX Versus Gold Chart
- The point that I want to drive home is that gold stocks are undervalued and must be purchased. My technical work continues to point to a resumption of the bullish action earlier than we see in most years. The underperformance of gold stocks is compelling to value buyers.
- Gold stocks should be leading, yet they are falling further and further behind. The greater the divergence, the greater the buying opportunity. I believe you are living through what will become a “giant-sized replay” of the 1970s gold stocks lag situation.
- Many technicians are now saying, “because of the weakness in gold stocks, it’s time also to sell gold.” To buy what asset? Dollars? Look at the dollar to gold ratio chart and ask yourself a question: Is the debt crisis solved? Of course not. Be careful about betting against the main trend. A crisis has incredible volatility, and that’s painful, but attempting to avoid that pain by flip flopping your way through the crisis will bring only much greater pain.
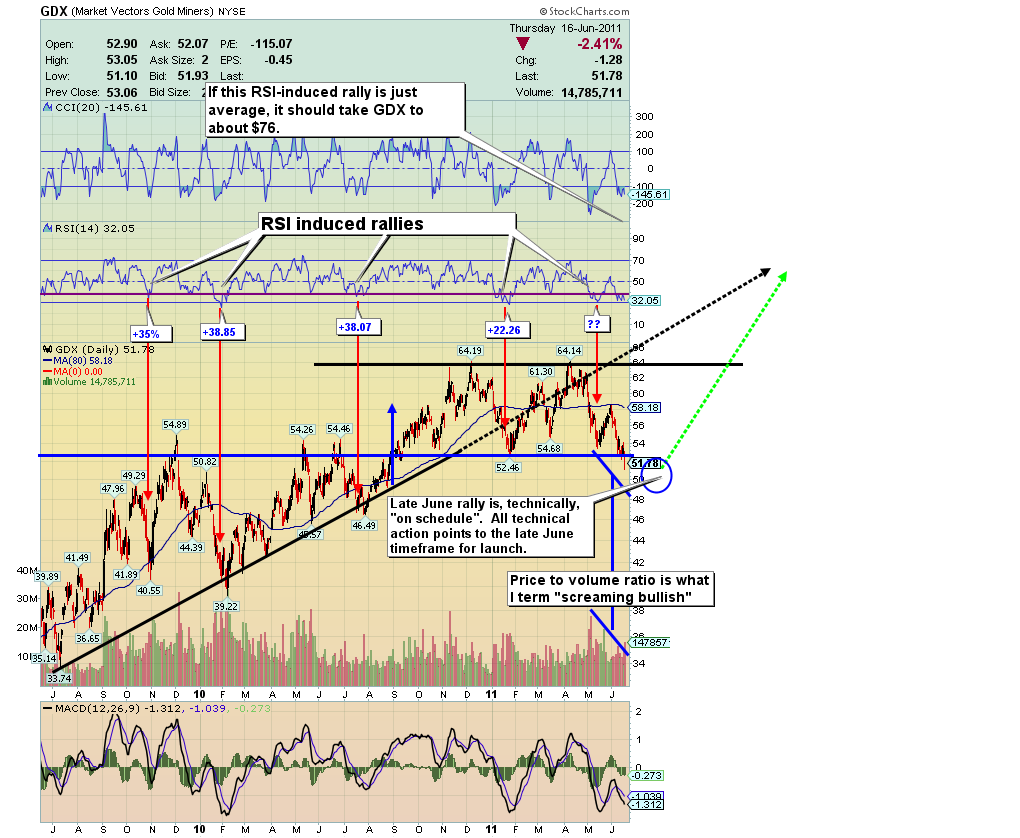
GDX RSI-Induced Rallies Chart
- Washout negative sentiment and oversold conditions on gold stocks are working together to set up a move that will likely see this sector sprint over 50% in a few months, and probably do it by December 2011.
- As price has continued to move lower, gold stocks have gotten more and more oversold. Oversold RSI accompanied by washout negative sentiment will trigger significantly higher prices. How high? Well, the average RSI-induced rally on this chart over 35%. It pays to be in a position to buy larger into the lower RSI numbers, which coincides with the majority of investor selling in pain.
- As I examine the trade, the time line looks ahead of “schedule”. Oversold conditions and negative sentiment are setting the table to see gold stocks begin making a move in the next couple of weeks. I’m becoming more and more convinced by my technical work that the best seasonal entry points are arriving early this year. The entire gold sector remains undervalued.
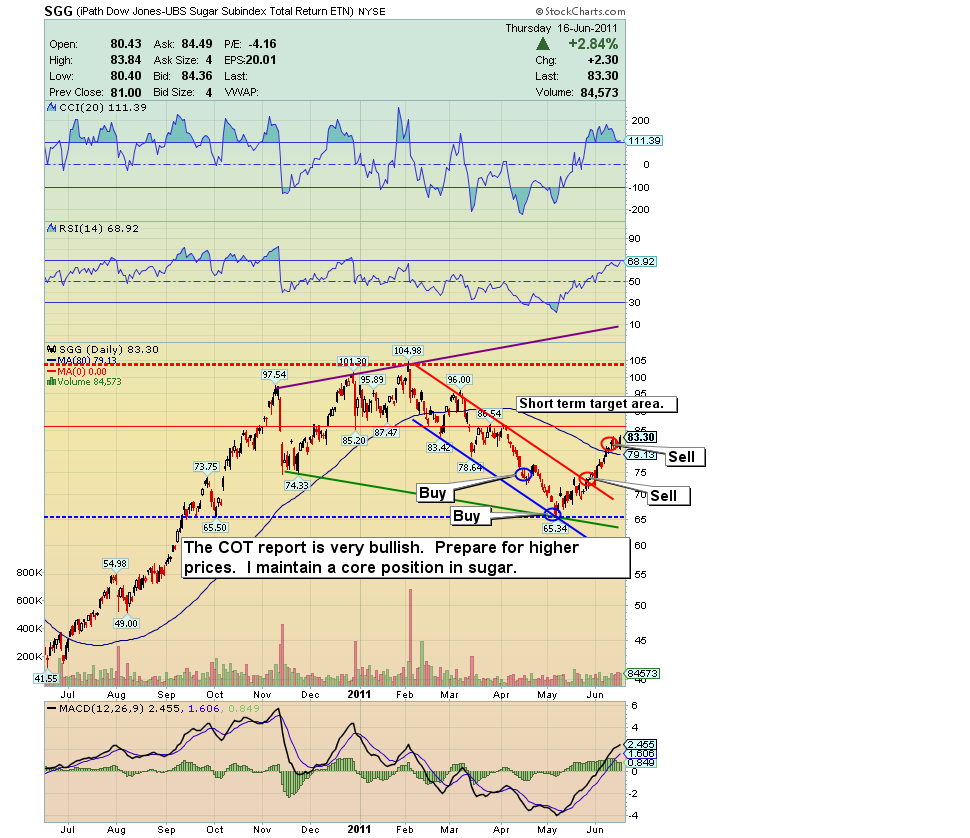
SGG (Sugar Proxy) Chart
- Sugar is a highly volatile commodity that is trading vastly below the highs attained in the 1970s bull market. Note the two trading system buys and the two sells on the chart. I prefer to see investors use my signals to build core positions rather than engage in the kind of flip flop action that builds excitement and disappointment more than profits.
- The temptation is always present to sell part of the core position, to “call the turn”. Sometimes that works, but my experience is that traders will do better by carrying core positions as well as trading positions. Sugar is a superb asset that makes an excellent holding in any “crisis portfolio”. When trading signal buys are generated, sometimes there is just one, but usually a few of them are generated. My suggestion is to allocate part of each or some entire buys to core holding positions. Put those away for the long term!
Friday, Jun 26, 2026 Super Force Signals Unique Introduction For 321Gold Readers:
Send me an email to admin@supergoldsignals.com and I’ll send you my free “Inflation Thunder Now!” gold and silver stocks video report. I’ll also include 3 of my next Super Force Surge Signals free of charge, as I send them to paid subscribers. Thank you!
|
Stay alert for our Super Gold alerts, sent by email to subscribers,
for both the daily charts on Super Force Signals at www.supergoldsignals.com and for the 60 minute
charts at www.supergoldsignals.com
About Super
Gold Signals:
Our Surge Gold Signals are created thru our proprietary blend
of the highest quality technical analysis and many years of successful
business building. We are two business owners with excellent synergy.
We understand risk and reward. Our subscribers are generally successfully
business owners, people like yourself with speculative funds,
looking for serious management of your risk and reward in the
market.
Frank Johnson:
Executive Editor, Macro Risk Manager.
Morris Hubbartt: Chief Market Analyst, Trading Risk Specialist.
website: www.supergoldsignals.com
email:
admin@supergoldsignals.com
email: admin@supergold60.com
Mail:
1276 Lakeview Drive
Oakville, Ontario, L6H 2M8
Canada
###
Jun 17, 2011
Morris Hubbartt
321gold
Ltd
|
