Super Force Signals - A Leading
Market Timing Service
We Take Every Trade Ourselves
Green Lights For Gold!
Morris Hubbartt
Weekly Market Update Excerpt
posted Jun 15, 2012
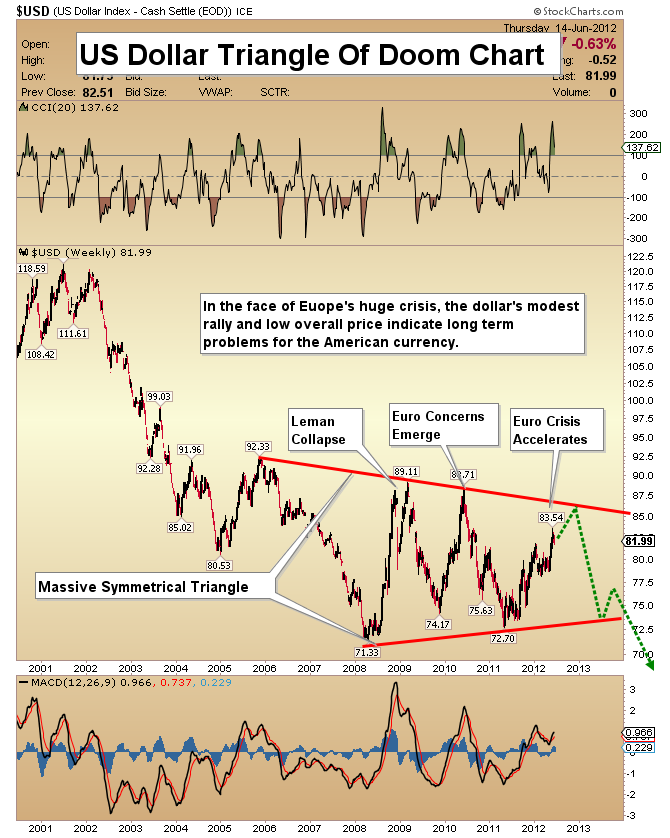
US Dollar Triangle Of Doom Chart
- Due to the European debt crisis, there has been a move into the US dollar in recent weeks. When looking at the USD trade over the past decade, the only time you will find substantial strength is when an economic disaster appears.
- Is a currency fundamentally strong if it only rallies when people buy it in a panic? In the big picture, the grizzly bear of debt continues to prey on the dollar.
- The dollar is much closer to making an all-time low than the euro is, even after the recent tumble in the euro. The euro is about 34% above its lows, while the dollar is only about 14% above its lows.
- Why isn’t the dollar stronger in “phase 2” of the euro crisis than it was in phase 1? Is the dollar’s poor performance indicating that it is headed for new lows?
- The solutions offered by the leaders of the world could begin to threaten the personal savings of many retired persons, by causing a tremendous loss in the dollar’s purchasing power.
- My recommended strategy throughout this crisis is to use US dollar strength to buy more physical gold. Keep a portion of your gold outside of the banking system.
- The target of the symmetrical triangle is about 55. That’s a move that could put the price of gold well above $2000.
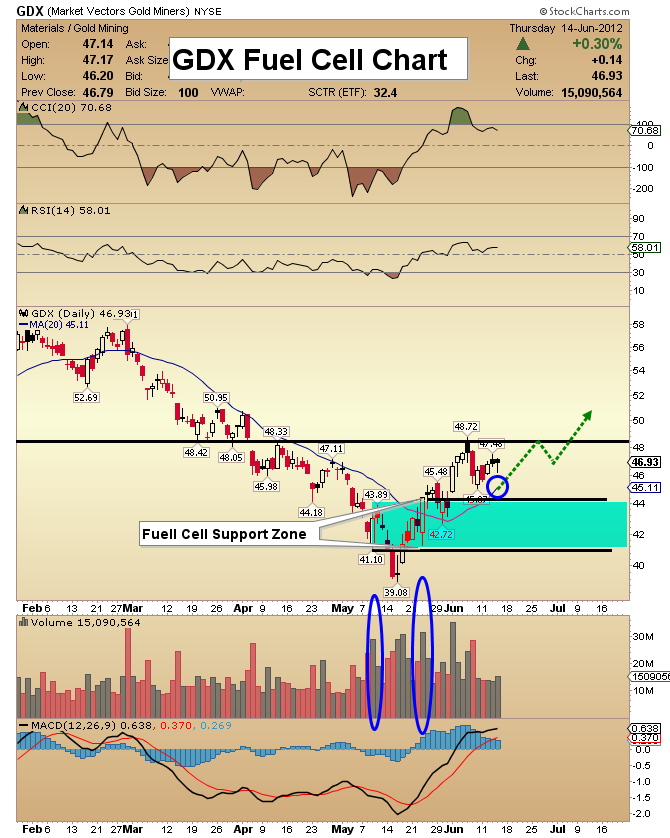
Gold Fuel Cell Chart
- One of the most important days in gold trading this year took place on June 1st, when gold delivered a “Fuel Cell Volume” (FCV) signal.
- This technical indicator often signals the beginning of a change in the character of a market. Once the signal is in place, a bear market or major bull market correction can undergo a dramatic transformation and turn into a reinvigorated bull market.
- This appears to be exactly what happened on June 1st. Now that the FCV signal is in place, the next step is to use it to identify areas of strong technical support.
- Gold has gained resiliency since this FCV occurred. There is now fuel cell support throughout the entire $1560-$1625 area!
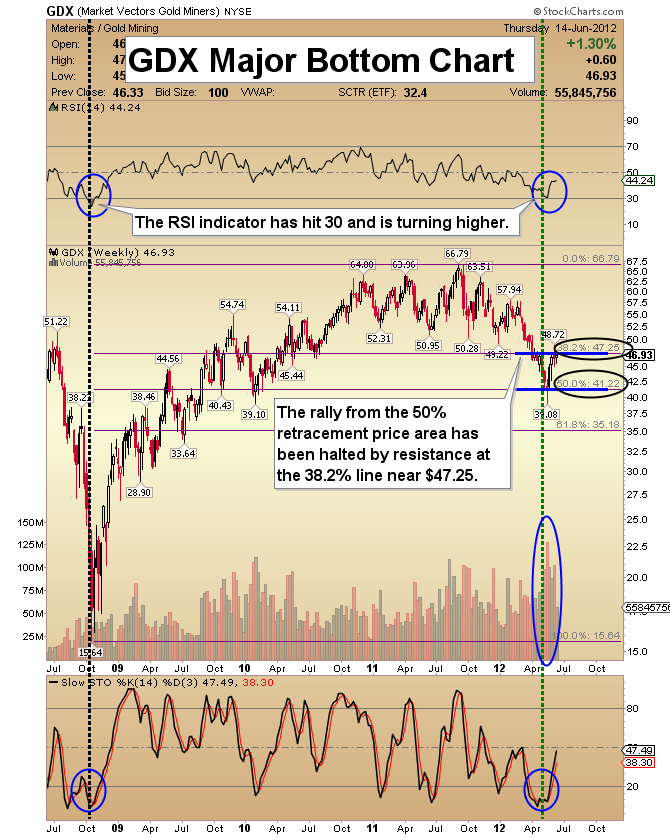
GDX Major Bottom Chart
- I have been saying repeatedly that the entire precious metals sector is putting in a major bottom. That bottoming process is most evident in gold stocks.
- It’s important to analyze when an FCV signal occurs. Gold Stocks bottomed in mid-May and the FCV indicator came shortly thereafter, which is very bullish.
- I’m targeting a move up to $1825-$1850, and then a shallow pullback. That dip should be followed by an even stronger price rise later this year.
- Currently GDX is consolidating at the 38% bull market retracement level of $47.25. I’m very impressed with how well the price is holding here.
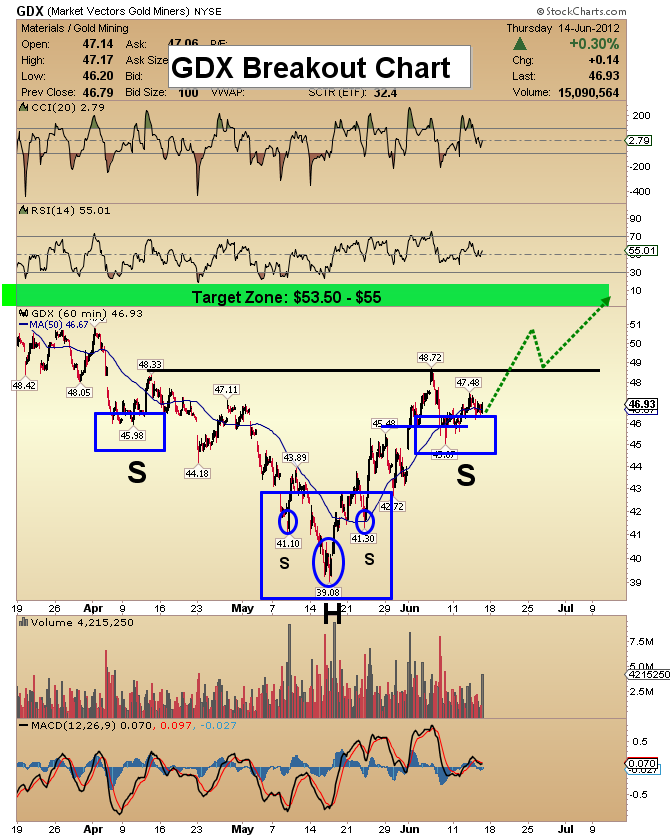
GDX Breakout Chart
- There is a very nice inverse head and shoulders formation in play.
- The target zone is $53.50-$55, and it should be acquired by late July.
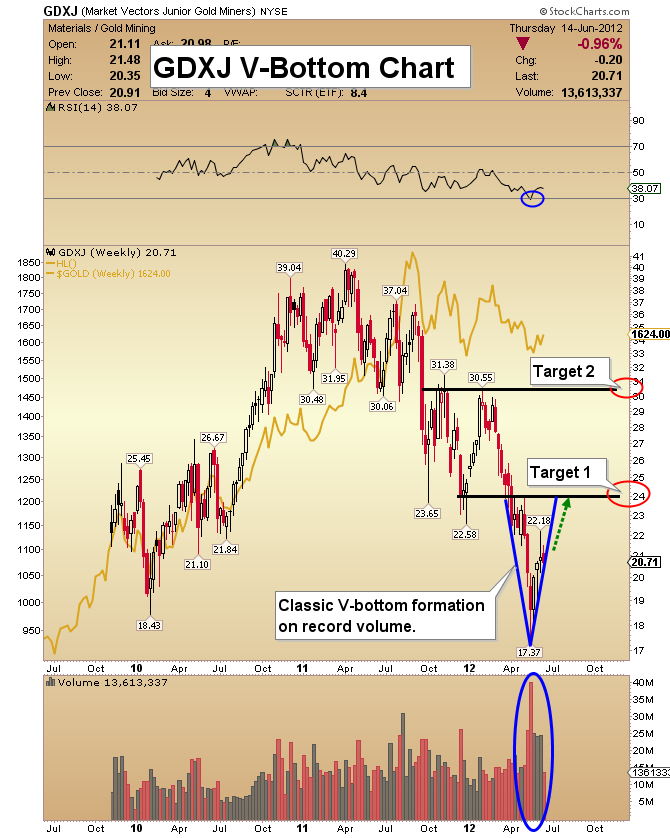
GDXJ V-Bottom Chart
- When a bottom in gold stocks occurs, junior gold stocks tend to bottom together with the seniors, but it is the senior stocks that lead the start of an initial move to the upside.
- Gold and silver bullion act in a similar fashion. Silver usually bottoms when gold does, but it can lag gold as the next bull market phase gets underway. As the move matures, silver takes the lead. I expect junior gold stocks to outperform their senior brethren in the same fashion.
- Enormous volume occurred at the bottom, indicating a sizable transfer of stock, from weak to strong hands.
- If you look at the price action inside the V itself, you can see that GDXJ has not fallen out of the steep channel since it bottomed. This technical action is extremely bullish.
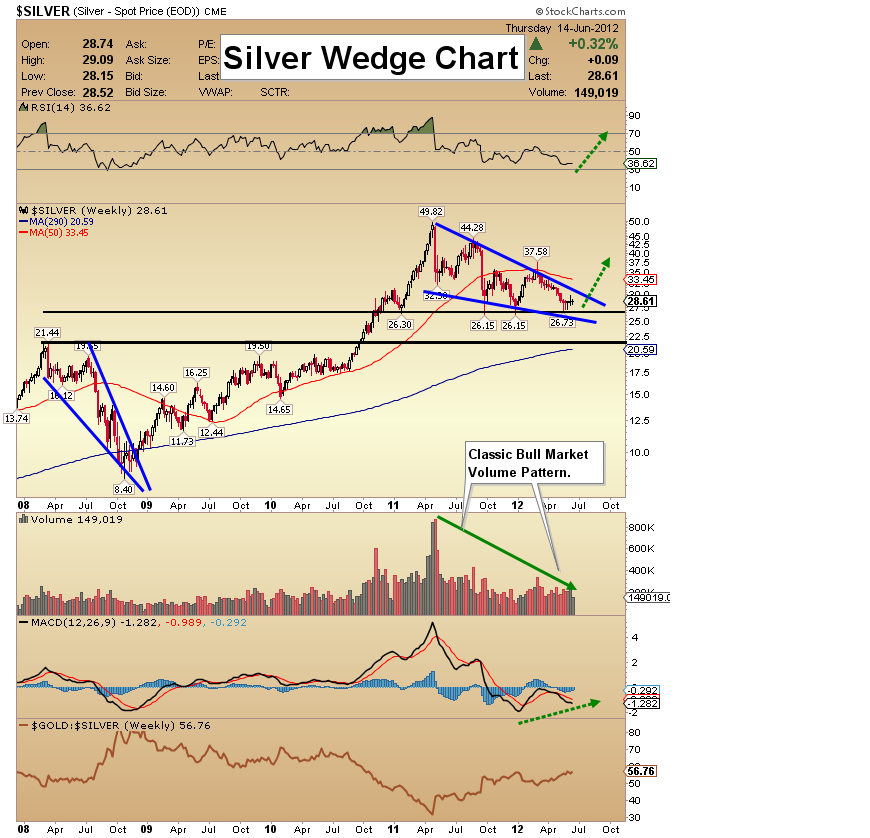
Silver Wedge Chart
- The price of silver has declined from the highs reached about a year ago. Volume has also declined, meaning this is probably a text book correction in a long bull market. The wedge on the weekly chart projects a move to significantly higher prices.
- Silver equities may lag gold equities in the beginning of a move higher. Silver stock investors need to employ lots of patience. You should see substantial price appreciation over time.
- My technical work indicates that it could be late 2012 before the silver price really makes a dramatic move higher. At that point I expect it to begin to outperform gold dramatically. At all prices under $30, silver is a strong buy.
- Note the price action that occurred after the first wedge formed in 2008. The price rose steadily, and once it got over the high at $21.44, it went into “runaway” mode. I expect another dramatic burst upwards in price, if silver rises over $50. All the "technical lights” for the entire precious metals sector are green, and getting greener!
Friday, Jul 3, 2026 Super Force Signals Unique Introduction For 321Gold Readers:
Send me an email to admin@supergoldsignals.com and I’ll send you my free “Inflation Thunder Now!” gold and silver stocks video report. I’ll also include 3 of my next Super Force Surge Signals free of charge, as I send them to paid subscribers. Thank you!
|
Stay alert for our Super Gold alerts, sent by email to subscribers,
for both the daily charts on Super Force Signals at www.supergoldsignals.com and for the 60 minute
charts at www.supergoldsignals.com
About Super
Gold Signals:
Our Surge Gold Signals are created thru our proprietary blend
of the highest quality technical analysis and many years of successful
business building. We are two business owners with excellent synergy.
We understand risk and reward. Our subscribers are generally successfully
business owners, people like yourself with speculative funds,
looking for serious management of your risk and reward in the
market.
Frank Johnson:
Executive Editor, Macro Risk Manager.
Morris Hubbartt: Chief Market Analyst, Trading Risk Specialist.
website: www.supergoldsignals.com
email:
admin@supergoldsignals.com
email: admin@supergold60.com
Mail:
1276 Lakeview Drive
Oakville, Ontario, L6H 2M8
Canada
###
Jun 15, 2012
Morris Hubbartt
321gold
Ltd

|
