Super Force Signals - A Leading
Market Timing Service
We Take Every Trade Ourselves
Gold & Gold Stocks: Roadmap To $1700
Morris Hubbartt
Weekly Market Update Excerpt
posted Jun 10, 2011
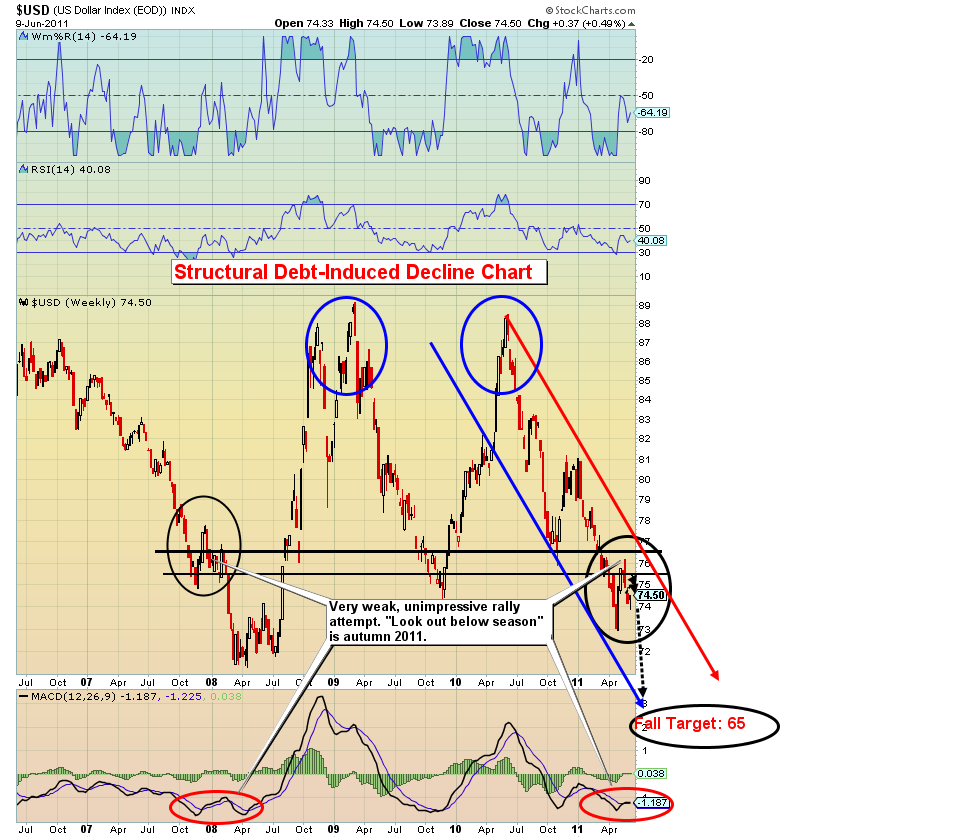
US Dollar Chart
US Dollar Analysis
- The US government is spending approximately three dollars for every one dollar taken in. You are told this is being done to create “economic recovery”. Houston, we have a US dollar spaceship problem, because there is no balance sheet recovery.
- The people in power believe massive spending and borrowing more will heal this epic debt problem. Look at my US dollar chart above. Over the last year you can see that quantitative easing is invisibly stealing money out of American bank accounts. The most recent rally attempt of the dollar was pathetic, and a dramatic decline is near.
- This is not the 1970s. What is missing this time is wage inflation that attempts to keep pace with price inflation. Government austerity has to come. Payrolls will be reduced. Tax receipts have plunged, yet government spending is going through the roof in the name of recovery. My advice for months has been to hold metals… outside the banking system.
- Look closely at the technical comparison on the US dollar chart between the current price and volume action, and the action late in the year of 2007.
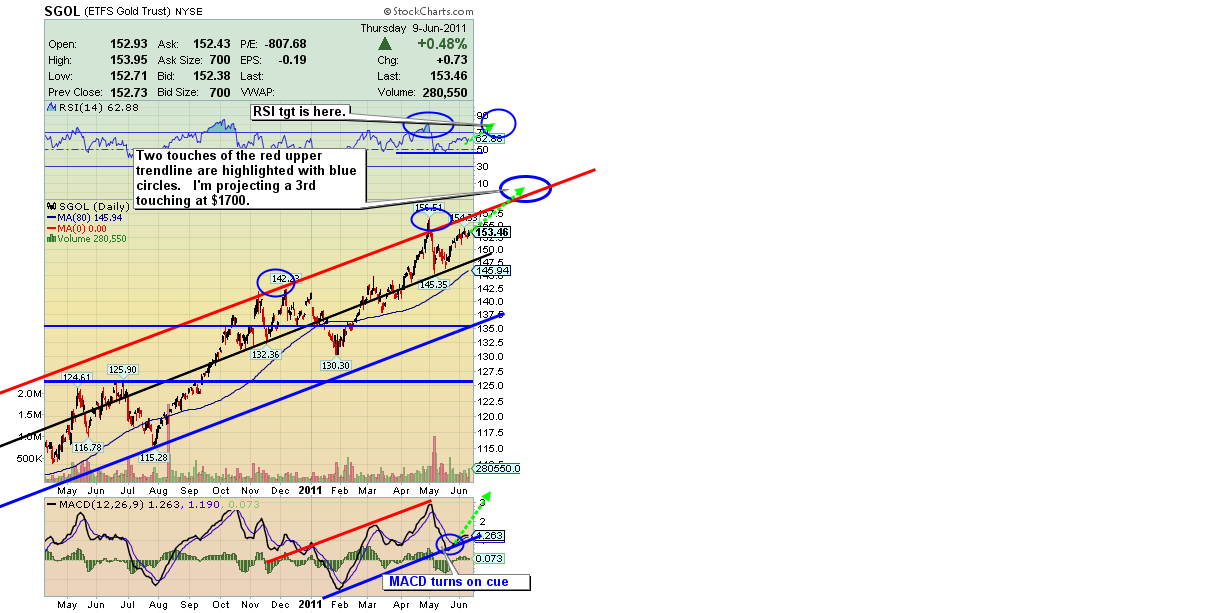
SGOL (Gold Bullion Proxy) Channel Overshoot Chart
- My time target for the next meaningful gold rally is late June. The price channel overshoot on the above SGOL chart to $156.50 indicates gold bullion should rise to $1700 very quickly. The current lack of price weakness in bullion is stunning, and a powerful harbinger of higher prices to come, across the precious metals price board.
- When a market is in a natural season of correction and consolidation, like gold is now, and instead it meanders higher, that is very bullish technical action.
- Most important for many of you will be the effect this projected gold price rise will have on gold stocks. I expect a tremendous move to the upside in gold stocks, fuelled by enormous short covering action.
- I think I’ve been clear and consistent with my roadmaps for the dollar, gold, and gold stocks and over the past month I’ve personally invested more heavily in gold stocks than at any point in my lifetime. If I’m wrong about the super bull move in gold stocks that I believe begins within weeks, I’m fully prepared to eat my share of financial crow. I won’t liquidate. I’ll take the pain alongside you.
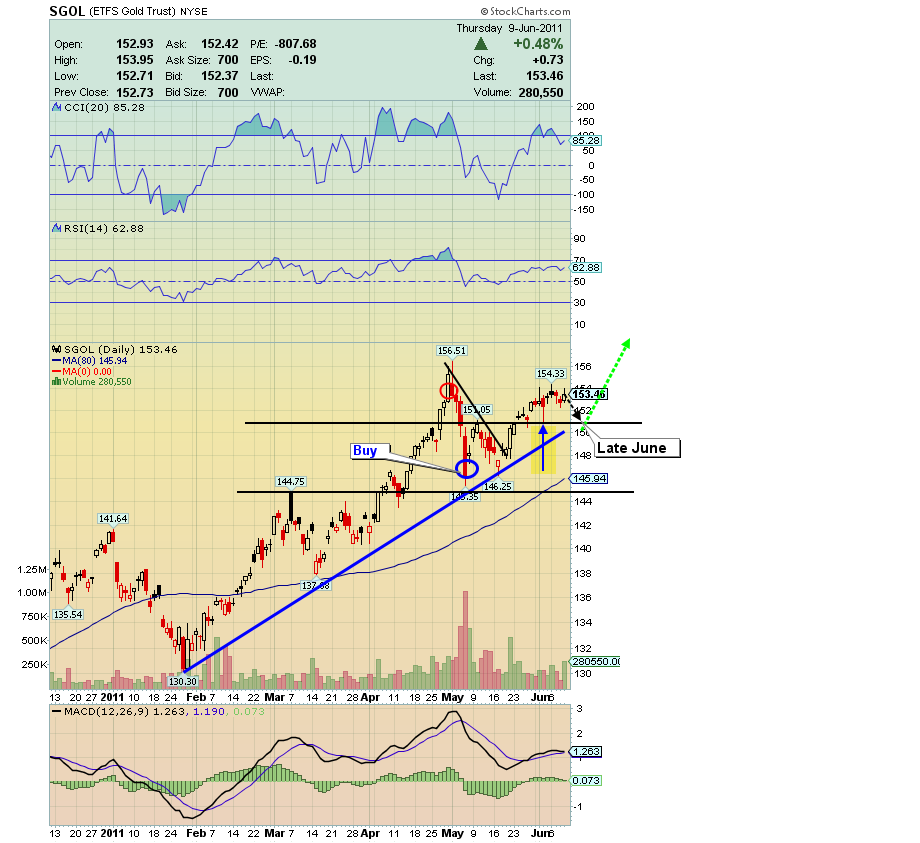
SGOL 6 Month Chart
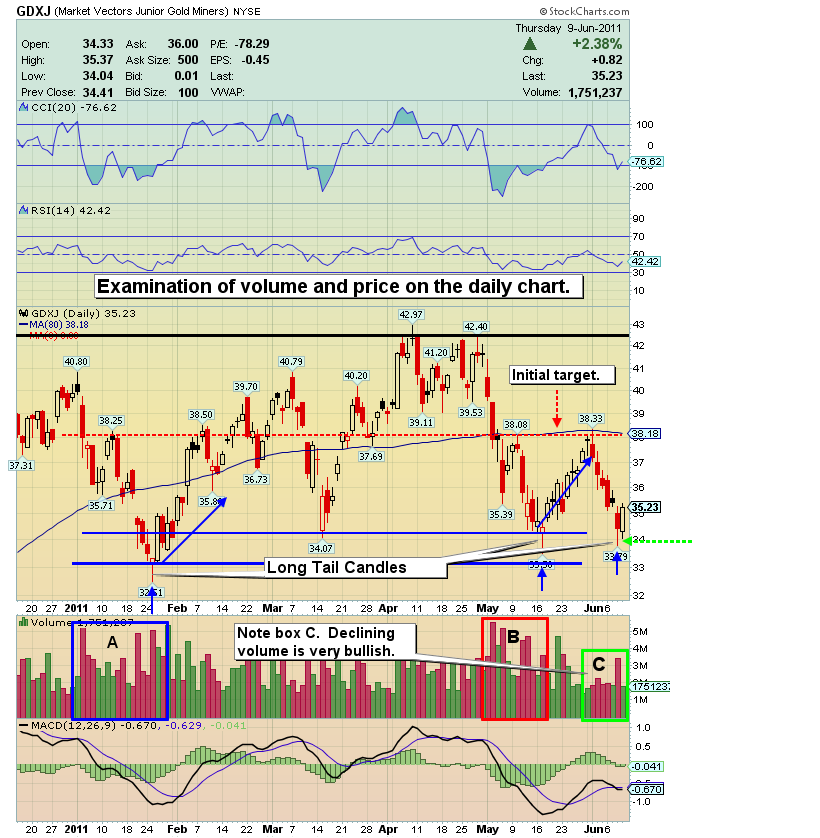
GDXJ 6 Month Volume Set-Up Chart
- After suggesting you book profit into early June, I issued brand new buys on both GDX and GDXJ in the last week as price moved down and tested the previous lows. This comes after taking profit the previous week.
- Note the lettered boxes at the bottom of the chart. Box C has by far the softest volume of all corrections. Another “positive” on this chart is the long tailed candles that tend to be frequently associated with this sector making a bottom. I was a buyer into those (painful) lows on Wednesday.
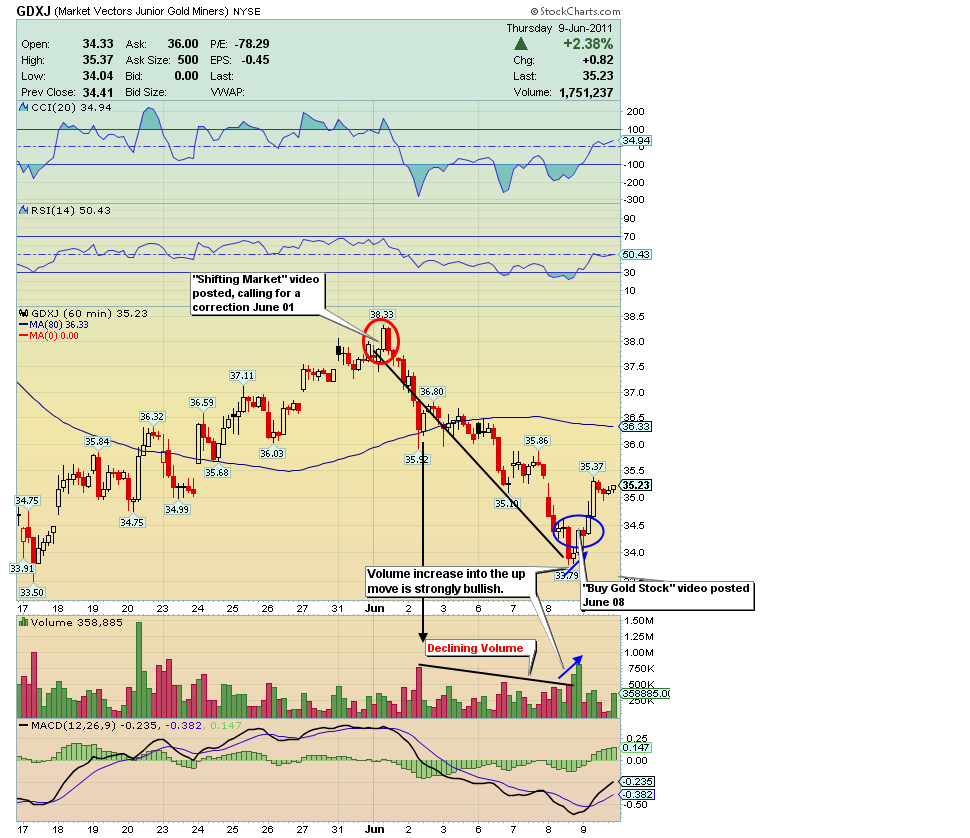
- I also have included the 60 minute GDXJ chart below. This chart gives critical insight; note the declining volume after the June 1st price peak. Notice the volume/price upside pop at the end of that move. This is the price and volume action you want to see; volume fades as price goes lower, until you get the upside pop on higher volume (green candle). Look for a direction change when that happens, and it just did! I posted video analysis of why I issued those buy and sell signals on the website. Send me an email to trading@superforcesignals.com and I’ll send you those videos.
GDXJ 60 Minute Buy Set-Up Chart
GDXJ 14 Month Buy Set-Up Chart
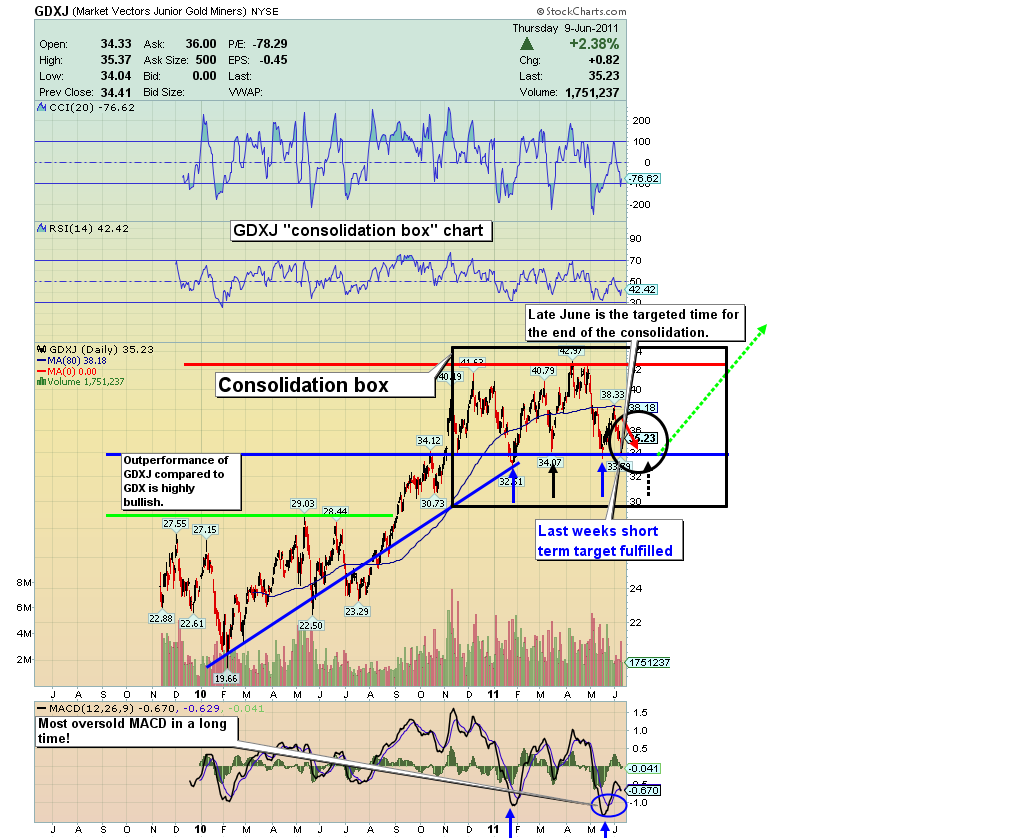
- The third chart I have included for GDXJ is best labelled the “consolidation box” chart. This chart shows the short term downside target that I identified to you last week has been fulfilled. This chart now indicates that price is ready to move higher!
- The typical reaction to a double bottoming process is disbelief. The sentiment that I am examining is as negative as it gets. The table is set; I see a 50% rally unfolding by the end year in this sector. The other thing I see helping gold stocks is the sentiment in the US Stock Market. Likewise, it too is indicating a bottom is at a hand. I have been a buyer of US equities this week. A stronger US market will likely be led by gold stocks.
GDX 14 Month RSI-Induced Rally Chart
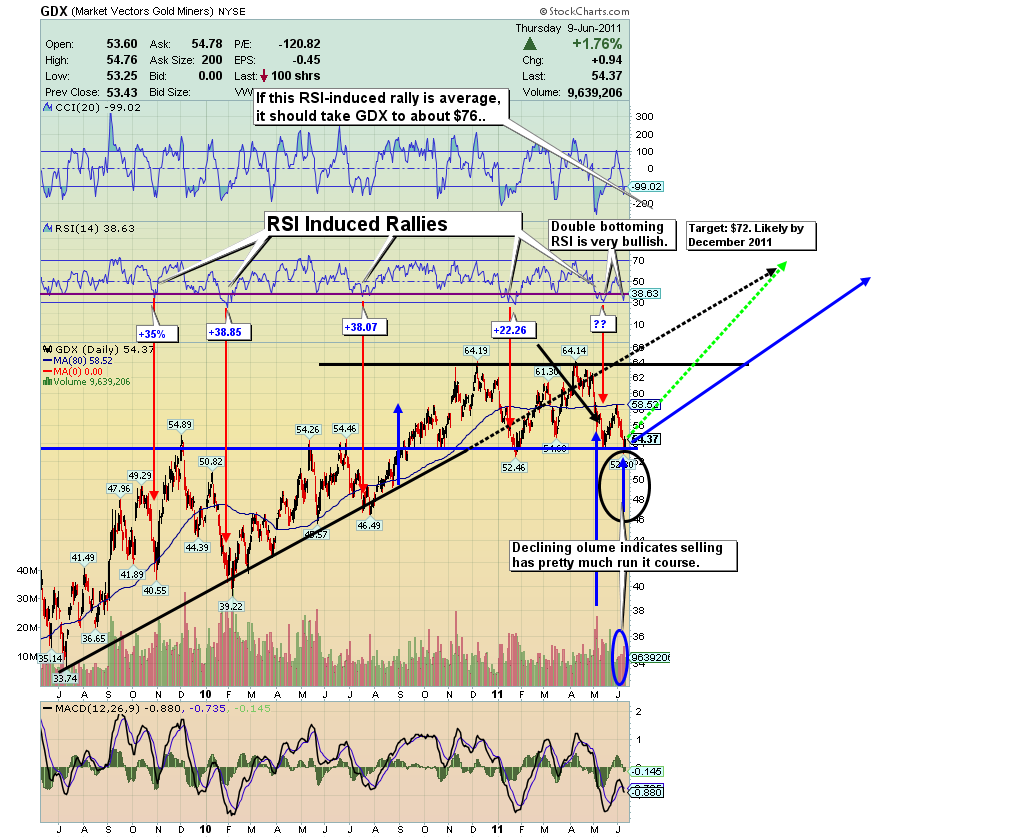
- This GDX chart is highlighting the deeply oversold RSI reading, and what that reading and set-up means to price. As you can see, the moves can be as large as 38%, from similarly oversold conditions. Is this set-up a guarantee of higher prices? No, but it is a strong indicator that we could move much higher in price.
- Also, please note that the double bottom for RSI that I projected last week has now occurred. Double bottoms are met with discouragement and disbelief. At this point in the market cycle people are always ready to throw in the towel, and are doing so. There is no question that this is the pain zone. Be patient and hang tough, as your pay day is coming!
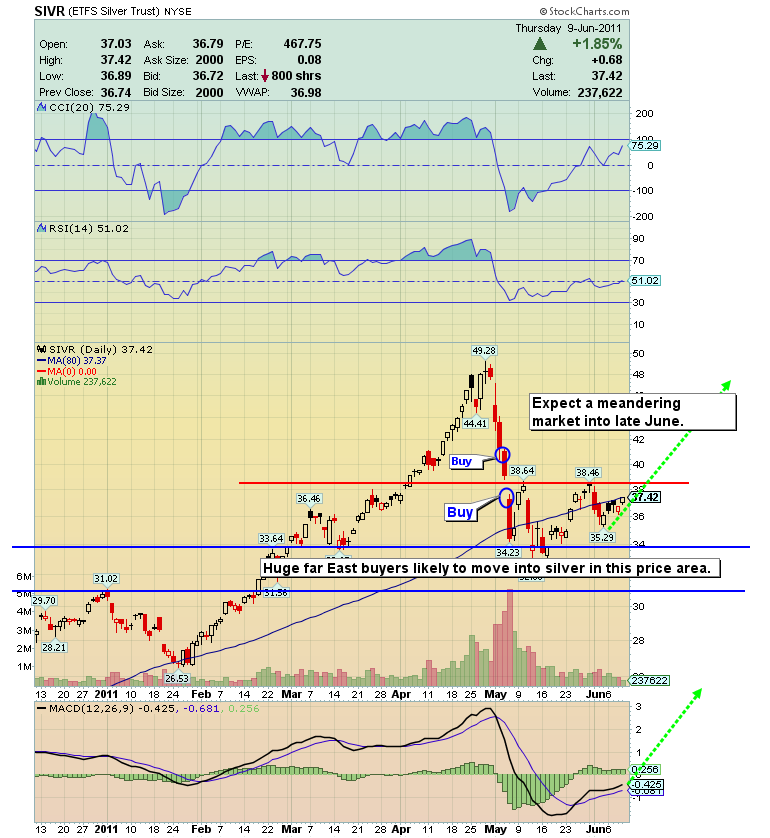
SIVR (Silver Bullion Proxy) 6 Month Chart
- I’d like you to remain in strong buy mode for silver, while understanding that June can be a weak month.
- The Far East likely has a heavy appetite for silver underneath the current market.
- I view silver like an option on gold. Options have great risk and great potential reward. Don’t replace gold with silver. Silver is far riskier and far more volatile, but I would suggest you want to own both gold and silver!
Friday, Jul 17, 2026 Super Force Signals Unique Introduction For 321Gold Readers:
Send me an email to admin@supergoldsignals.com and I’ll send you my free “Inflation Thunder Now!” gold and silver stocks video report. I’ll also include 3 of my next Super Force Surge Signals free of charge, as I send them to paid subscribers. Thank you!
|
Stay alert for our Super Gold alerts, sent by email to subscribers,
for both the daily charts on Super Force Signals at www.supergoldsignals.com and for the 60 minute
charts at www.supergoldsignals.com
About Super
Gold Signals:
Our Surge Gold Signals are created thru our proprietary blend
of the highest quality technical analysis and many years of successful
business building. We are two business owners with excellent synergy.
We understand risk and reward. Our subscribers are generally successfully
business owners, people like yourself with speculative funds,
looking for serious management of your risk and reward in the
market.
Frank Johnson:
Executive Editor, Macro Risk Manager.
Morris Hubbartt: Chief Market Analyst, Trading Risk Specialist.
website: www.supergoldsignals.com
email:
admin@supergoldsignals.com
email: admin@supergold60.com
Mail:
1276 Lakeview Drive
Oakville, Ontario, L6H 2M8
Canada
###
Jun 10, 2011
Morris Hubbartt
321gold
Ltd
|
