Super Force Signals - A Leading
Market Timing Service
We Take Every Trade Ourselves
Is the Gold Market Correction Nearly Over?
Morris Hubbartt
Weekly Market Update Excerpt
posted Jun 3, 2011
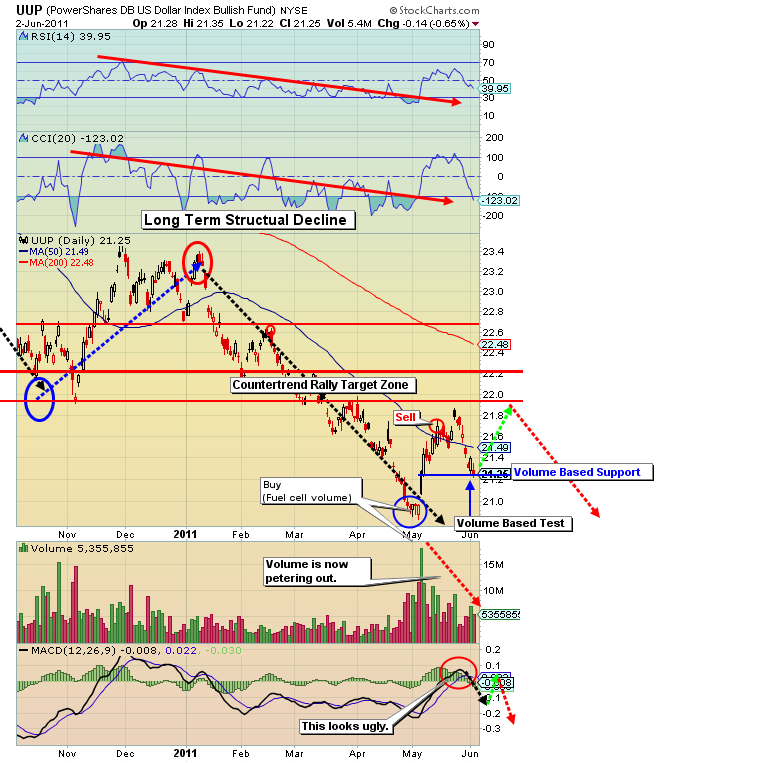
UUP (US Dollar Proxy) Chart
Dollar Commentary
- The debt crisis rolls on. Is this decline in the US economy just another down turn, with happy times just around the corner? I don’t think so. I believe some of the social safety nets that America has gotten addicted to will begin to shrink and even disappear in the next few years.
- In the shorter term, the dollar began a sizable sell-off last Friday, as I suggested it could. This decline had light volume, indicating that the short term dollar rally will continue for a few more weeks. That’s not a long period of time.
- Please note that in the bigger picture the up volume (green bars on the chart) has been fading since my initial Fuel Cell Indicator buy signal for the dollar. The fading volume in this bigger picture tells me the dollar rally is now in its final move upbefore the structural decline intensifies.
- The countertrend rally in the dollar, technically, is a natural process in a “slow bleed” decline in the dollar over the last year. Negative sentiment reached a breaking point in April, and that created this countertrend move. Stay focused on the big picture rather than this countertrend. The debt crisis in the next few years could greatly reduce the value of the dollar.
- There is part of the debt crisis that is totally unpredictable. There are large periods of time where markets are not predictable, and that is why those who get too involved with countertrend moves eventually take some sizable losses and pain.
- Look closely at my dollar chart and think about the risk to reward ratio of playing this countertrend rally. The reward is small and the risk is enormous. I strongly recommend accumulating metals, (not dollars!) during any further rally in the dollar. In its current form, the dollar is probably headed for the dustbin of history.
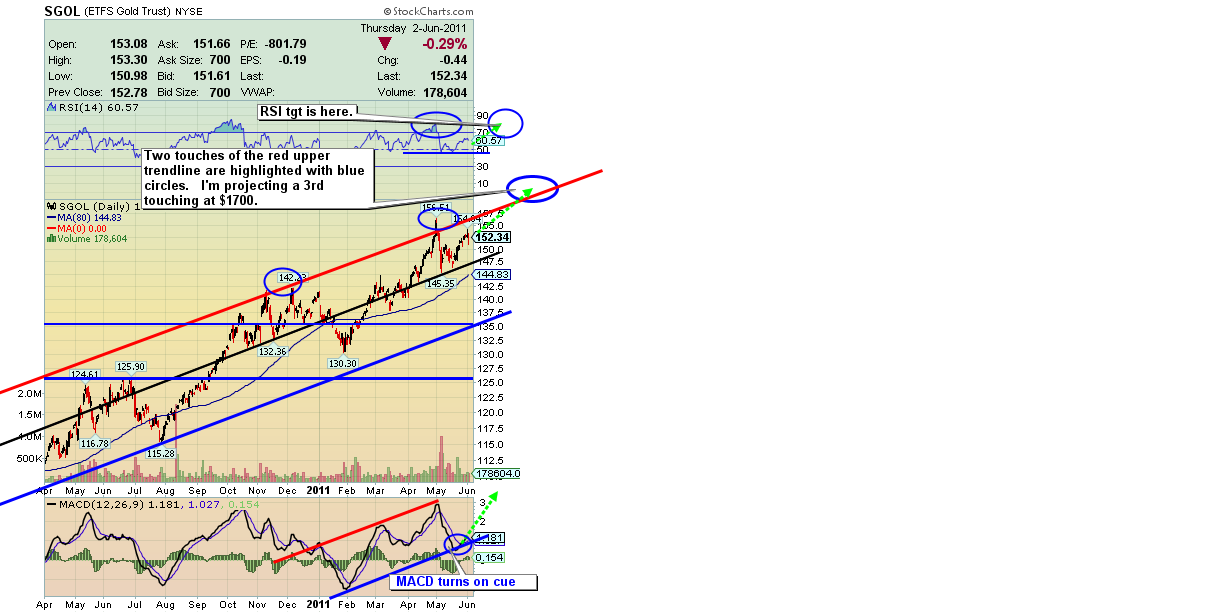
SGOL (Gold Bullion Proxy) Overshoot Chart
- The strength in gold remains very strong and $1700 remains my next firm target. Investment demand for gold in China is surging, and may have topped 90 metric tons during the first quarter.
- “Gold imports by China may increase after investment demand more than doubled in the first quarter, with the country overtaking India to become the largest market for gold coins and bars, the World Gold Council said. China produced 340 metric tons of gold last year and consumption was about 700 tons, leaving a gap of 350 tons to 360 tons, Albert Cheng, Far East managing director at the council, said yesterday. “With increasing demand in China we will have to rely on imports to fill the gap between demand and supply.” China is the world’s largest gold producer and second-largest in overall consumption.” – 2011, May 20. Bloomberg News.
- Regardless of what the actual current numbers are, the fact is that Asia is the dominant buyer of precious metals and their appetite is growing! Over the next 2 decades, Morgan Stanley predicts that another 300 million people in China will move to cities from rural homes. The demand for gold in China should see significant and consistent long term growth.
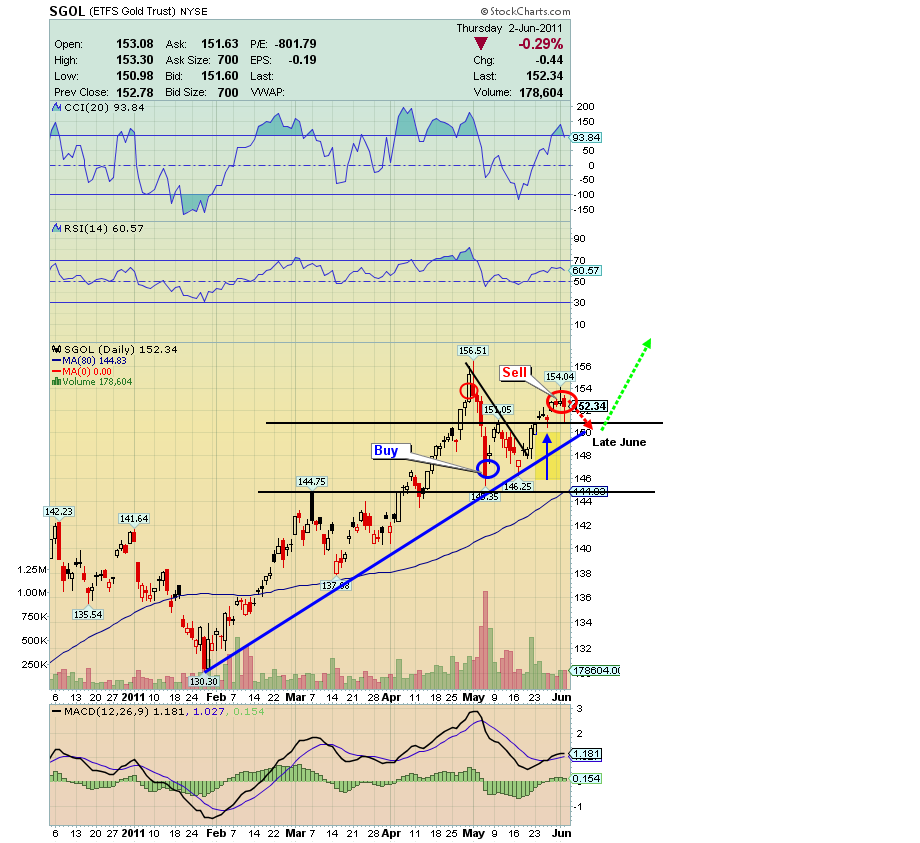
SGOL (Gold Bullion Proxy) 6 Month Chart
- Note that in the shorter term gold chart broke out from a sort of triangle of resistance, over a week ago. The support in gold is strong now, and the buying that lies ahead should see a fresh gold breakout to new highs. My time target for the next major breakout in gold is late June. Until then, I expect a meandering market.
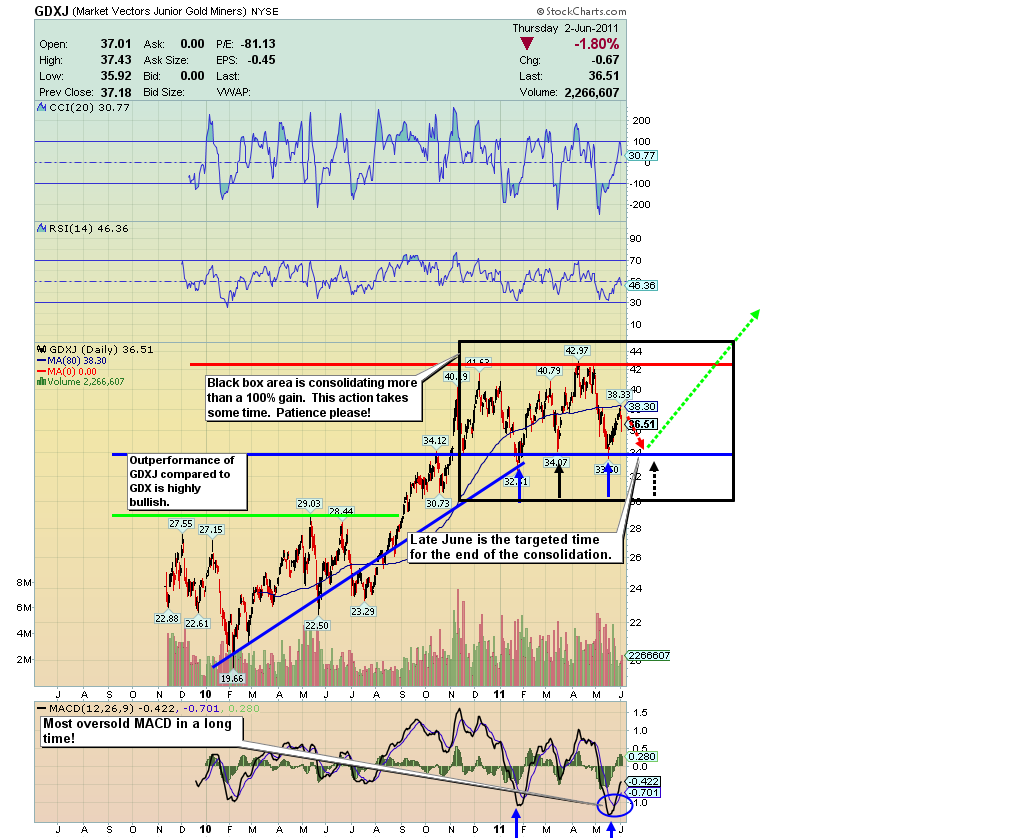
GDXJ (Gold Juniors ETF) Chart
- The best way to make money in the market is to wait for an asset to hit the floor, and then buy it. As price went into the washout low of May 17th, I placed one of my larger buys at $33.55 on GDXJ. I urge you to take the opportunity in junior gold stocks seriously. Further, I recommend 65% core positioning in all precious metals sectors. That means 65% of any buy you make is never sold for the life of the bull market. My latest sell signal came 10 days after the buy, and I took 6% of my personal position off the table. That’s moderate action.
- Take some trading profits after making timely entries in the market, while building a very large core position. The goal is to enlarge your position and lower your costs.
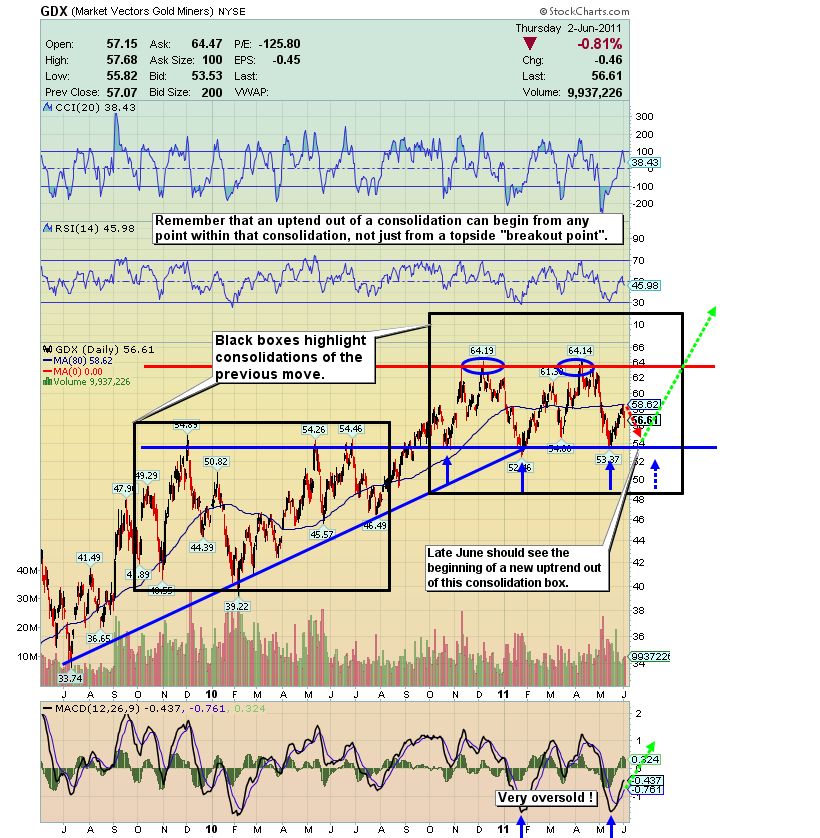
GDX 14 month Chart
- As price went into the washout low of May 17th for GDX, I placed my largest buy to date, at $54.05 on GDX. By last Friday price had advanced 7.30% and my charts generated a trading sell signal. Remember to maintain your core position at 65% or higher, regardless of any sell signals you take. Shave off profits on every sell signal, but don’t touch your core positions, please!
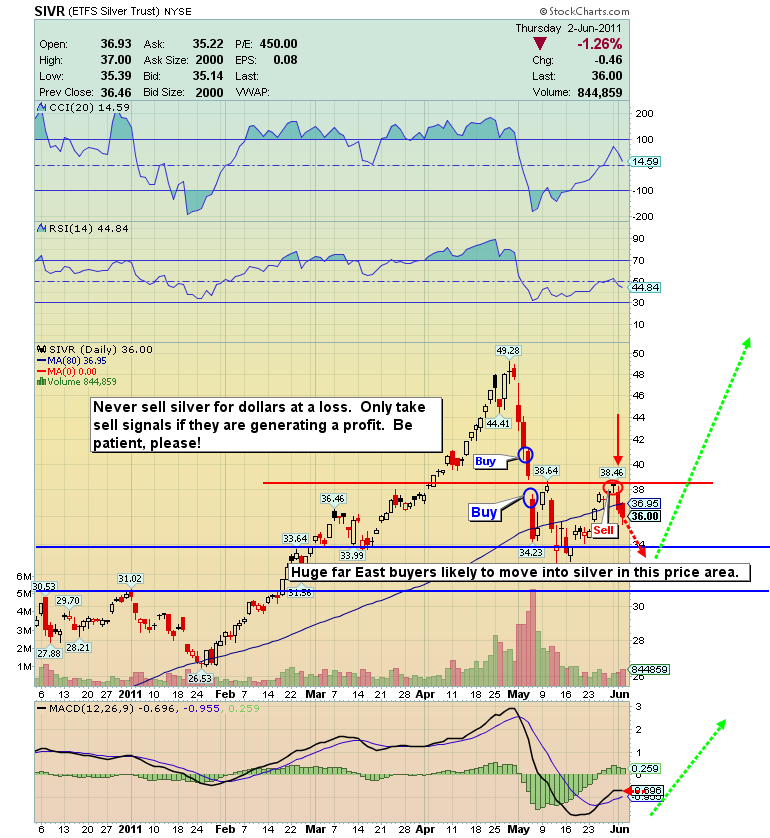
Silver via SIVR- 6 months
- I’d like you to remain in a strong buy mode for Silver. Are the same Far East buyers that helped create a rising floor under the gold price now preparing to do the same thing in silver? I don’t know but my advice is to continue to buy this metal on minor weakness from here down. Your main objective should be to get more physical silver purchased as the trading buy signals are given. Silver is extremely volatile, so it is even more important to buy physical silver than it is to buy physical gold. Physical silver holders are less likely to panic during a big price drawdown, while paper silver holders are very easily frightened!
Friday, Jun 26, 2026 Super Force Signals Unique Introduction For 321Gold Readers:
Send me an email to admin@supergoldsignals.com and I’ll send you my free “Inflation Thunder Now!” gold and silver stocks video report. I’ll also include 3 of my next Super Force Surge Signals free of charge, as I send them to paid subscribers. Thank you!
|
Stay alert for our Super Gold alerts, sent by email to subscribers,
for both the daily charts on Super Force Signals at www.supergoldsignals.com and for the 60 minute
charts at www.supergoldsignals.com
About Super
Gold Signals:
Our Surge Gold Signals are created thru our proprietary blend
of the highest quality technical analysis and many years of successful
business building. We are two business owners with excellent synergy.
We understand risk and reward. Our subscribers are generally successfully
business owners, people like yourself with speculative funds,
looking for serious management of your risk and reward in the
market.
Frank Johnson:
Executive Editor, Macro Risk Manager.
Morris Hubbartt: Chief Market Analyst, Trading Risk Specialist.
website: www.supergoldsignals.com
email:
admin@supergoldsignals.com
email: admin@supergold60.com
Mail:
1276 Lakeview Drive
Oakville, Ontario, L6H 2M8
Canada
###
Jun 3, 2011
Morris Hubbartt
321gold
Ltd
|
