Super Force Signals - A Leading
Market Timing Service
We Take Every Trade Ourselves
Gold Bull Rides Again
Morris Hubbartt
Weekly Market Update Excerpt
posted Jun 1, 2012
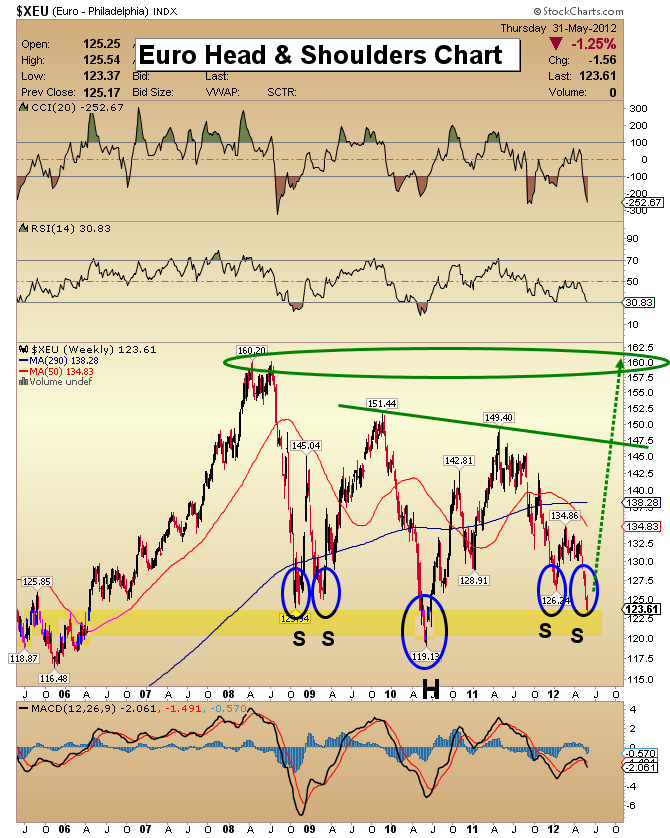
Euro Head & Shoulders Chart
- For many months, the financial focus of most professional investors has been the problems in Europe. The majority of commentary I read is assuming that the euro is going much lower. Some think the euro will actually disintegrate, but power in Europe is becoming more centralized. Europe’s bankers and politicians will likely do what they can to ensure the euro is a viable currency, at least temporarily.
- Like any asset, the euro is analyzed using fundamentals, technical indicators, and trader sentiment. The fundamentals of the euro zone have real challenges. Traders have understood the challenges and sold the euro down to current price levels. I believe the euro’s weak fundamentals are fully priced into it now.
- Sentiment analysis comes into play when the whole trading community is on the same side of a trade. Sentiment on the euro is overwhelmingly negative. It could reverse and surge higher.
- At that point all the selling pressure on stocks and commodities could evaporate in a flash.
- Technical analysis is also important. There is a head and shoulders formation on the euro. It predicts much higher prices are coming.
- My interest in the performance of the euro against the dollar pertains to the implications for the price of gold and silver. A higher euro could produce immensely higher gold and silver prices, thereby adding fuel to an already-improved gold stock sector.
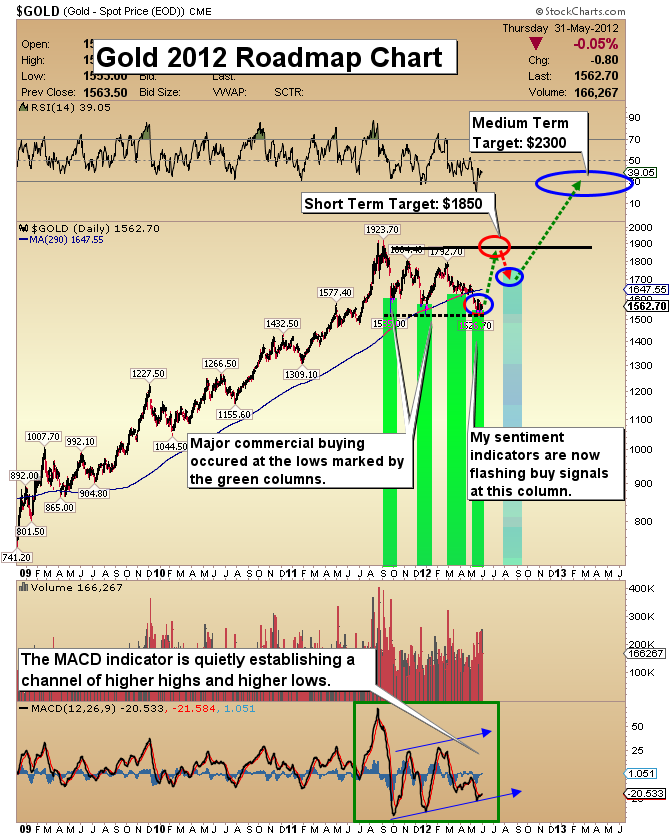
Gold Road Map Chart
- Almost all the fundamentals, technical indicators, and trader sentiment suggest that the gold market appears to be getting ready for a “mighty move” higher.
- Gold could ultimately be the tool used to reset debt-laden currencies, and that means a substantially higher gold price in the future. The fundamental case for gold is stronger today than it was at the beginning of the crisis in 2008, because debts are higher and the economy is weaker.
- Technically, the gold market is sitting on solid support, although the head and shoulders formation did fail. That means that we may be in the current trading zone slightly longer than originally anticipated.
- Sentiment analysis is also very bullish. Highlighted on this chart are key areas of commercial trader buying, based on the COT reports. These reports are perhaps the “ultimate investor survey”, because rather than just investor opinion, the COT reports define the movement of real capital.
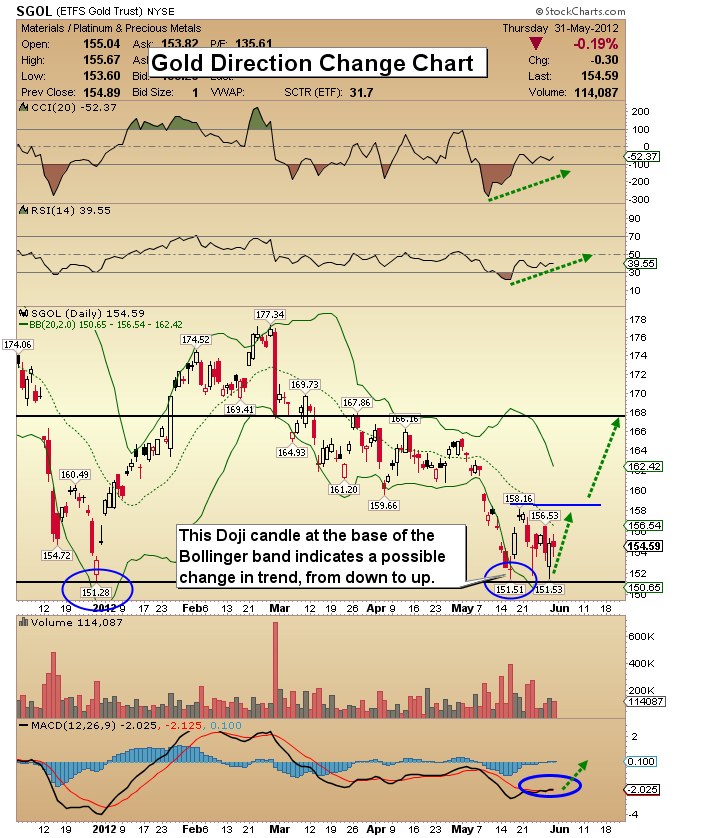
SGOL (Gold Proxy) Direction Change Chart
- The candle formation at the recent low is impressive. It’s a Doji candle outside the Bollinger band. This type of technical action typically indicates a change in direction is underway.
- The technical indicators are rising steadily. A two-day close over $158.16 on this gold proxy chart is needed to confirm the action of the indicators and the Doji candle.
- In the bigger picture, one thing that I need to see in the gold market is a change in volume patterns. Over the past few weeks, GDX, which represents large gold miners, just displayed 4 “fuel cell volume” days. That is the type of volume I would like to see in gold itself.
- Another positive for gold is the way that gold stocks have been trading. The seniors and juniors both made capitulation bottoms and have since rallied nicely even though gold has drifted. Gold stock outperformance is historically meaningful when a major bottom in bullion is being established.
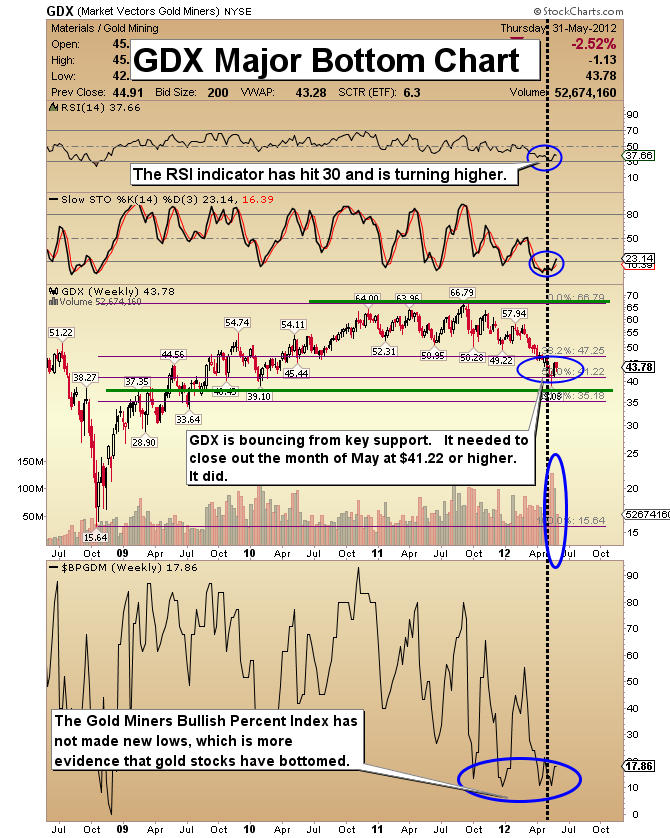
GDX Major Bottom Chart
- I see GDX making a major bottom here. This process is more painful than making a trading bottom, because the market can cleanse itself of many strong participants. The best thing to do now is to hold positions, or buy if you can.
- The gold stock sector continues to act much better after displaying a capitulation low two weeks ago. As gold continues to languish, gold stocks appear to be looking for any reason to continue to rally. This price action is a very positive sign after a capitulation low occurs.
- Note the extremely low levels that the technical indicators have fallen to, and the turn higher from those lows.
- The bounce from the 50% Fibonacci retracement line near $41.22 is very encouraging.
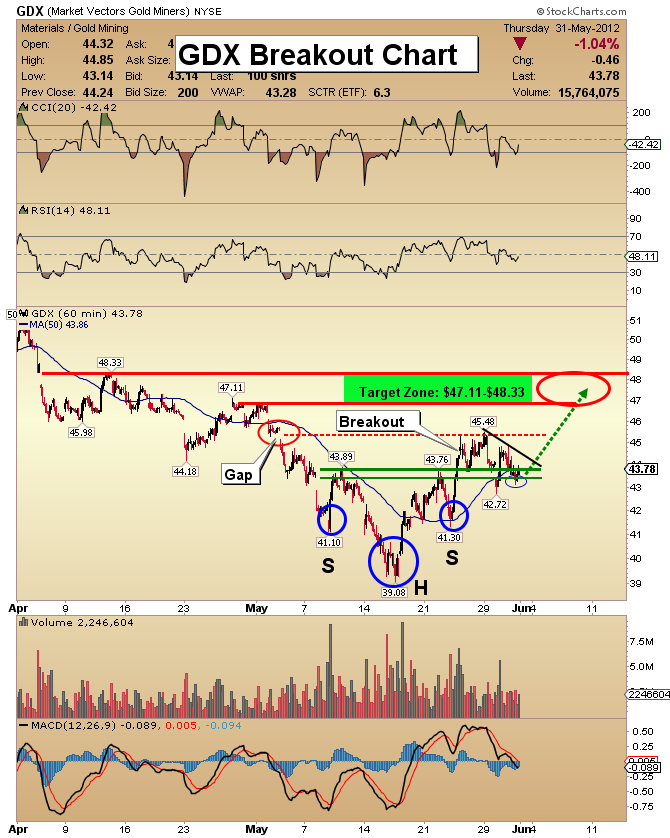
GDX Breakout Chart
- For the strong rally in gold stocks to continue, a close above the neckline (at about $44) is required. Gold Stocks are displaying tremendous resilience. There have been a number of days lately where the price has been weak in the morning and very strong in the afternoon. This is textbook price action in a bull market.
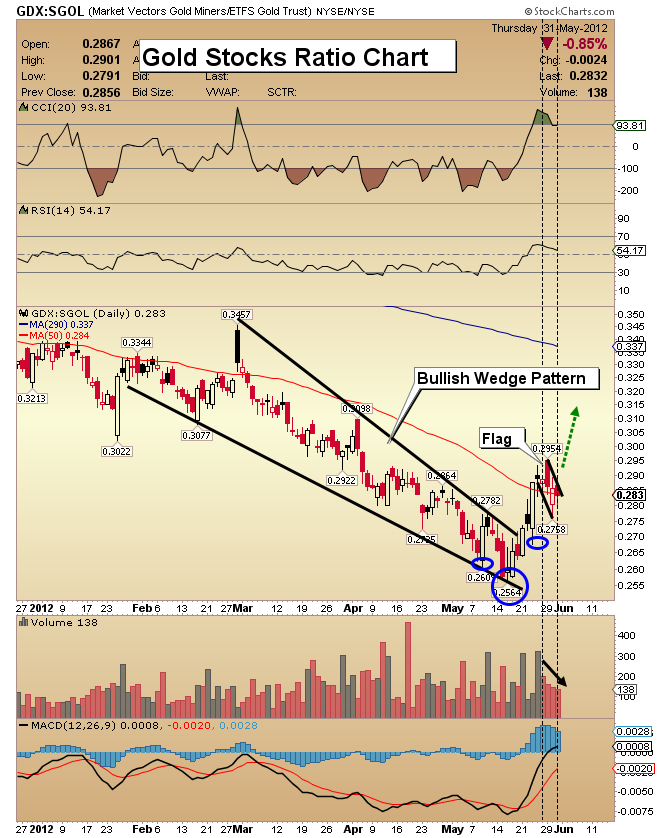
Gold Stocks Ratio Chart
- On this chart the power of the gold stocks breakout against gold is startling. There is a potential flag pattern that is shaping up quite nicely. Volume is dropping in textbook fashion, which is very bullish.
- The flag follows a breakout from a bullish wedge pattern. The tide may have finally turned for gold stock investors!
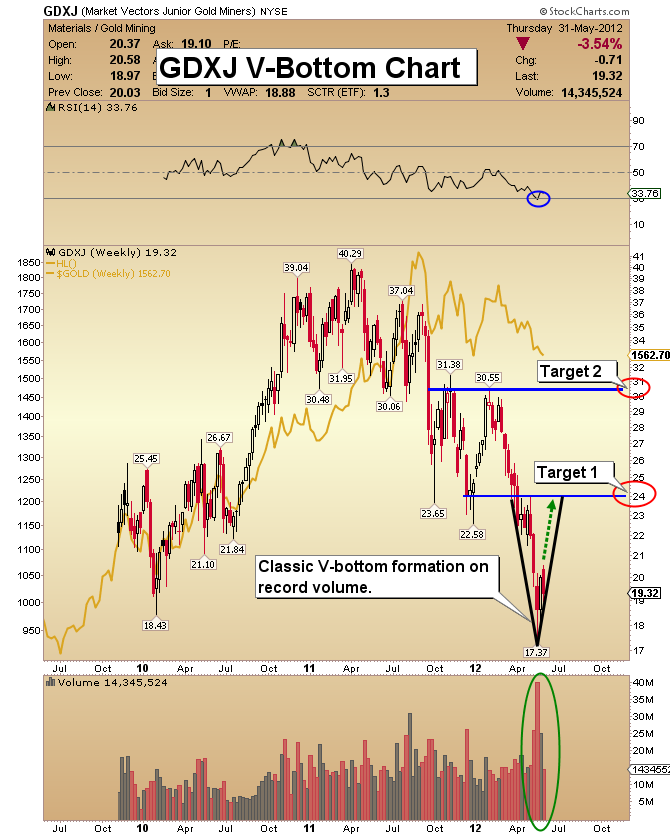
GDXJ V-Bottom Chart
- I see an initial move up to $24, followed by a consolidation. Then I’m forecasting an additional move, up to the $30-$31 area. Further strength above $31 could be accompanied by new highs in gold bullion later this year.
- Note the enormous volume bar that occurred at the “capitulation low”. On days where price is quiet or pulling back it’s easy to forget about major bull signals like this volume bar. Try to ignore the daily noise and focus on the more important technical actions that occur.
- The current position of the RSI indicator indicates GDXJ is the most oversold in its history. All value-oriented investors should be holding and accumulating their favorite junior gold stocks right now. The gold bull has thrown a lot of riders off over the past year. All my analysis indicates that she’s getting more healthy each day, and almost ready for her next ride. Climb on!
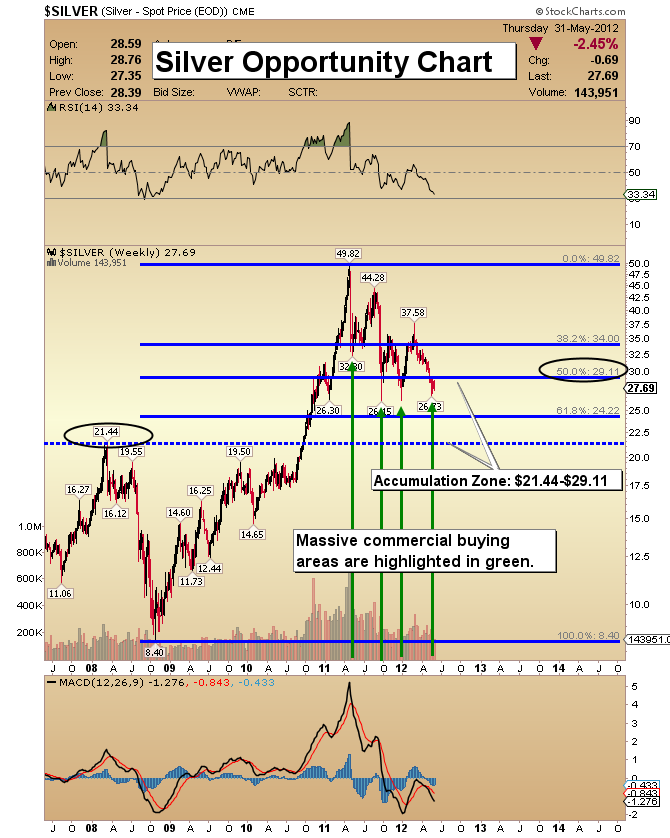
Silver Chart
- Silver offers an excellent opportunity for the investor to achieve capital gains. Commercial traders are carrying more long positions now than they were in 2008, when silver was under $10.
- At almost $28 now, silver is trading at more than double that price. Commercial traders clearly see excellent value here. The best way to play silver is to buy the physical metal and wait patiently. It will likely follow gold at first, and then outperform it!
Friday, Jul 3, 2026 Super Force Signals Unique Introduction For 321Gold Readers:
Send me an email to admin@supergoldsignals.com and I’ll send you my free “Inflation Thunder Now!” gold and silver stocks video report. I’ll also include 3 of my next Super Force Surge Signals free of charge, as I send them to paid subscribers. Thank you!
|
Stay alert for our Super Gold alerts, sent by email to subscribers,
for both the daily charts on Super Force Signals at www.supergoldsignals.com and for the 60 minute
charts at www.supergoldsignals.com
About Super
Gold Signals:
Our Surge Gold Signals are created thru our proprietary blend
of the highest quality technical analysis and many years of successful
business building. We are two business owners with excellent synergy.
We understand risk and reward. Our subscribers are generally successfully
business owners, people like yourself with speculative funds,
looking for serious management of your risk and reward in the
market.
Frank Johnson:
Executive Editor, Macro Risk Manager.
Morris Hubbartt: Chief Market Analyst, Trading Risk Specialist.
website: www.supergoldsignals.com
email:
admin@supergoldsignals.com
email: admin@supergold60.com
Mail:
1276 Lakeview Drive
Oakville, Ontario, L6H 2M8
Canada
###
Jun 1, 2012
Morris Hubbartt
321gold
Ltd

|
