Super Force Signals - A Leading
Market Timing Service
We Take Every Trade Ourselves
USD Structural Decline and Gold
Morris Hubbartt
Weekly Market Update Excerpt
posted May 27, 2011
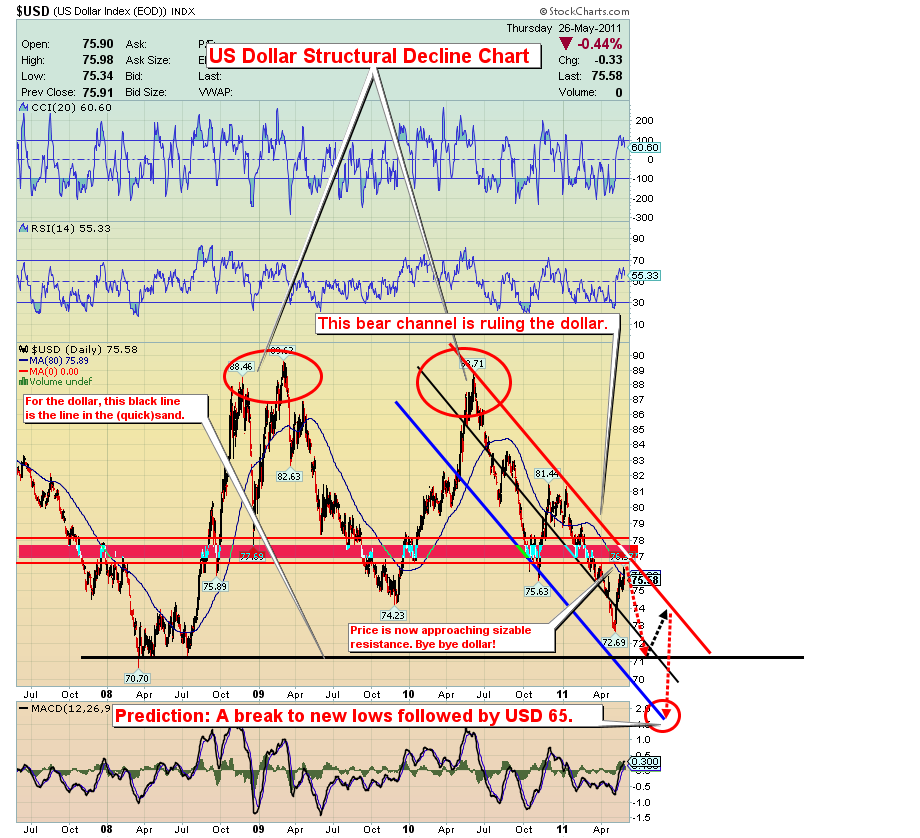
US Dollar Structural Decline Chart
US Dollar Five Point Checklist
- The current price action of the dollar is an oversold bounce due to a multi-month decline that was accompanied by overwhelming negative sentiment. Note that on the USD chart above, the countertrend is moving into heavy resistance.
- We are seeing signs of inflation entering the economy, probably as a result of the debasement of the currency, via the QE programs. The inflation we have seen so far is likely pale in comparison to what you could experience over the next two or three years, and the Fed’s stated policy is to create inflation.
- The Fed is officially ending QE2, but I expect QE3 in one form or another to be rolled out, and debasement of the US dollar to continue. The next round of QE could trigger selling of more and more dollars worldwide. Technically, the dollar appears to be near a breaking point. My charts indicate the time for the dollar to begin a major new decline is this fall.
- Are there enough buyers for the US Government bonds being issued? If not, the next phase of this dollar decline could get very ugly for the dollar. The chart is saying something very big is fundamentally wrong with the dollar. If so, gold, silver, and all commodities are going dramatically higher.
- With an election coming, will the Fed sit by and do nothing if the economy starts to clearly roll over? They could be seen as causing the President of the United States to lose the election. The Federal Reserve will likely keep on printing money, in an effort to boost the US economy.
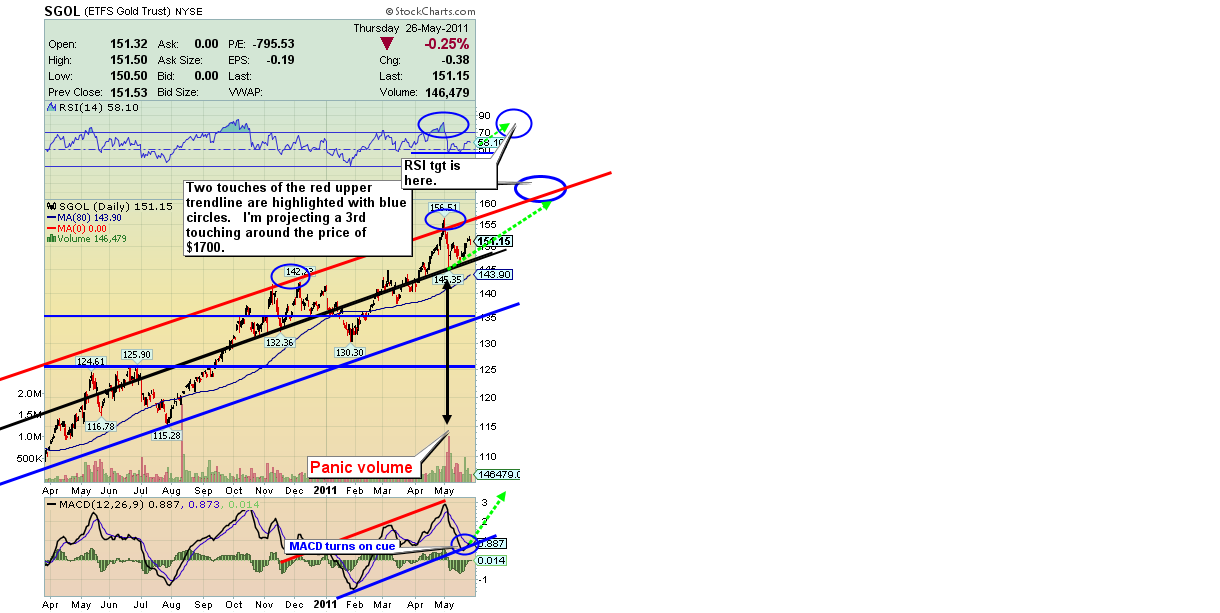
SGOL (gold bullion proxy) Overshoot Chart
- The fundamentals of the structural decline in the dollar and the undervaluation of gold are working to cause gold to move higher. My current intermediate term target is $1700, and I see a worldwide buying panic coming to gold.
- Technically, the overshoot action at the upper trend channel on the move to $1570 is now dominating the gold trade. In a normal market, declining MACD appears to pull price lower. That’s not happening this time, and MACD itself is trading in a bullish channel.
- Strong fundamentals and stellar price action in gold have also caused the RSI indicator that fell to the mid 50’s area, to turn right back up.
- My time line work for the end of the grinding and base-building action we’re undertaking now should be complete by the third or fourth week in June. From that point I expect powerful bullish action in all precious metals sectors.
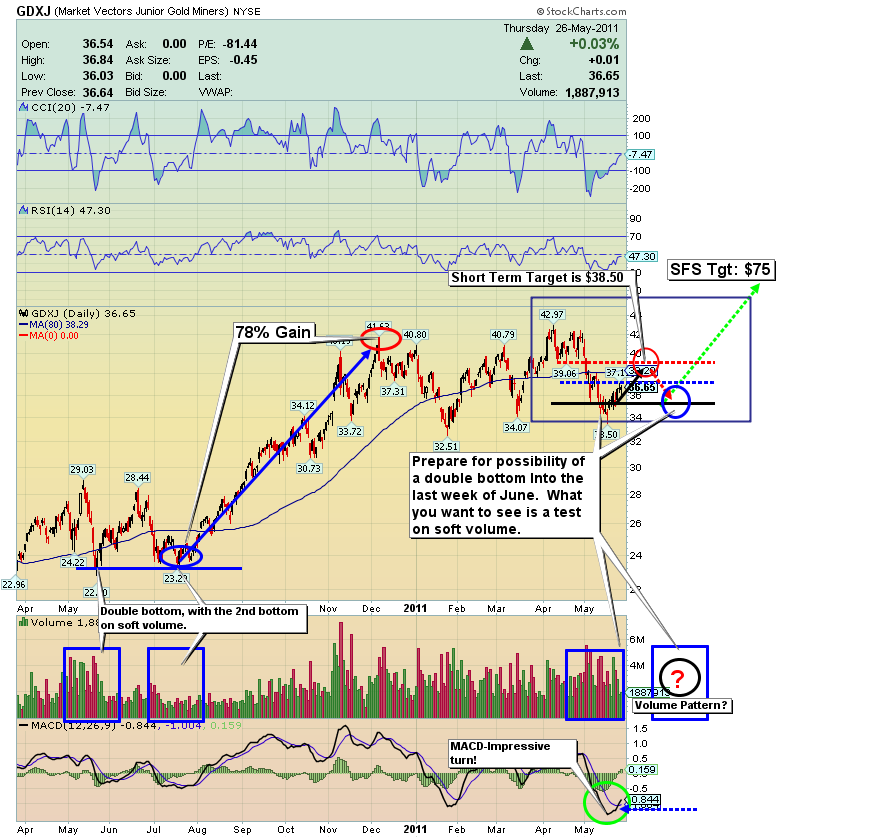
GDXJ (Gold Juniors ETF) Chart
- I have a firm buy signal in play for GDXJ. The move ahead may be hard to envision now, but this market is technically setting up now, to move seriously higher. Make careful note of my short term price and time targets on the chart. I expect the current move to hit resistance around $38.50, and then a light move lower into late June. This technical price action should be the springboard that sends junior gold stocks to all-time highs.
- The bottoming process, many times, will look to be close to completion, and then a flush of selling moves in and brings a washout. A washout is literally a process that washes out the majority of traders. My entire SFS program is ruled by buying weakness and selling strength. There is nothing more discouraging than to get taken out of a trade in weakness, only to watch price turn higher after you’ve unloaded your position.
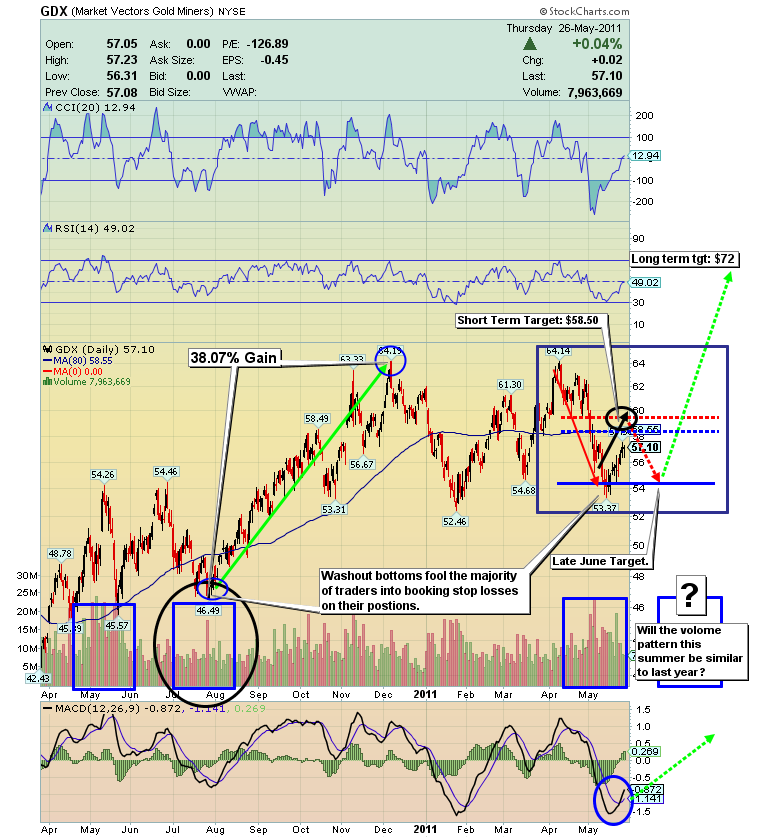
GDX Chart
- I have a strong buy signal in play for GDX from $54.05. Just a bit of further strength will likely offer a profit taking signal for traders, but I recommend a huge (65%!) core position in gold stocks. Shave profits modestly. You want to be very heavily invested in preparation for what I believe is an enormous move to the upside.
- Short term, I expect the current move for GDX to hit resistance in the $58.50 range in the next few days, followed by a move lower into late June. Like with juniors, this action will likely be the final shakeout and springboard that sends intermediate and senior gold stocks to all-time highs.
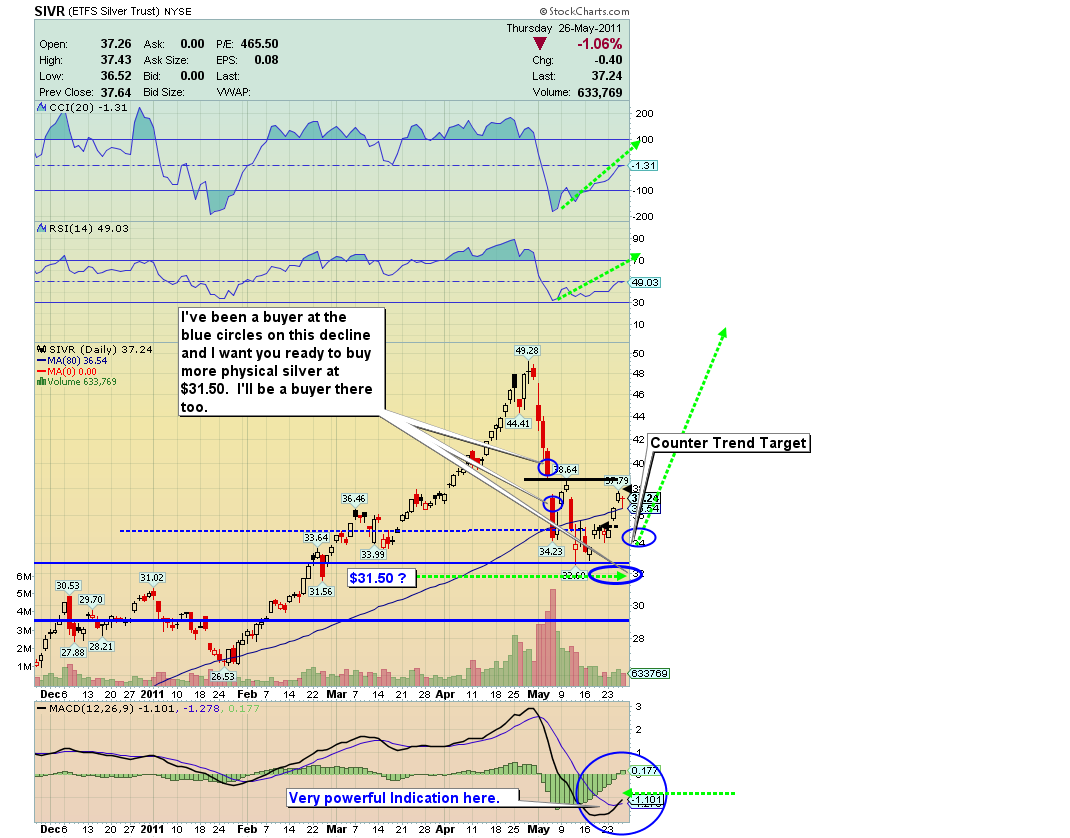
SIVR (silver bullion proxy) Chart
- I have a series of strong buy signals in play for silver. The most recent COT report shows the commercials (big money traders) are extremely bullish. The last time this group of investors was this bullish was at the bottom of the crash at price under $9 for cash market silver in 2008, and price is now trading above $37 as I write.
- It’s much harder for silver to make big gains from $37 than it is from $9, but with huge buying power being applied by the commercials, a solid move higher is very realistic. I’ve issued buy signals into this price weakness. I’ll buy even bigger if silver drops towards the $31.50 area, and I hope you will too!
Friday, Jul 3, 2026 Super Force Signals Unique Introduction For 321Gold Readers:
Send me an email to admin@supergoldsignals.com and I’ll send you my free “Inflation Thunder Now!” gold and silver stocks video report. I’ll also include 3 of my next Super Force Surge Signals free of charge, as I send them to paid subscribers. Thank you!
|
Stay alert for our Super Gold alerts, sent by email to subscribers,
for both the daily charts on Super Force Signals at www.supergoldsignals.com and for the 60 minute
charts at www.supergoldsignals.com
About Super
Gold Signals:
Our Surge Gold Signals are created thru our proprietary blend
of the highest quality technical analysis and many years of successful
business building. We are two business owners with excellent synergy.
We understand risk and reward. Our subscribers are generally successfully
business owners, people like yourself with speculative funds,
looking for serious management of your risk and reward in the
market.
Frank Johnson:
Executive Editor, Macro Risk Manager.
Morris Hubbartt: Chief Market Analyst, Trading Risk Specialist.
website: www.supergoldsignals.com
email:
admin@supergoldsignals.com
email: admin@supergold60.com
Mail:
1276 Lakeview Drive
Oakville, Ontario, L6H 2M8
Canada
###
May 27, 2011
Morris Hubbartt
321gold
Ltd
|
