Super Force Signals - A Leading
Market Timing Service
We Take Every Trade Ourselves
Gold Stocks Bottom On Volume
Morris Hubbartt
Weekly Market Update Excerpt
posted May 25, 2012
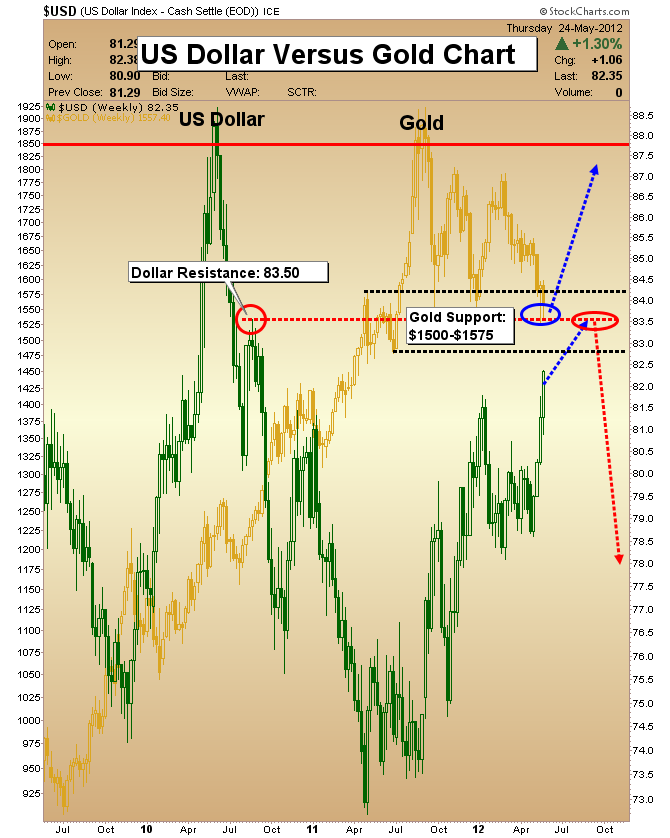
US Dollar Resistance Chart
- Most major markets are near important price points. I am a dollar bear, mainly because debt in the USA is probably un-payable without immense dilution of our nation’s currency. The nation also faces unfunded liabilities totaling tens of trillions of dollars.
- The term “unfunded liabilities” could be a misnomer. Many Americans have paid their taxes for the benefit of social security, while too many others pay nothing and draw a welfare check. This situation is creating a nightmare for the next generation of retirees in America.
- The dollar has strengthened lately, but not because the domestic economy has improved. The strength has come from bank runs in the nations of Greece, Spain, and Portugal. The problem for savers who are converting their savings from euros to dollars is that they may be jumping out of the frying pan, directly into the fire.
- I’m looking for the dollar to top out near the resistance I’ve highlighted on the chart around 83.50. From there, I am projecting an initial decline to about 78. There is support for gold in the $1500-$1575 area, which is where the price is now.
- Please click this COT chart link. That chart, courtesy of www.sentimentrader.com, shows you that the “smart money” commercial traders are more net long the euro now than at any time in history. It is likely that the commercial traders believe a positive resolution to the euro crisis is nearer than most investors think it is.
- As a general rule, when the dollar is rallying, as it is now against the euro, gold will soften. That softening is an opportunity to purchase gold.
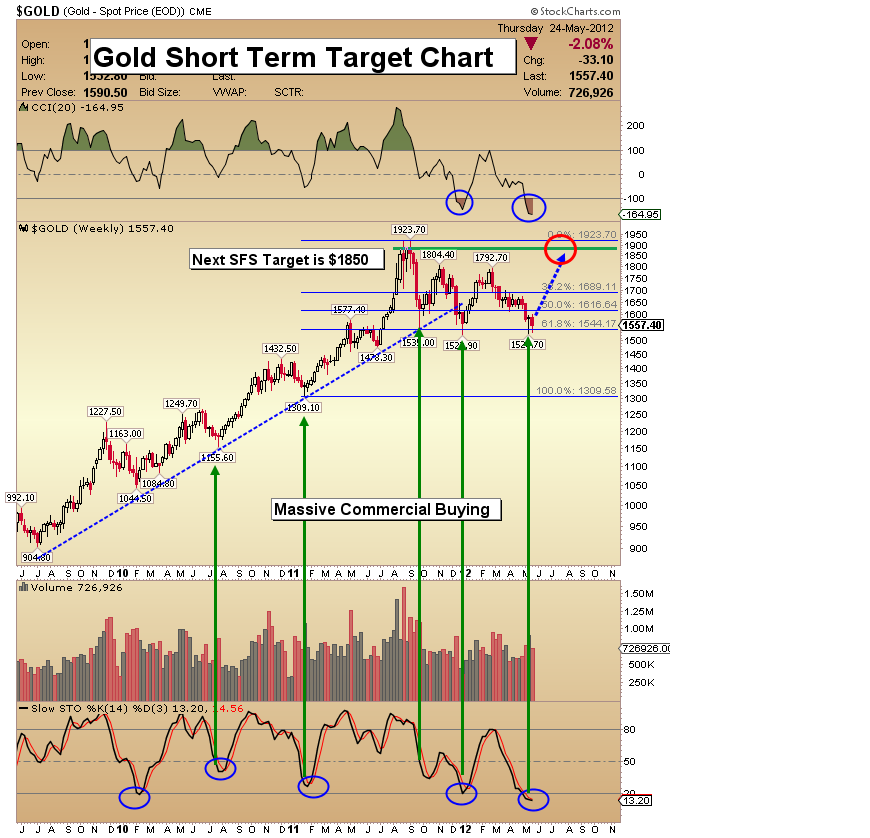
Gold Short Term Target Chart
- Many bulls have thrown in the towel on gold. They have been shaken due to the long and frustrating sideways gold correction.
- Mark Hulbert’s surveys show newsletter writers have begun recommending short positions in gold. Historically, when this group makes a “short gold” call, the correction is nearly over. In a major fiat currency bear market, shorting gold can be very dangerous, because the primary trend can re-assert itself in an explosive fashion.
- The consistent buying being made by commercial traders during price declines indicates that much higher prices are very likely.
- Note the positioning of the CCI and “slow stokes” (Stochastics) indicators. Technical indicators are not perfect, but both these indicators suggest substantial opportunity is at hand right now in the gold market.
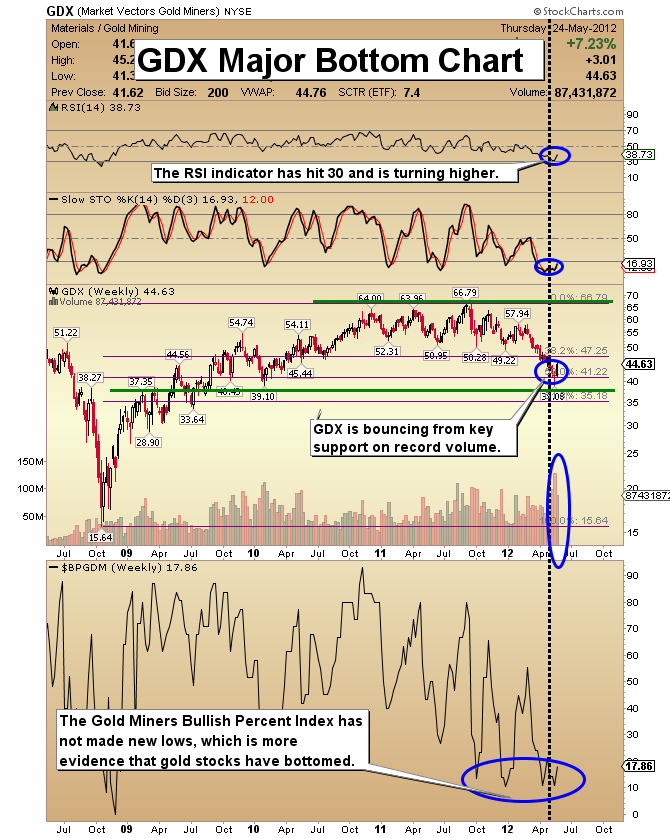
GDX Major Bottom Chart
- GDX has rallied nicely after hitting a low of about $39. Investors displayed panic and capitulation as that low was made. Weekly volume was enormous. It swamped many previous weekly volume numbers by about 50%.
- The market plunged lower, and then price turned higher. That price action created a classic candlestick hammer, as GDX closed well above the weekly low. GDX has also reclaimed the important 50% Fibonacci retracement level of about $41.22.
- GDX set a record of four fuel cell volume indicators in six trading days on the daily chart. This bottoming process in gold stocks looks solid. Capitulation bottoms are very volatile and can include a retest of the lows.
- On the bottom section of the above chart is the BPI, which is the Gold Miners’ Bullish Percent Index. This indicator is showing an oversold market. In 2008, the indicator kept plunging alongside the GDX price. This time it has stayed flat since October.
- Note the phenomenal positioning of the RSI and “slow stokes” indicators. The oversold condition of these indicators is accompanied by massive volume. Hang tough with your gold stocks, because there is probably a major payoff coming.
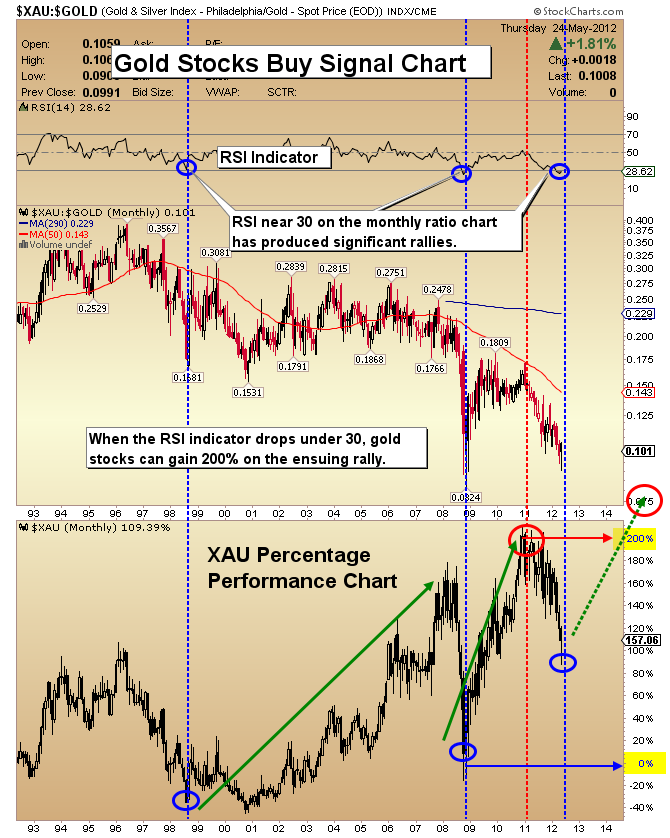
Gold Stocks Buy Signal Chart
- There have only been three times in the history of this chart when the RSI indicator has reached the oversold level that is at now.
- Note that the chart goes back to 1993. Gold stocks appear to be trading at an extreme level of under-valuation.
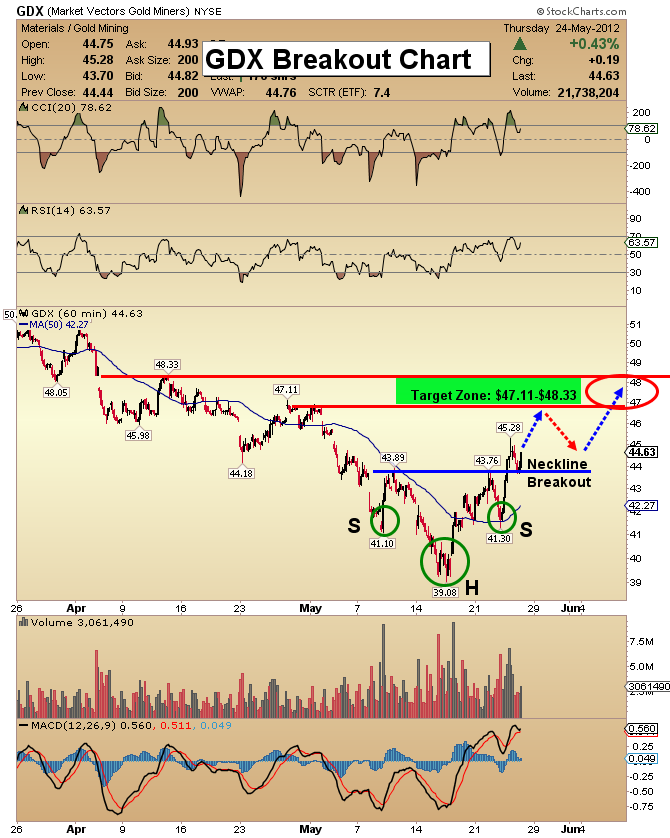
GDX Breakout Chart
- The price action over the past week is extremely positive. Note the head and shoulder pattern on this chart. A “textbook” breakout has occurred, even while bullion has struggled a bit.
- I’ve set a target of the $47.11-$48.33 price zone. That price area should bring in some momentum-based hedge funds, which could push the price even higher.
- Gold stock investors may be about to receive a well-deserved rally.
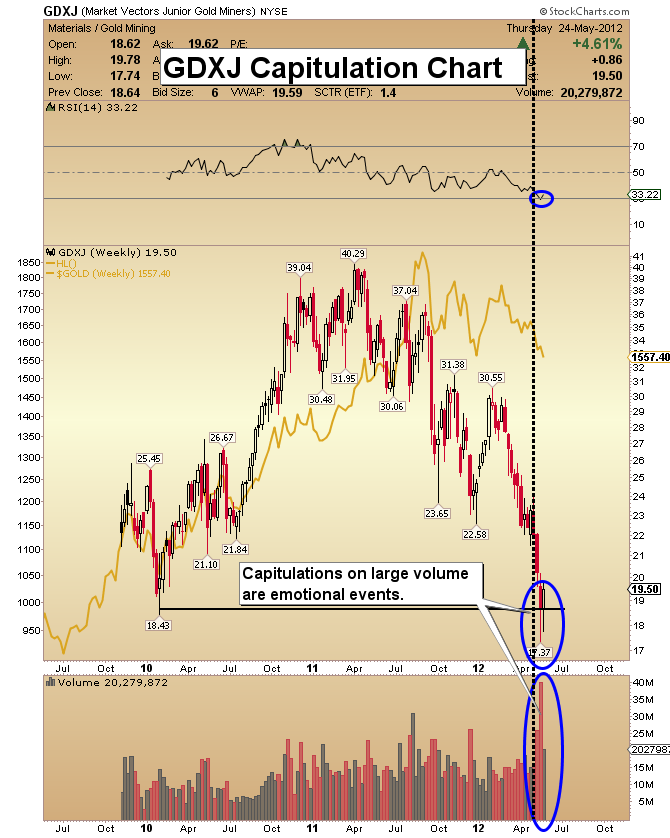
GDXJ Capitulation Chart
- Capitulations are always irrational and emotional events. Only exhaustion of the seller can put an end to the price decline, and I think that just happened. Once the asset in play turns around, an explosive rally to the upside can begin.
- For the past few trading sessions GDXJ has outperformed gold bullion, both on the upside and on the downside, which is very bullish for junior gold stocks.
- Note the size of the volume bar that occurred at the low. It’s a record-size bar!
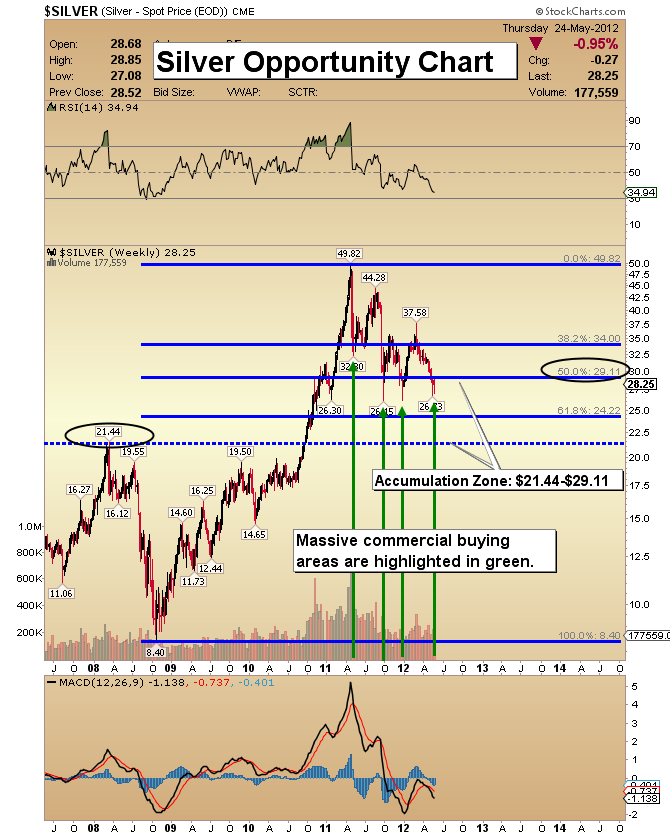
Silver Opportunity Chart
- The current correction offers enormous opportunity in silver. The excessive bullishness of commercial traders reported in the most recent COT report is as bullish as I’ve ever seen. The buying being made by this group of savvy investors is very positive.
- I view the price zone created by the high at $21.44 and the Fibonacci line at about $29.11 as one of exceptional value for silver investors. As always, focus on purchasing physical metal!
Friday, Jul 3, 2026 Super Force Signals Unique Introduction For 321Gold Readers:
Send me an email to admin@supergoldsignals.com and I’ll send you my free “Inflation Thunder Now!” gold and silver stocks video report. I’ll also include 3 of my next Super Force Surge Signals free of charge, as I send them to paid subscribers. Thank you!
|
Stay alert for our Super Gold alerts, sent by email to subscribers,
for both the daily charts on Super Force Signals at www.supergoldsignals.com and for the 60 minute
charts at www.supergoldsignals.com
About Super
Gold Signals:
Our Surge Gold Signals are created thru our proprietary blend
of the highest quality technical analysis and many years of successful
business building. We are two business owners with excellent synergy.
We understand risk and reward. Our subscribers are generally successfully
business owners, people like yourself with speculative funds,
looking for serious management of your risk and reward in the
market.
Frank Johnson:
Executive Editor, Macro Risk Manager.
Morris Hubbartt: Chief Market Analyst, Trading Risk Specialist.
website: www.supergoldsignals.com
email:
admin@supergoldsignals.com
email: admin@supergold60.com
Mail:
1276 Lakeview Drive
Oakville, Ontario, L6H 2M8
Canada
###
May 25, 2012
Morris Hubbartt
321gold
Ltd

|
