Super Force Signals - A Leading
Market Timing Service
We Take Every Trade Ourselves
Powerful Gold Market Setups In Play Now
Morris Hubbartt
Weekly Market Update Excerpt
posted May 20, 2011
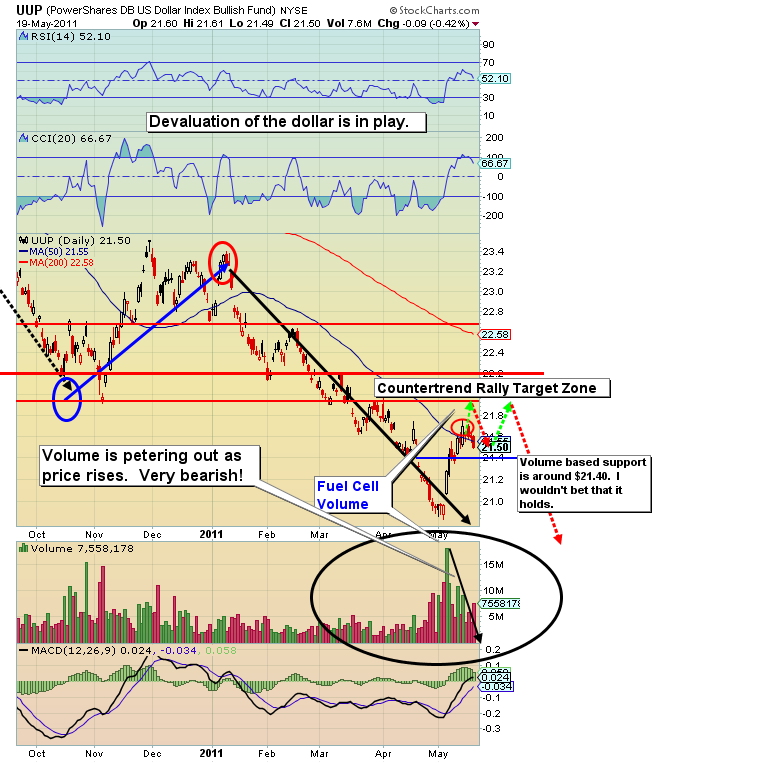
UUP (US Dollar Proxy) Chart
Dollar Commentary
- Overwhelming negative sentiment has nearly played out, and the US dollar has moved into a countertrend rally. I warned that my own buy signal for the dollar should be ignored, due to the hugely bearish main dollar trend. Stay focused on using any further rally in the dollar to buy more gold, silver, and metals stocks.
- This week you can see on the chart that dollar buying power is already showing signs of petering out. I now look for a meandering market in the dollar, followed by another slight move higher into the mid June timetable.
- Rather than looking for ways to save dollars, perhaps you should be looking for ways to save yourself from the dollar itself. The old saying, “Don’t fight the Fed” is a big key to understanding the movement of the dollar. In the big picture, the Fed wants a lower dollar, and they are getting it.
- This is a countermove in the dollar that will likely halt at the $22 area for UUP. The dollar is in a long term structural decline. My time line target is mid June for the end of the countertrend move to the upside. I look for a violation of the lows at 20.80, and then a fall towards $19.30, likely by mid fall.
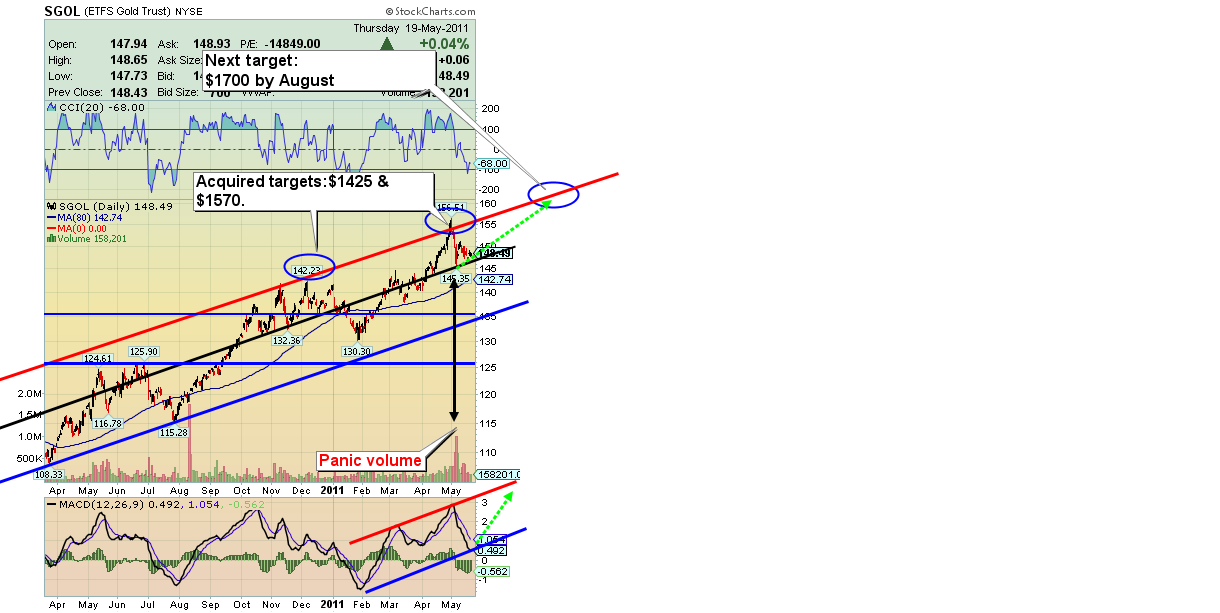
SGOL (gold bullion proxy) Chart
- The $1570 target was acquired. The immediate pullback from the $1570 overshoot offered a new buy at $1475. Gold touched the $1462 area. Looking forward, I see a minor up move, followed by more selling into mid June. From there I expect a huge move to the upside that will substantially eclipse my $1700 target.
- The most important chart in the gold trade is the channel overshoot shown on the above chart. The overshoot chart set the $1425 target in November, which was hit. The most recent call for $1570 was based upon the inverse head and shoulders pattern, one that went unnoticed by the majority of investors. When a dependable chart pattern goes unnoticed it can become even more powerful.
- The overshoot of that price supply band has bullish implications, and will likely give the price a premature bump up into the upper channel by August. Don’t let the current negative sentiment scare you away from gold or gold stocks.
- Much of the fear in the precious metal markets is in relation to the Fed’s QE2 program, which is supposed to end in June. I believe what is actually coming is an unwinding of the “sell gold in fear” trade. Selling gold in fear means buying the dollar. The dollar has been going up a tiny bit, but if you look closely at the above chart, it’s a disaster. The debt factors that have caused this chart to look so horrendous are bigger than ever.
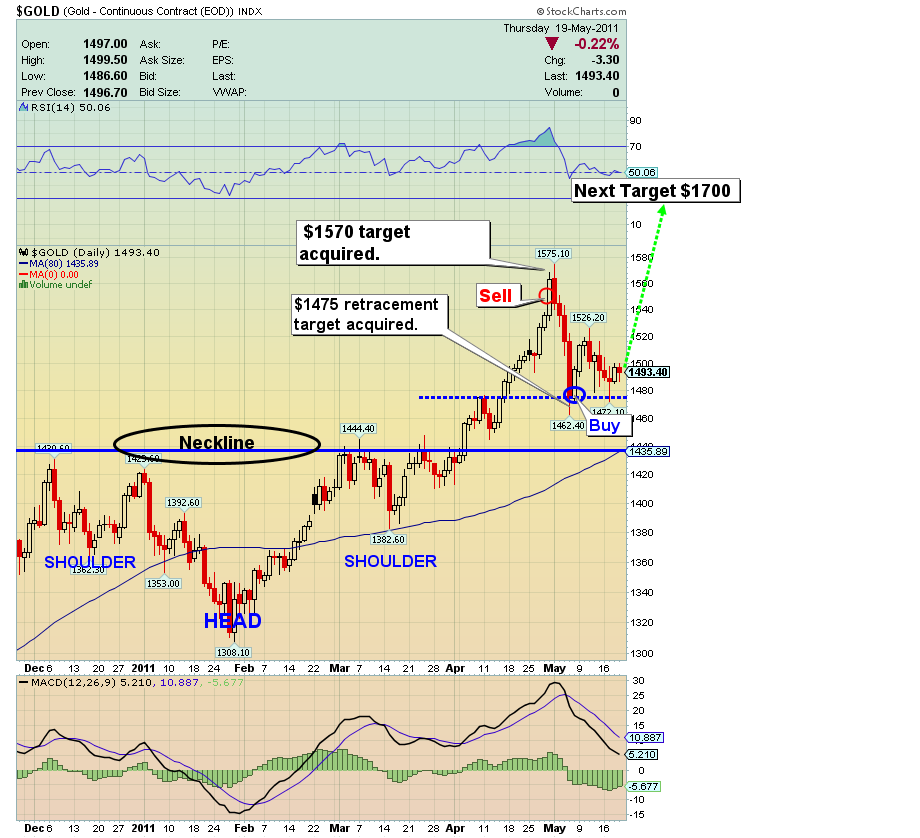
Gold Head and Shoulders Chart
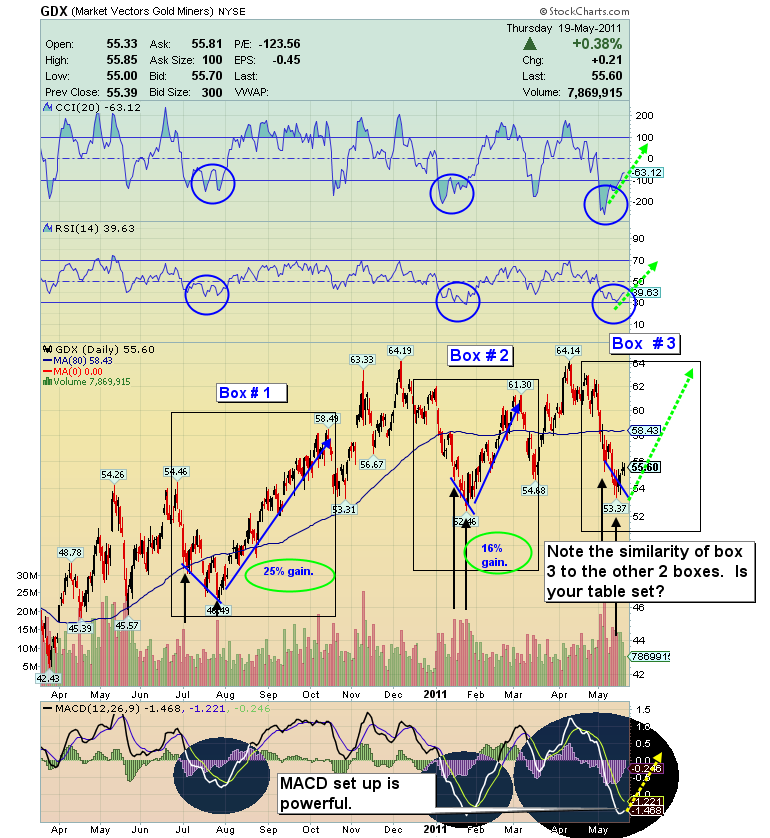
GDX 14 Month Chart
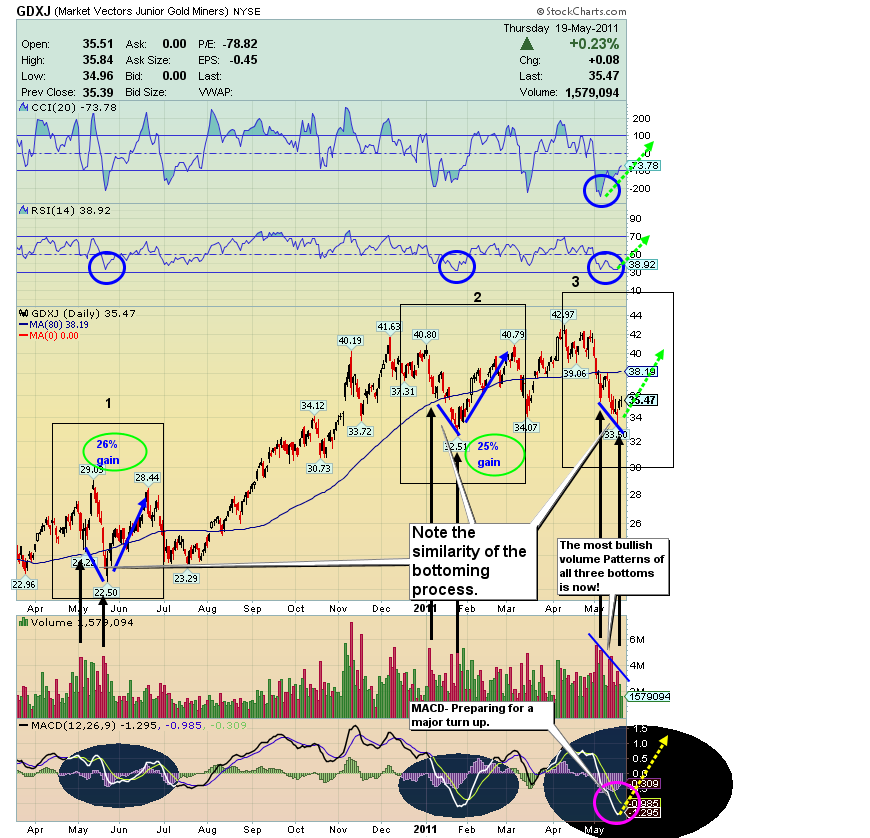
- The above chart looks at three periods of ideal buying opportunities, including the current timeframe. As I examine RSI, MACD, and volume, I believe the current market has the word “buy opportunity” written on it, while surveys suggest only 7% of my gold timing colleagues are bullish.
- In that vein, I want to take a harder look at market psychology this week, in particular with gold stocks. When a correction comes, technicians like to use phrases like “chart damage” to explain the rebuilding process that the price will have to undergo.
- Unfortunately, chart damage is better explained as trader psychology damage. When a market turns down after an extended upswing, those most bullish usually have heavily positioned themselves near the highs of that swing and they get badly damaged on the ensuing fall. Those of you who have been cautious are now in the driver’s seat, with fresh capital to inject into the market.
- Allocation is the tricky work. My latest buy signal came Tuesday, into the lows for the move, after earlier buys at higher prices. You have to keep some powder dry no matter how silly that seems. I advocate continuing to buy as the price goes lower. My entire timing system is ruled by buying weakness and selling strength.
- I am quite worried that many investors who recently took losses in gold will rebuy if gold crosses over $1580. Buy now, not $100 higher. It can be discouraging at times to buy when everything points to lower prices, but note the above buy set-up in the last year. The real money is made after most assume the bottom is reached. The price then fools the majority and heads yet lower again, and that is the ideal entry place. That time in the gold market is now.
- There’s nothing wrong with holding gold equities in this bull market, but some short term trading that will shave strength is important.
- My advice for the metal sectors is to hold a core position of 65%, leaving the remaining position as a tradable portion of your portfolio. Over the long haul this is where the money is made, because when the market moves nobody will likely be able to trade it. Silver’s decline from about $50 to $32 was an example of what kind of volatility will likely be coming to the gold stock sector.
GDXJ 14 Month Chart
- This GDXJ chart is exactly the same timeline as the previous chart for GDX that examined the gold senior stocks. The comparisons of the three sections on both charts are compelling. I don’t look for this market to get fully engaged on the upside until mid to late June, but this is an example of the last great buy opportunities that you will have in the gold markets. If you are underinvested in gold stocks, this would be a great place to place additional capital. My largest money in the bull market to date, for gold stocks, went into this market through Tuesday.
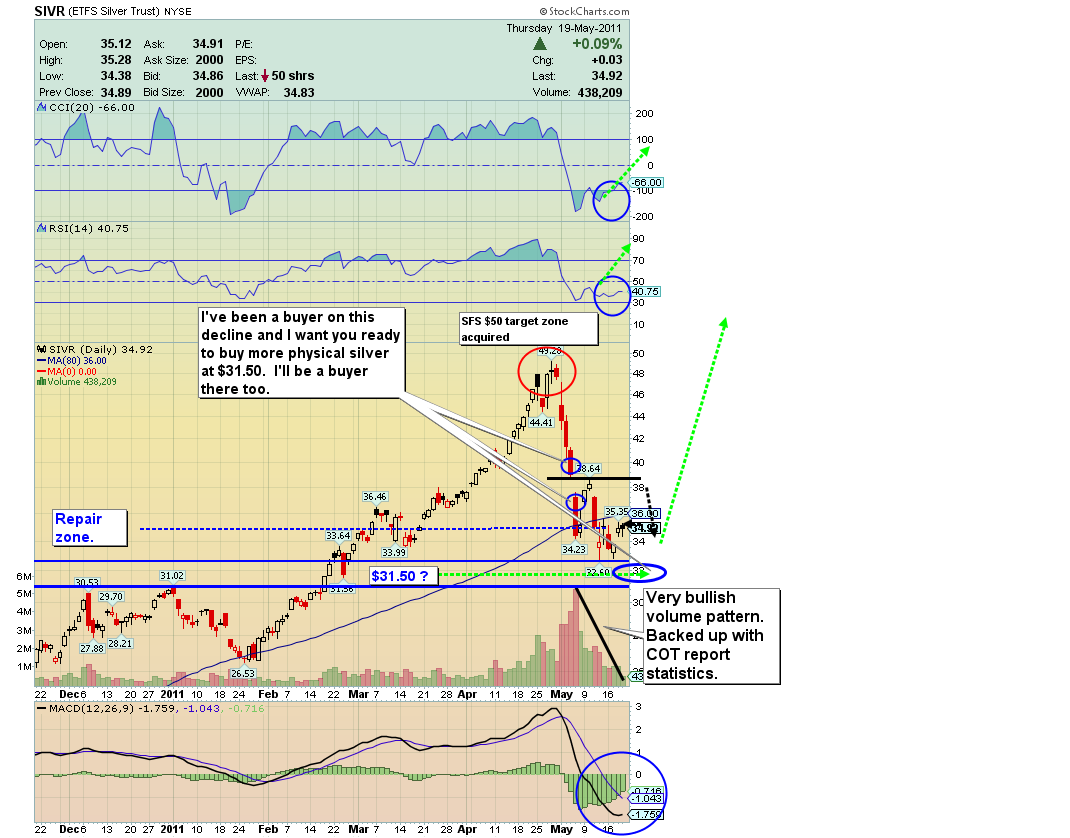
Silver via SIVR- 6 months
- Silver has gone through a violent correction, and is now in the technical repair zone. Again, those who acted on their wildly bullish emotions at the top, buying silver with leverage, are now blown away. That said, in my opinion silver should be bought into this and further weakness. I bought physical silver in the $35 price area. My next buy of physical metal will be at the $31.50 area, as you can see pointed out on the chart. I see a change in character back to the bullish uptrend by mid-June, and new highs are most likely to be seen by August. Buckle your seat belts, because the silver price roller coaster will only get wilder.
Friday, Jul 3, 2026 Super Force Signals Unique Introduction For 321Gold Readers:
Send me an email to admin@supergoldsignals.com and I’ll send you my free “Inflation Thunder Now!” gold and silver stocks video report. I’ll also include 3 of my next Super Force Surge Signals free of charge, as I send them to paid subscribers. Thank you!
|
Stay alert for our Super Gold alerts, sent by email to subscribers,
for both the daily charts on Super Force Signals at www.supergoldsignals.com and for the 60 minute
charts at www.supergoldsignals.com
About Super
Gold Signals:
Our Surge Gold Signals are created thru our proprietary blend
of the highest quality technical analysis and many years of successful
business building. We are two business owners with excellent synergy.
We understand risk and reward. Our subscribers are generally successfully
business owners, people like yourself with speculative funds,
looking for serious management of your risk and reward in the
market.
Frank Johnson:
Executive Editor, Macro Risk Manager.
Morris Hubbartt: Chief Market Analyst, Trading Risk Specialist.
website: www.supergoldsignals.com
email:
admin@supergoldsignals.com
email: admin@supergold60.com
Mail:
1276 Lakeview Drive
Oakville, Ontario, L6H 2M8
Canada
###
May 20, 2011
Morris Hubbartt
321gold
Ltd
|
