Super Force Signals - A Leading
Market Timing Service
We Take Every Trade Ourselves
Gold Markets: Buy Signals Now
Morris Hubbartt
Weekly Market Update Excerpt
posted May 13, 2011
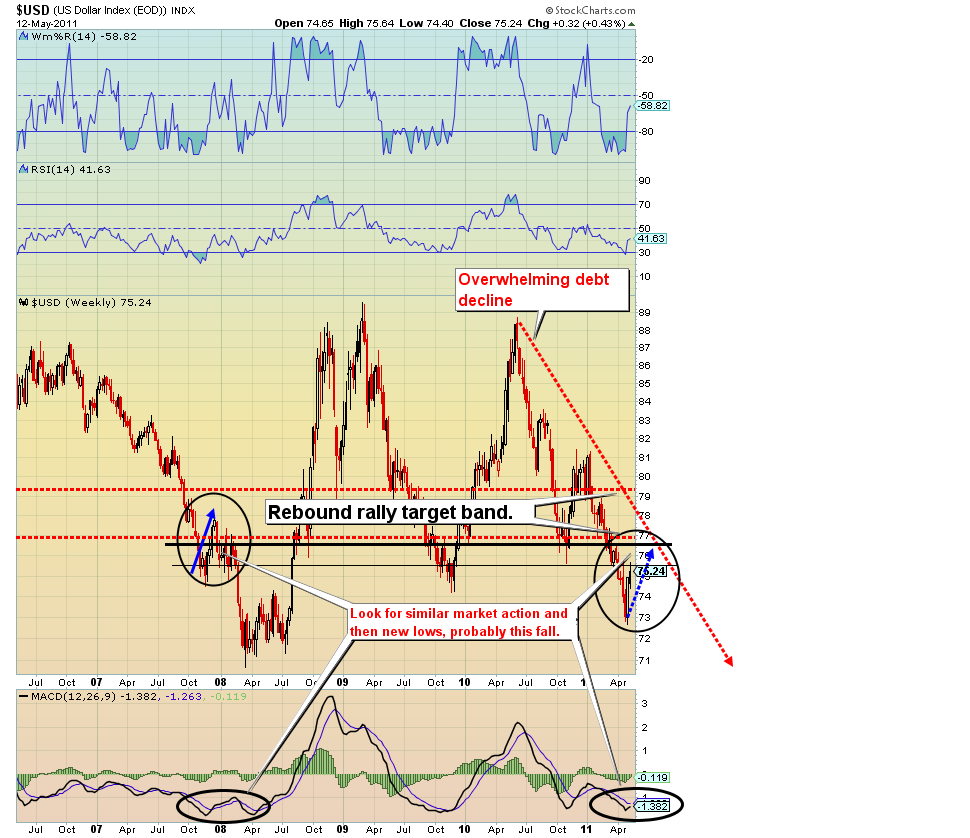
US Dollar Chart
Dollar Analysis
- Negative sentiment is unwinding, and the dollar has started a countertrend rally. Now is the time to prepare for the next decline. The dollar’s strength should be used to buy physical metal at sale prices, which is exactly what I am doing. There is enough volume on the dollar to push it slightly above my target band chart. I expect the counter trend rally to end around mid June.
- On May 6th, I issued a SFS Fuel Cell Volume (FCV) bull move indication, but this is not a buy signal to act on. I recommend investors stay away from the USD. The appearance of a FCV day in a bear market will normally provide much less of a bounce than a FCV day in a bull market. The dollar is in a bear market, and remains a long term sell. Debt destroys fiat currency, and this chart technically paints that picture of fundamental destruction. Technically, the US dollar is climbing the diving board ladder to put on a great swan dive performance. The only problem is that there is no water in the pool.
SGOL (Gold Bullion Proxy) Overshoot Chart
- The above chart is a classic channel overshoot. A technical overshoot to the upside indicates price is headed higher. My target is $1700.
- Also, note the head and shoulders chart below. As price retraced to support at the dotted blue line, it produced a buy signal. Gold is already showing signs of readying for the next leg up. As the dollar should peak around mid June, so gold should then start rising towards $1700. That is 4 weeks away!
- My sentiment indicators are phenomenal for gold right now, from a contrarian standpoint. The mass denial of the gold bull by the public is denial of common sense economics. The idea that piling debt on top of debt is a productive solution to the nation’s economic problems is madness.
Gold Head and Shoulders Chart
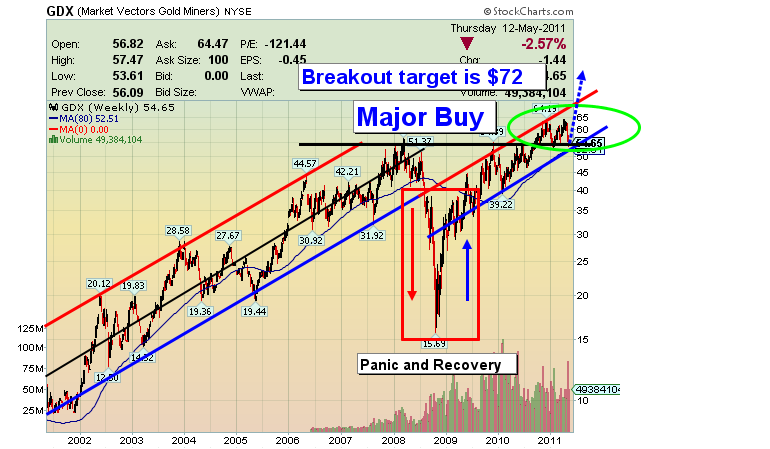
GDX 10 Year Chart
- General sentiment on gold stocks is reaching levels that are almost ghoulish. The scariest of all times in a market are the times of capitulation. The number of gold bulls on a percentage basis is apparently now in the low single digits.
- I’m looking for a quick plunge a bit deeper for gold stocks, followed by an advance on good volume. I am confident that the current basing formation taking place in gold stocks will be viewed in hindsight as the one that began the outperformance of gold stocks against bullion. I continue to add to my gold stock positions.
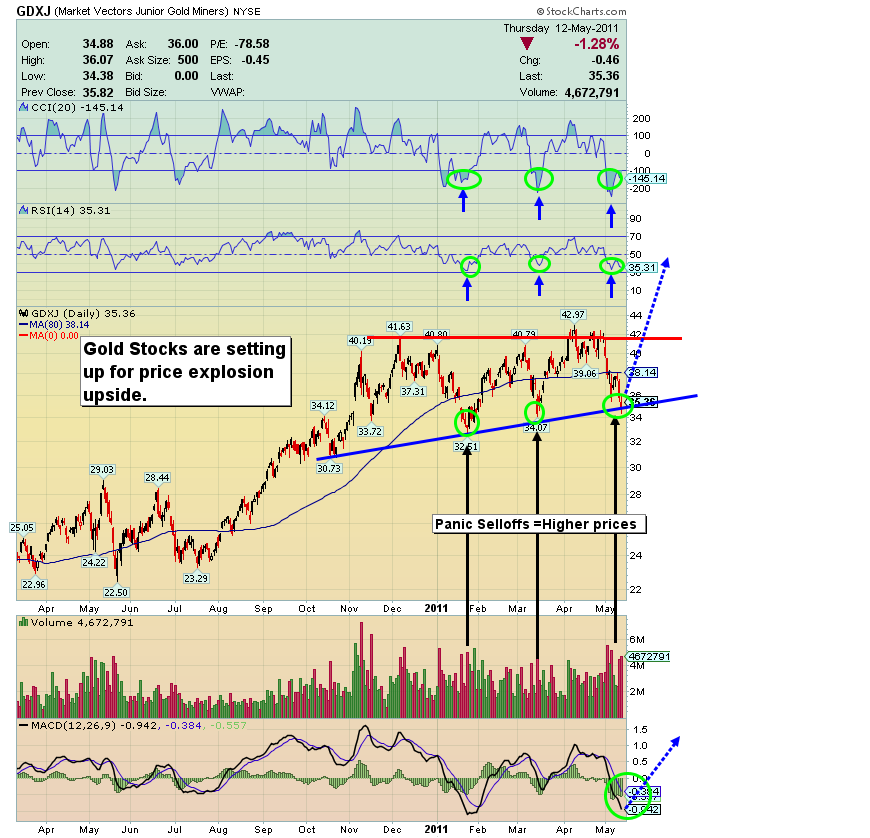
GDXJ 14 Month Chart
- It is important to understand the disconnection between gold and gold stocks. Governments are huge buyers of gold. Iran is apparently the fourth largest holder of gold, and is reportedly buying more. Central banks are not interested in owning gold stocks. The big gold stock buyers are institutional and individual investors who generally are already in equities like the S&P 500.
- The greatest fundamental of any gold stock is the price of gold. Wall Street will wake up and eventually there should be a stampede into gold stocks. The price of the metal almost guarantees higher gold stocks. As gold has acquired the $1500 target, gold stocks are beginning the transition into enormous cash cows. Cash flow and earnings generation on the current price of gold will demand price appreciation in the stock price.
- At this point gold stocks are worse than just unnoticed. They are despised and shorted. I predict this situation will not just end, but reverse. Gold’s rising price is undeniable because of habitual debt, and that means gold stocks are undeniable.
- This GDXJ chart is coiling like a cobra to strike much higher dollar prices! The technical situation is extremely attractive, to the point I would call it “explosive.” Use this price weakness to be fairly aggressive in your gold juniors buying. Note the previous lows within this congestion pattern. Substantial rallies followed. I expect it will be the same again, except this rally could be even bigger than the others!
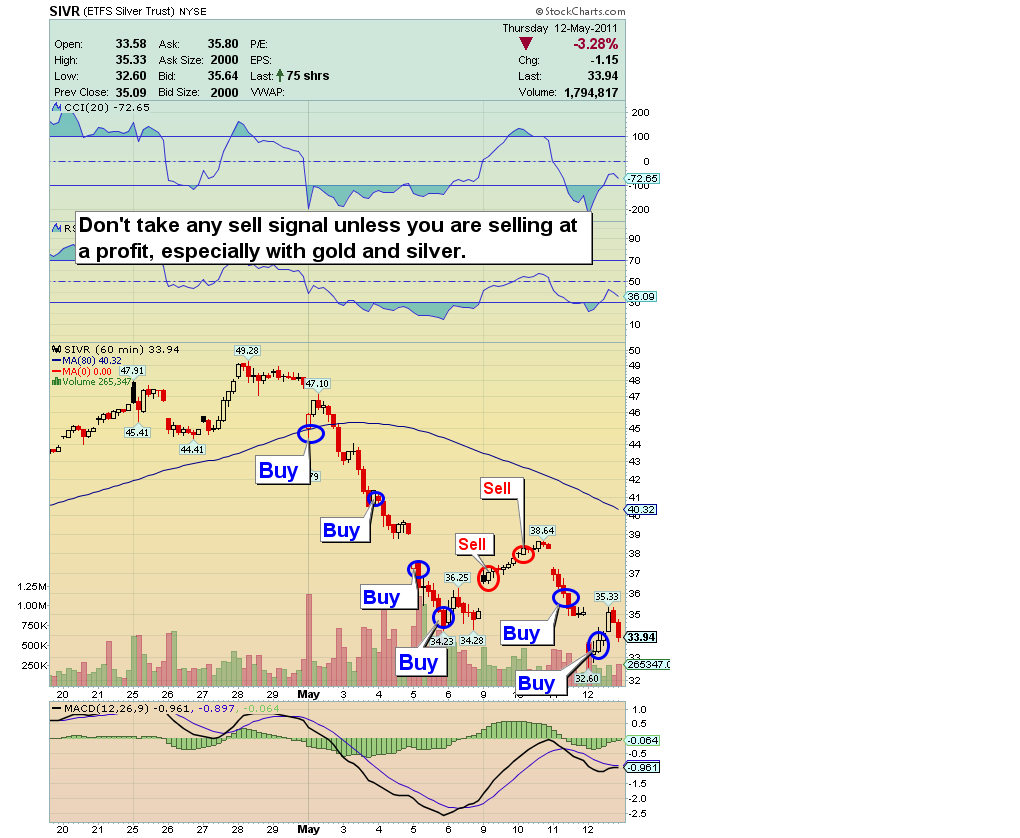
Silver via SIVR- 60 min Chart
- I started a buy program on Monday May 2nd, enlarging my position as price declined; by the following Monday the position was already profitable. Note that if you bought in equal size at each buy signal I issued, you could be underwater now. The key to all profitable buy programs is starting the first few buys with very small size. Buy larger as price declines more.
- 60 minute charts generate more frequent buy and sell signals than daily charts do, and the moves tend to be smaller. When silver becomes volatile, as it has recently, tremendous opportunity presents itself for the short term trader, yet the long term investor can use the same signals to increase his/her physical metals positions.
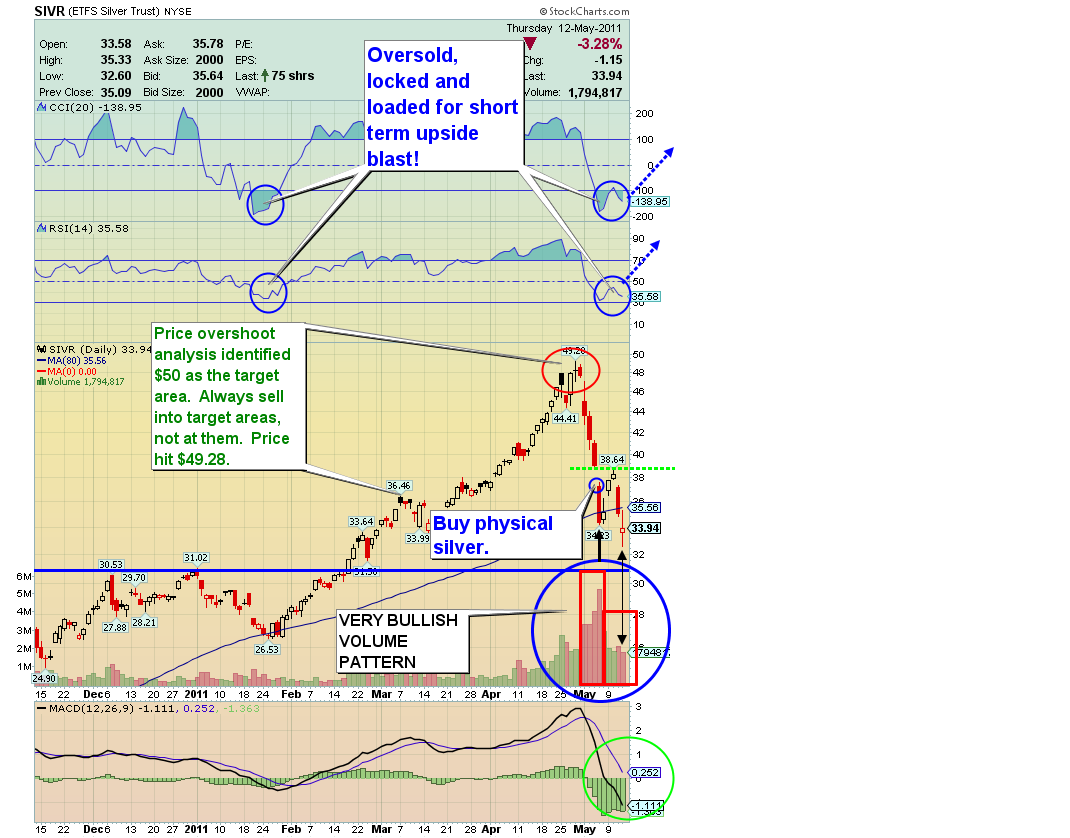
Silver via SIVR- 6 months
- The sentiment on silver has quickly gone from ridiculously bullish, to a market dominated by fear-induced selling.
- At $30 silver, you are buying silver on sale, at about 40% off of the highest point reached in this bull market.
- Buy trading positions on moderate weakness. Buy physical metal on powerful weakness. This sell-off is powerful, so use it to accumulate physical silver. I started buying in the $35 area. Buy the amount you can handle comfortably, because we could go lower.
Friday, Jul 3, 2026 Super Force Signals Unique Introduction For 321Gold Readers:
Send me an email to admin@supergoldsignals.com and I’ll send you my free “Inflation Thunder Now!” gold and silver stocks video report. I’ll also include 3 of my next Super Force Surge Signals free of charge, as I send them to paid subscribers. Thank you!
|
Stay alert for our Super Gold alerts, sent by email to subscribers,
for both the daily charts on Super Force Signals at www.supergoldsignals.com and for the 60 minute
charts at www.supergoldsignals.com
About Super
Gold Signals:
Our Surge Gold Signals are created thru our proprietary blend
of the highest quality technical analysis and many years of successful
business building. We are two business owners with excellent synergy.
We understand risk and reward. Our subscribers are generally successfully
business owners, people like yourself with speculative funds,
looking for serious management of your risk and reward in the
market.
Frank Johnson:
Executive Editor, Macro Risk Manager.
Morris Hubbartt: Chief Market Analyst, Trading Risk Specialist.
website: www.supergoldsignals.com
email:
admin@supergoldsignals.com
email: admin@supergold60.com
Mail:
1276 Lakeview Drive
Oakville, Ontario, L6H 2M8
Canada
###
May 13, 2011
Morris Hubbartt
321gold
Ltd
|
