Super Force Signals - A Leading Market Timing Service
We Take Every Trade Ourselves
Gold Hurts But Dow Is Toppy Morris Hubbartt
Weekly Market Update Excerpt
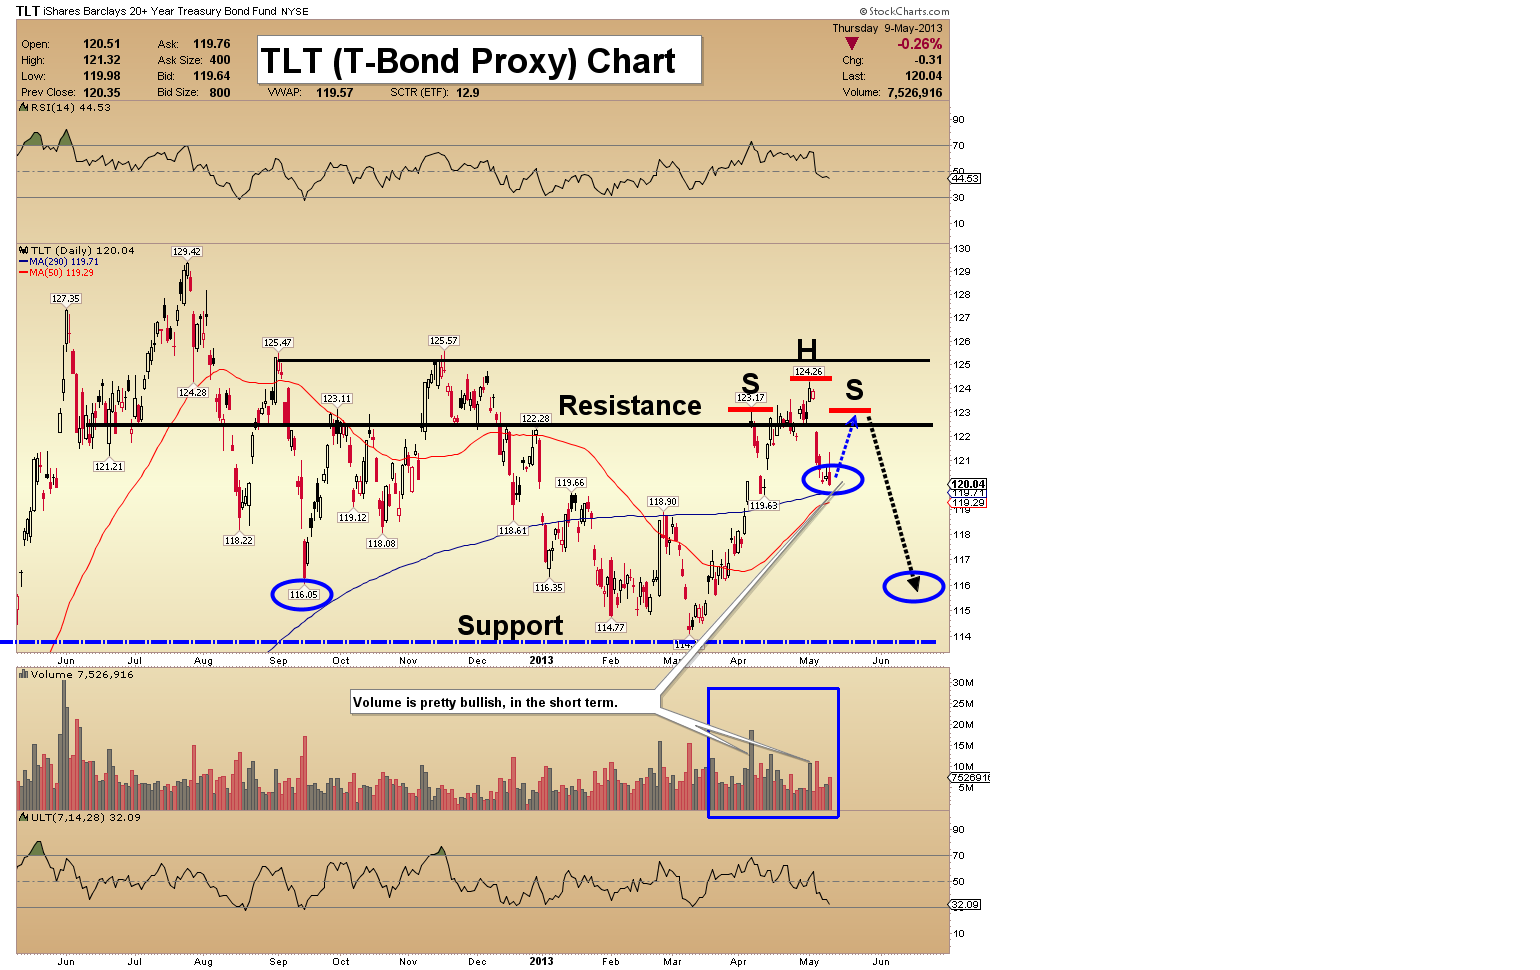
posted May 10, 2013 TLT (US T-Bond Proxy) Chart - From a technical standpoint, conflict is in the air. Volume patterns are decent. This tells me that there is a good chance that a light bounce will likely come, before the bond has a deeper sell-off, towards 116.
- The small rally could complete a small head and shoulders formation.
- After a fall to the 116 area, I’m projecting a huge rally to new highs, which could coincide with a stock market crash this autumn.
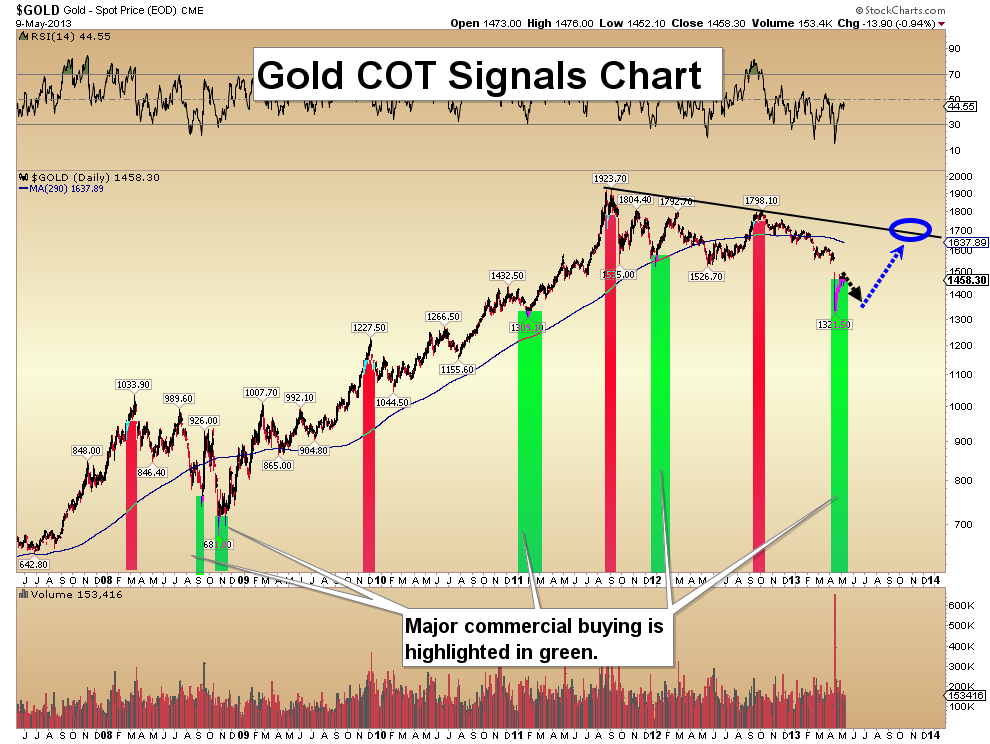
Gold COT Signals Chart - On this chart, I have highlighted the major commercial buying and selling areas, over the last 6 years. As the chart clearly shows, these “smart money” purchases have generally occurred during major price weakness.
- We are grinding through a prolonged period of such weakness now, and the commercials have been buying long positions and covering shorts. There are also rumors they are buying physical gold.
- The big money in any market is usually made by buying extreme weakness. The latest COT reports may not indicate that the lows are in. They do indicate that commercial traders believe gold offers tremendous value to buyers.
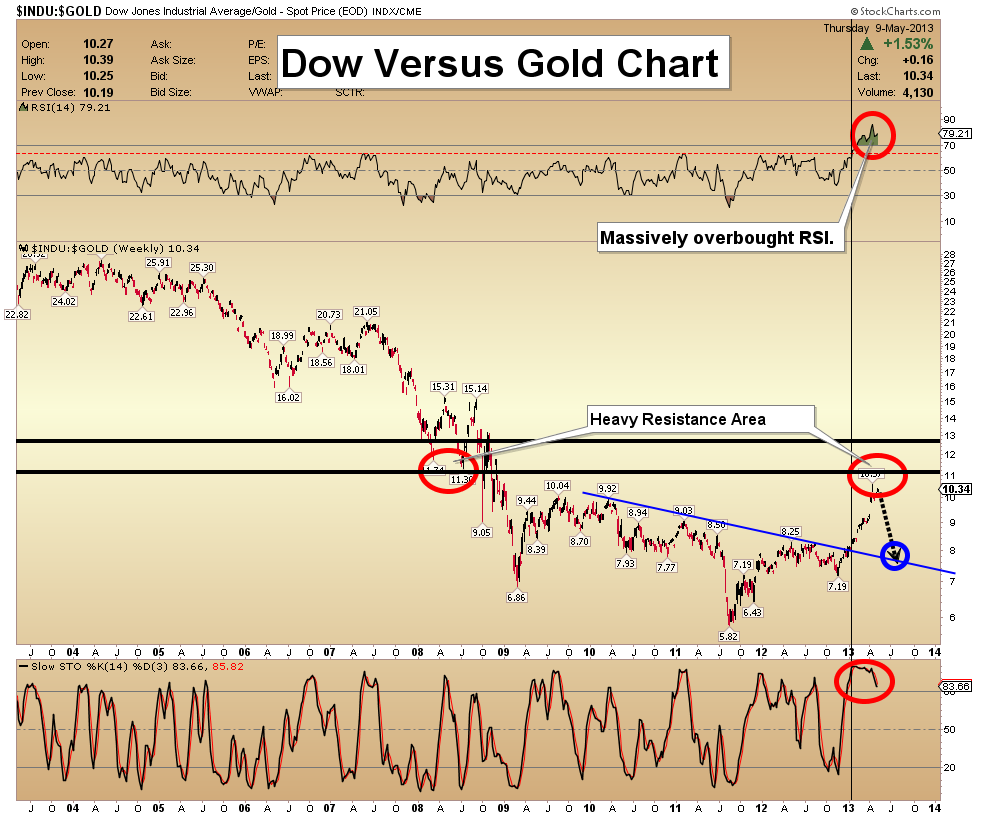
Dow Versus Gold Chart - Note the massively oversold condition of the slow stokes and the RSI indicator.
- In the case of the RSI indicator, it spiked to above 85, which is an extreme overbought reading. The Dow’s move higher is likely ending.
- On this chart, the Dow has risen back up to the area that produced the initial breakdown, in late 2008.
- The slow Stokes is rolling over. If it breaks below 80, the Dow could fall pretty hard, against gold. Don’t rush into the Dow, just because gold is having a rough time. That could be like jumping out of the fry pan, into the fire!
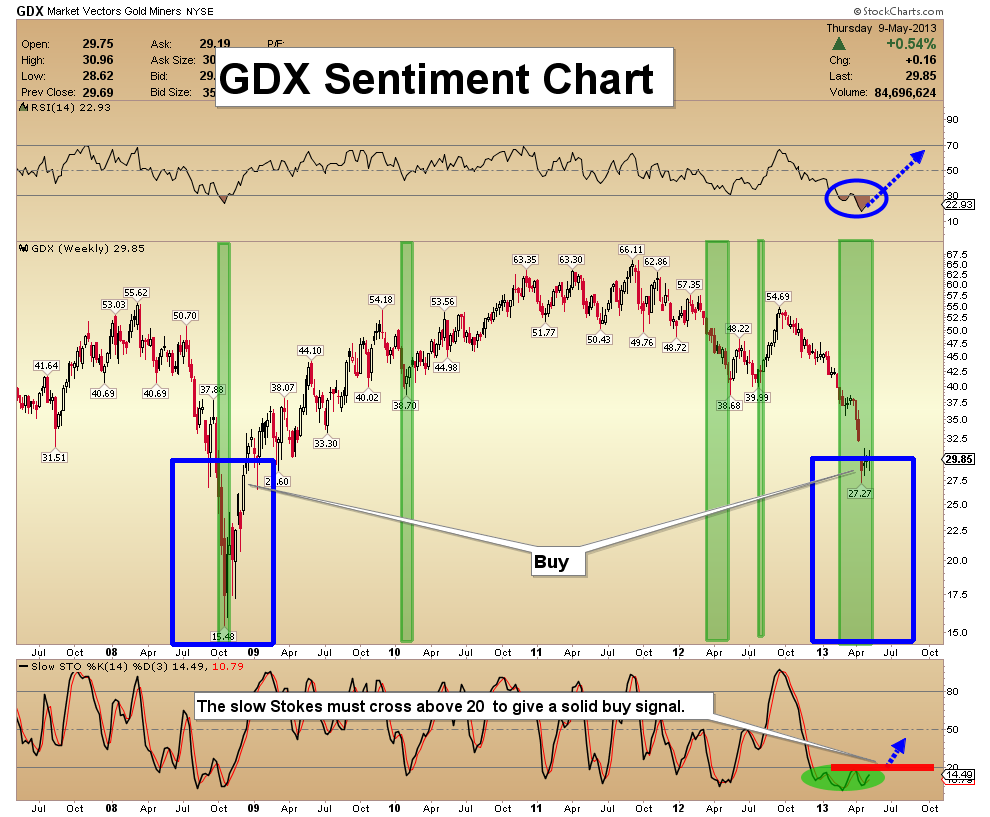
GDX Sentiment Chart - Gold stocks are now sitting near 2008 levels, in terms of investor sentiment. Unfortunately, that doesn’t mean they can’t get even more undervalued.
- From a trading perspective, the “new lows ahead” door is open. GDX needs a rally that would fill the gap on the chart in the $32 area.
- If it doesn’t happen soon, new lows are likely.
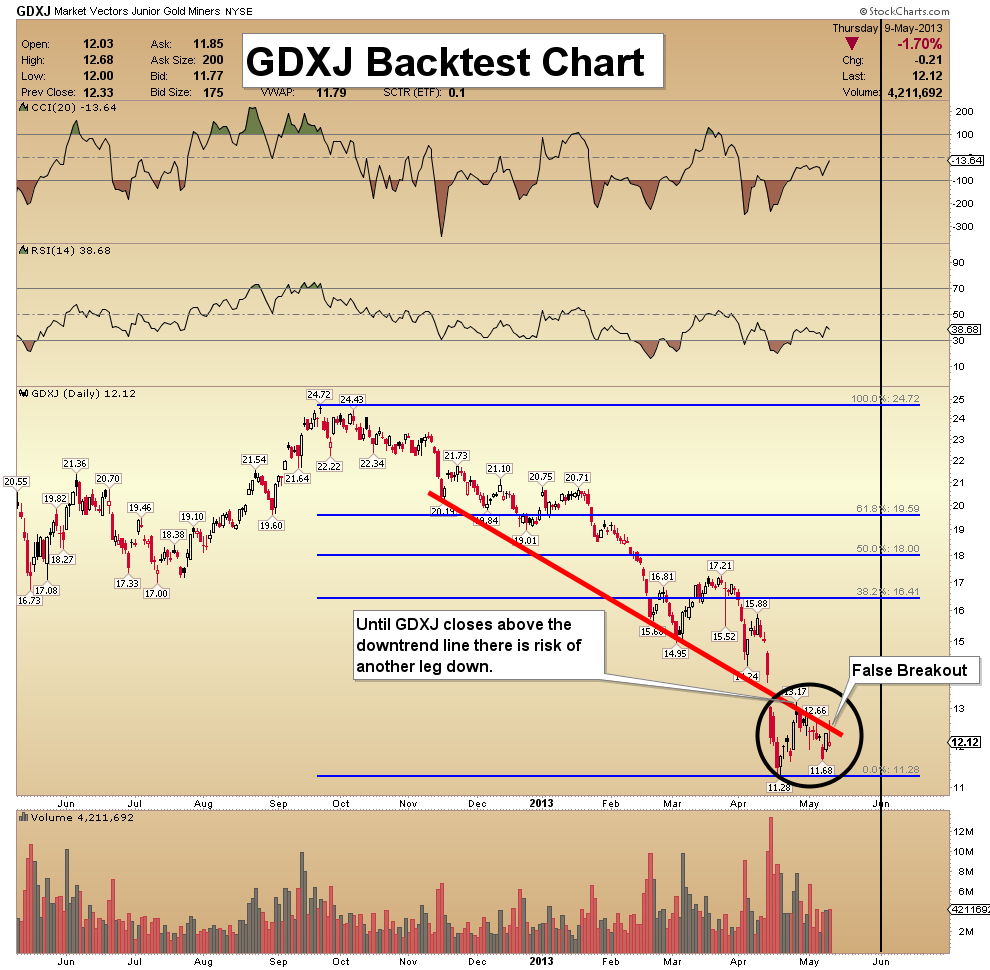
GDXJ Backtest Chart - I am confident that junior gold stocks will perform strongly, over the long term. My opinion in the short term is unchanged; I am waiting for the dust to settle.
- Wednesday’s GDXJ price advance lacked volume.
- Until the red backtest line is taken out on the upside, I would like to see gold stock investors concentrate buying on the senior stocks, where there is less risk.
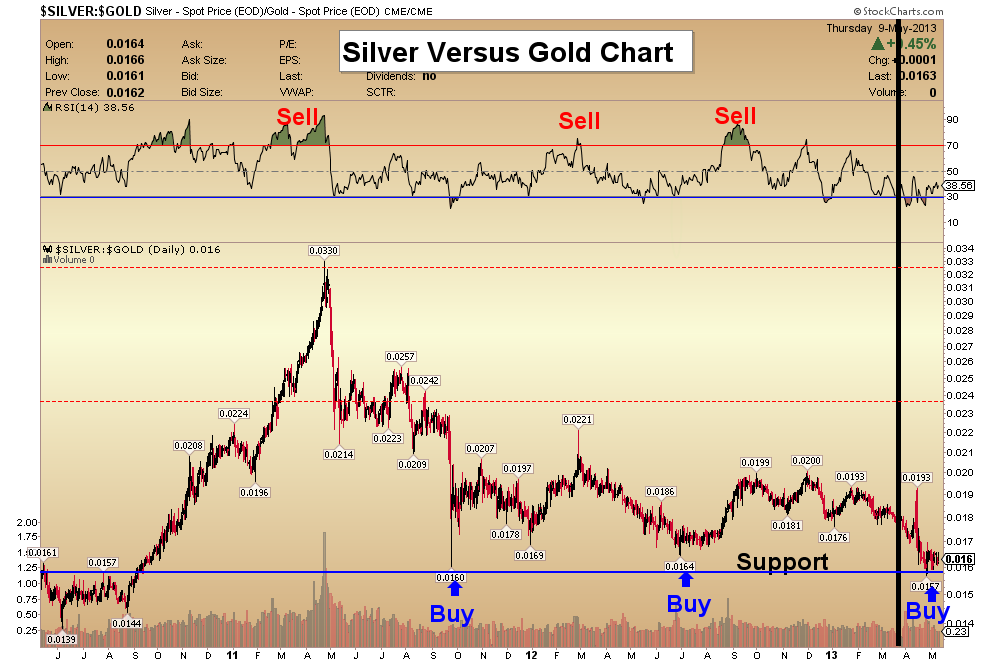
Silver Versus Gold Chart - Silver is down near the key level of 16 on this ratio chart, which served as a launching pad, when silver began the move towards $50 per ounce.
- I like to buy when the ratio is near 16, and sell when the RSI oscillator becomes overbought.
- Gold is being hit hard in early trading today, but silver is holding up much better. I like silver much better than gold, at the current price!
Friday, Jul 24, 2026 Super Force Signals Unique Introduction For 321Gold Readers:
Send me an email to admin@supergoldsignals.com and I’ll send you my free “Inflation Thunder Now!” gold and silver stocks video report. I’ll also include 3 of my next Super Force Surge Signals free of charge, as I send them to paid subscribers. Thank you!
|
Stay alert for our Super Gold alerts, sent by email to subscribers,
for both the daily charts on Super Force Signals at www.supergoldsignals.com and for the 60 minute
charts at www.supergoldsignals.com
About Super
Gold Signals:
Our Surge Gold Signals are created thru our proprietary blend
of the highest quality technical analysis and many years of successful
business building. We are two business owners with excellent synergy.
We understand risk and reward. Our subscribers are generally successfully
business owners, people like yourself with speculative funds,
looking for serious management of your risk and reward in the
market.
Frank Johnson:
Executive Editor, Macro Risk Manager.
Morris Hubbartt: Chief Market Analyst, Trading Risk Specialist.
website: www.supergoldsignals.com
email:
admin@supergoldsignals.com
email: admin@supergold60.com
Mail:
1276 Lakeview Drive
Oakville, Ontario, L6H 2M8
Canada
### May 10, 2013
Morris Hubbartt
321gold Ltd
 |
