Super Force Signals - A Leading
Market Timing Service
We Take Every Trade Ourselves
Gold & USD: Launching Gold Stocks!
Morris Hubbartt
Weekly Market Update Excerpt
posted Apr 29, 2011
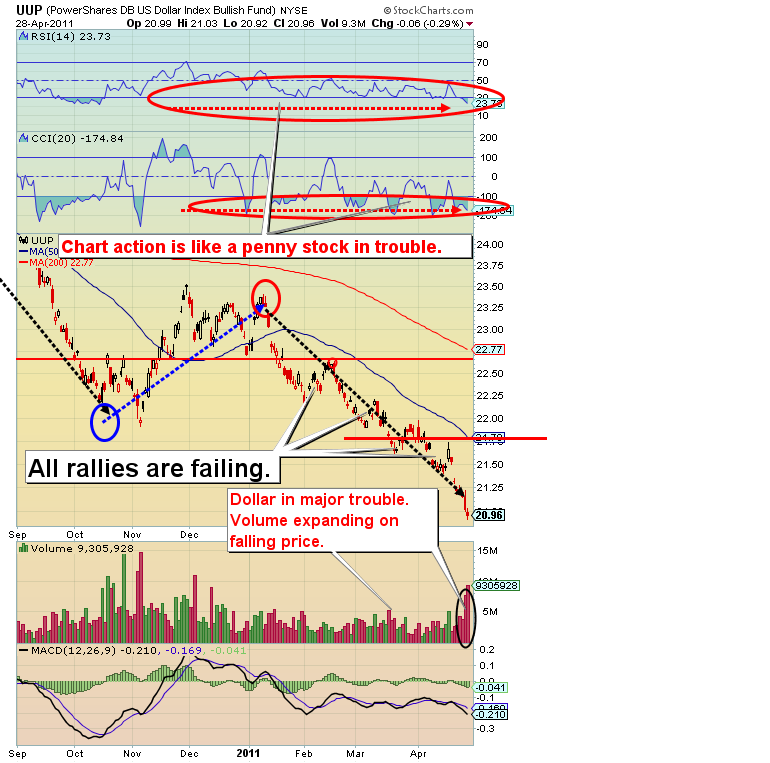
UUP (US Dollar Proxy) Chart
Dollar Analysis:
- What goes around comes around? In 2008 the US dollar crushed gold. The situation is reversed now. In time, the dollar could look like gold stocks did in 2008, and could be headed for the dustbin of history.
- The horrific technical situation tells me that institutional nervousness is growing like wildfire. After Ben Bernanke’s press conference, the UUP chart immediately painted a horrible picture.
- Some media has reported that over 58% of all Americans now receive money from the federal government, in one form or another. This is probably unsustainable, and the chart certainly tells a story of unsustainable price. The US dollar chart looks like a sick penny stock losing institutional support. The dollar is a global problem, and physical gold is your solution!
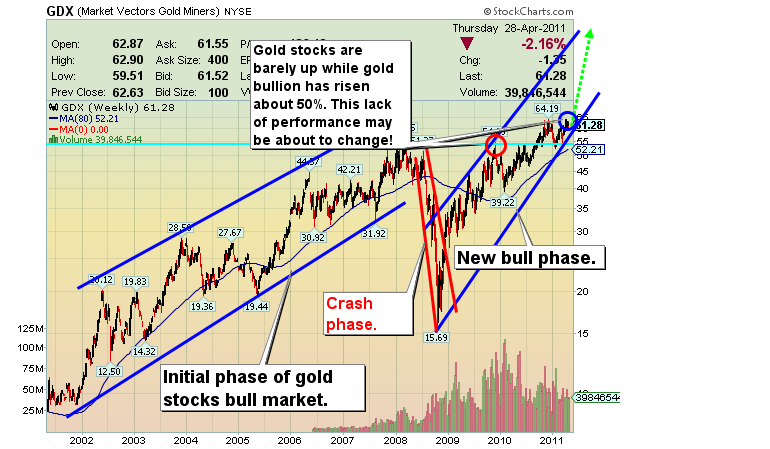
GDX (10 year chart)
GDX Chart Analysis
- The bull market in gold stocks appears to be near a rebirth and new uptrend. Many analysts and investors assumed the $1500 level would see a significant correction in bullion. Instead, the bears have been focusing their financial guns on the gold stocks.
- While the gold stocks bull market is about 10 years old, the trading patterns of gold stocks at this point are those of a young bull! That tells me of enormous upside potential. Indecision is frequently causing a pullback in gold stocks late in the trading day, which is classic early stage bull action. The reason this happens is because Wall Street has a “follow the herd” mentality.
- Until the herd sees momentum action, they sit and watch. The biggest mutual fund managers understand value, and it is starting to become very apparent to them that further gains in gold bullion make the stocks very attractive buys. In time, I believe the mutual funds will crush the ratio trading hedge funds, with a huge move of liquidity into gold stocks.
- Look at my 10 year GDX chart. Understandably, many gold stock shareholders are living in a state of terror, fearing of the 2008 situation. My charts indicate gold stocks are set to begin a substantial advance, and that undercurrent of fear of another 2008 adds to the bullish case. Markets climb walls of worry.
- Crude oil is up 28% in six months, while GDX is up only about 10%. I’m selling some crude and moving into a heavier GDX position, using 60 minute chart buy signals to build a solid GDX core.
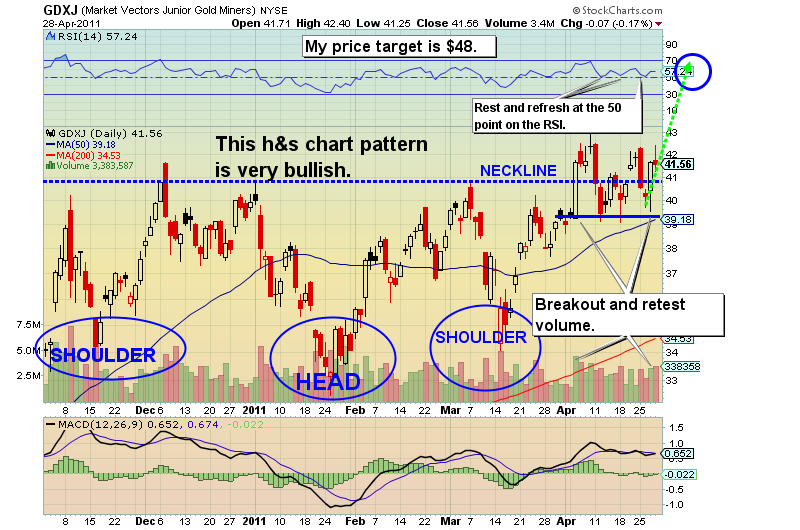
GDXJ (gold juniors) Chart
GDXJ Analysis:
- A mighty move upwards for gold juniors is near. The greatest fundamental for mining companies is the price of the metal. Gold is $1533, and projected even higher. The bearish factors are slowly but steadily being crushed by this key fundamental, the gold price.
- The head and shoulders chart pattern on GDXJ appears to be in launch mode now, after what has been a very trying couple of weeks for investors! VBS (volume based support) was tried, tested and held again this week. A big upleg for juniors should now begin. Note the RSI action. I term the RSI your “rest and refresh” indicator. The current positioning of the RSI for GDXJ is similar to those where big rallies have occured in many bull markets.
- My Super Force GSR (Gold Stock Ratio) is projecting $75 for GDXJ. In recent bull moves in gold stocks, the juniors have quietly become the leaders. I expect this leading action on rallies to continue. A shift in thinking is taking place as the rising gold price is set to overwhelm the ratio traders, putting the stocks front and center in the gold community. In time, gold stocks may be front and center on Wall Street.
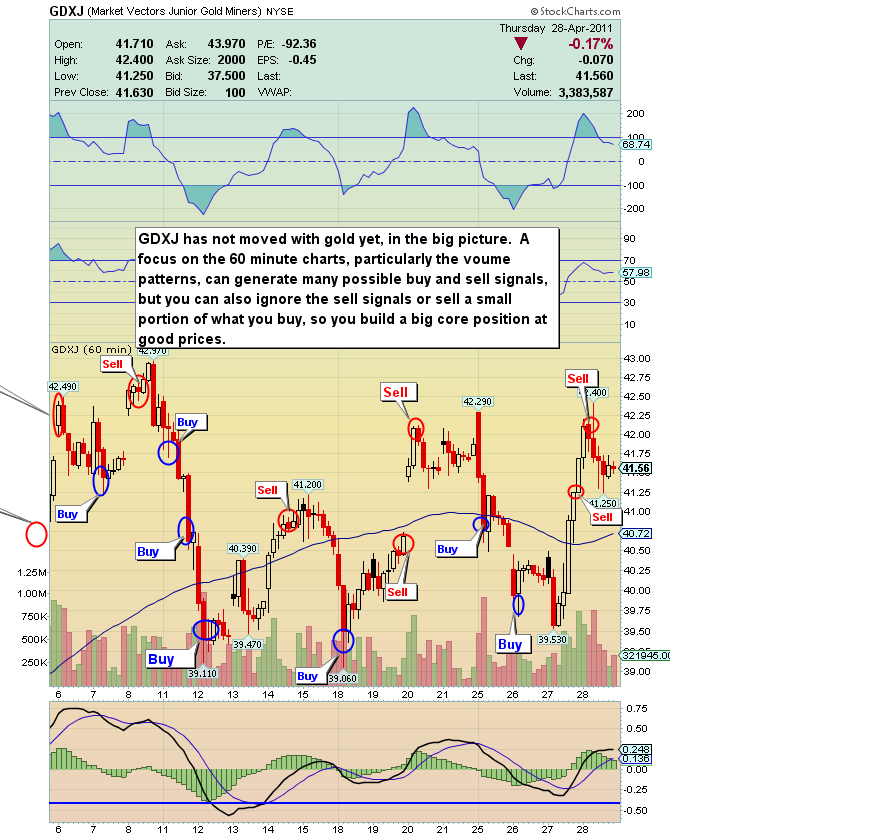
- Note the 60 minute chart for GDXJ. I’ve highlighted a number of possible buy and sell signals generated by my indicators and volume analysis. Long term investors can use short term signals to build and enlarge core positions. It is not a free lunch; note how price can keep falling after a buy signal is generated. A buy signal is a partial risk capital placement signal, not a back up the truck call. Ignore the sell signals and act on the buys, to build a quality long term position in GDXJ!
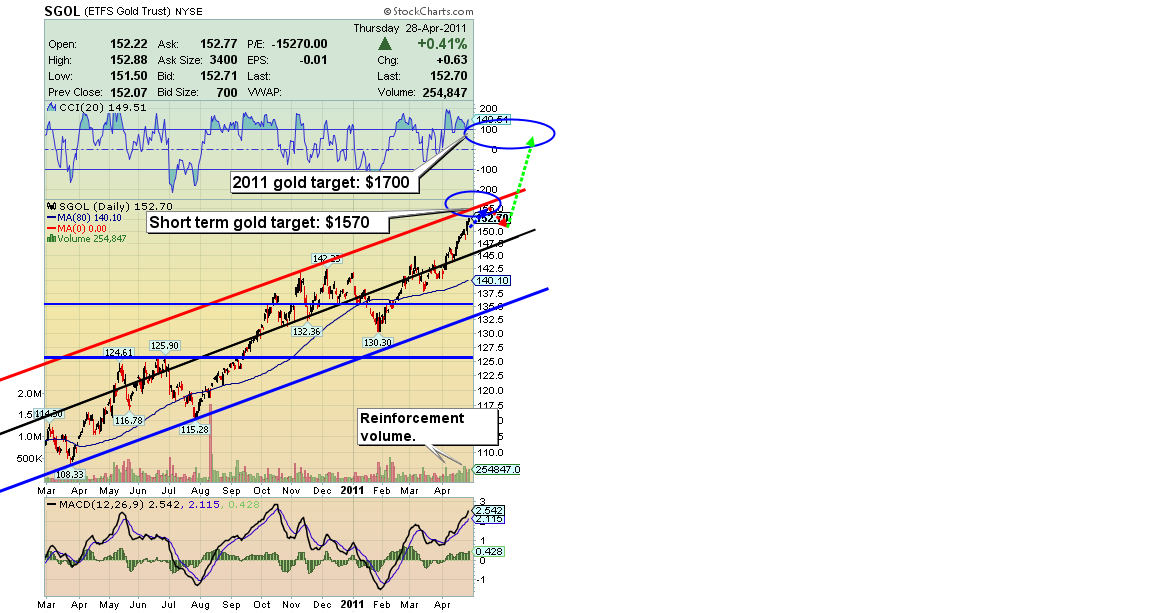
SGOL (gold bullion proxy) Chart
SGOL Analysis
- SGOL remains firmly on a buy signal. My indicators are not generating a sell signal yet. This is a very strange situation, and a very profitable trade.
- Gold has had one solid move after another, yet there are a lot of skeptics still about the strength of the bull market. The level of skepticism itself indicates to me that price may still have room to wiggle higher.
- I am projecting a short term target of $1570 for gold. The terrible chart picture and price action of the US dollar is a wildcard. Before the next intermediate correction in gold occurs, institutional nervousness about the dollar could send gold to $1625!
Friday, Jul 3, 2026 Super Force Signals Unique Introduction For 321Gold Readers:
Send me an email to admin@supergoldsignals.com and I’ll send you my free “Inflation Thunder Now!” gold and silver stocks video report. I’ll also include 3 of my next Super Force Surge Signals free of charge, as I send them to paid subscribers. Thank you!
|
Stay alert for our Super Gold alerts, sent by email to subscribers,
for both the daily charts on Super Force Signals at www.supergoldsignals.com and for the 60 minute
charts at www.supergoldsignals.com
About Super
Gold Signals:
Our Surge Gold Signals are created thru our proprietary blend
of the highest quality technical analysis and many years of successful
business building. We are two business owners with excellent synergy.
We understand risk and reward. Our subscribers are generally successfully
business owners, people like yourself with speculative funds,
looking for serious management of your risk and reward in the
market.
Frank Johnson:
Executive Editor, Macro Risk Manager.
Morris Hubbartt: Chief Market Analyst, Trading Risk Specialist.
website: www.supergoldsignals.com
email:
admin@supergoldsignals.com
email: admin@supergold60.com
Mail:
1276 Lakeview Drive
Oakville, Ontario, L6H 2M8
Canada
###
Apr 29, 2011
Morris Hubbartt
321gold
Ltd
|
