Super Force Signals - A Leading
Market Timing Service
We Take Every Trade Ourselves
Gold Fans A Dollar Fire
Morris Hubbartt
Weekly Market Update Excerpt
posted Apr 27, 2012
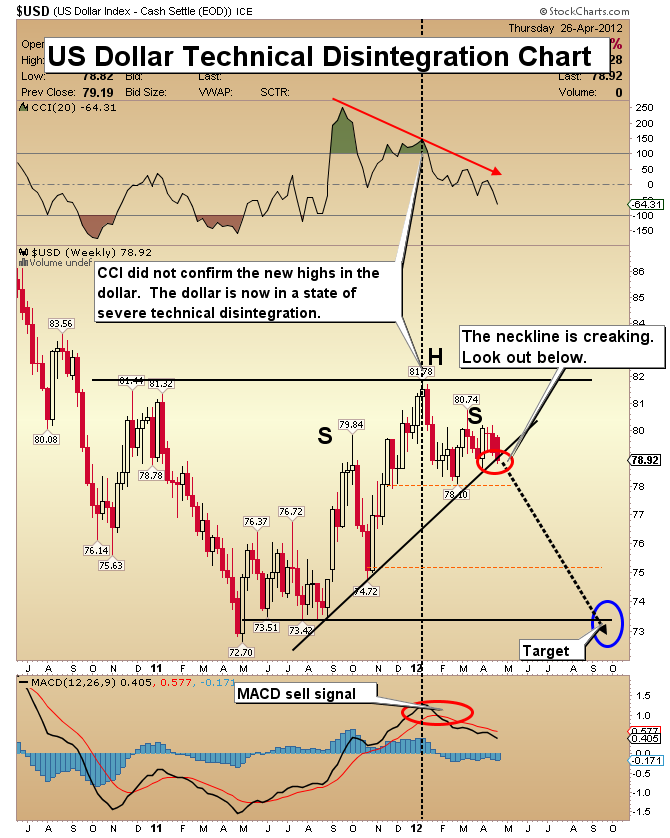
US Dollar Technical Disintegration Chart
- An unconventional battle has started. The Chinese government is taking all the steps necessary for their currency to become a world reserve currency, while America’s government falls behind. China has been very busy, making over 20 bilateral trade agreements to eliminate the dollar from their trading activities.
- They have also begun making credit available to key trading partners in Chinese currency.
- In the last week China continued to work to promote their currency and undermine the US dollar. The Global Times reports that, “China’s banks will be permitted to hold overnight positions in the renminbi/yuan, a move that also allows them to short sell dollars”.
- Technically, the dollar is very close to breaking the neckline noted on the above chart. It broke below it, just slightly, yesterday. If the $USD index falls to 78, I would view that event as final confirmation that a new down leg is underway.
- That event would also likely mark the end of this protracted correction in the gold price.
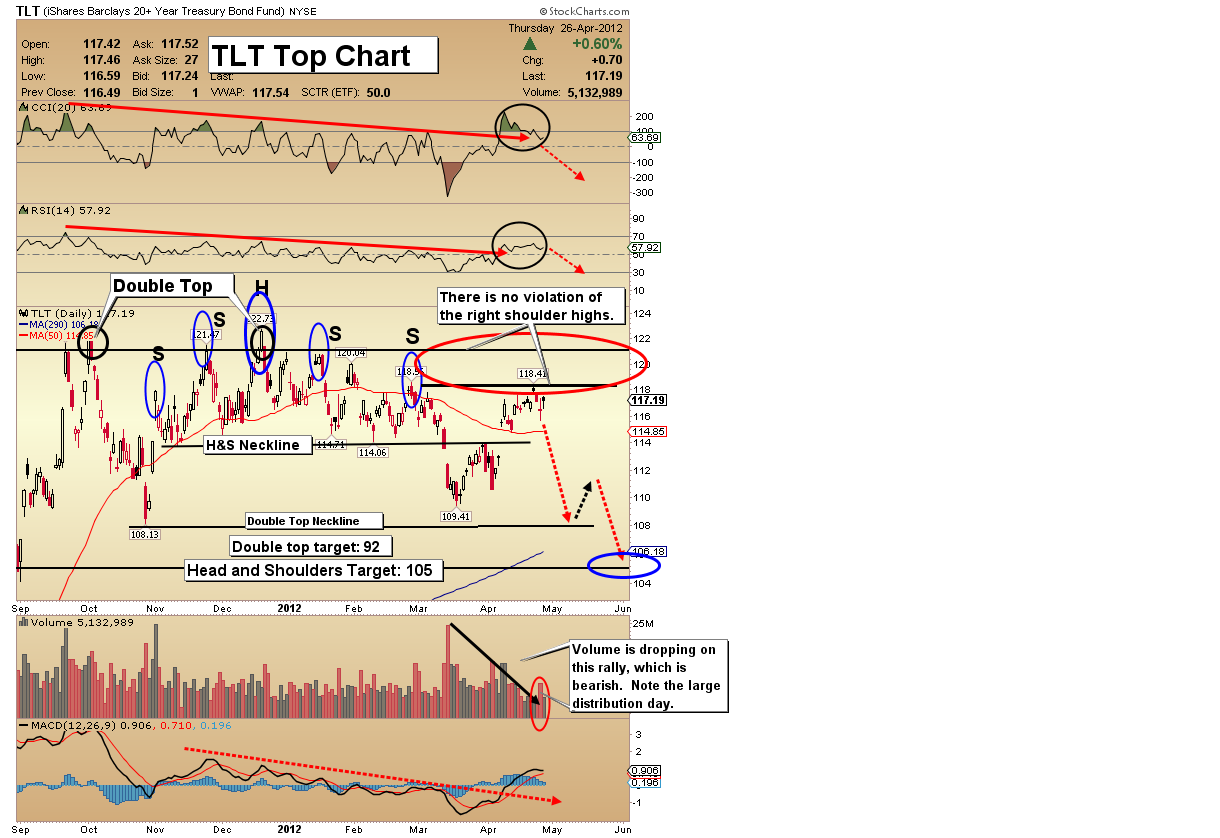
TLT (T-Bond Proxy) Top Chart
- The US bond appears to be forming a major top. After a bull lives for 30 years, it can die a very slow death, but all bulls die. The bond market is nothing more than a debt market.
- There is no way the US government can pay its debts, and that means currency debasement or default are the consequences we must face. Since treasuries have to be held in dollars, they are probably a train wreck waiting to happen for holders of them.
- Note how the volume has declined on this rally. A large distribution day just occurred.
- The CCI indicator is rolling over, and so is MACD. There is a strong possibility of a nasty decline in bond prices.
- As bad as this bond chart looks, the chart of the US dollar looks much worse, implying that a heavy sell-off in the bond would be countered by a devaluation of the dollar.
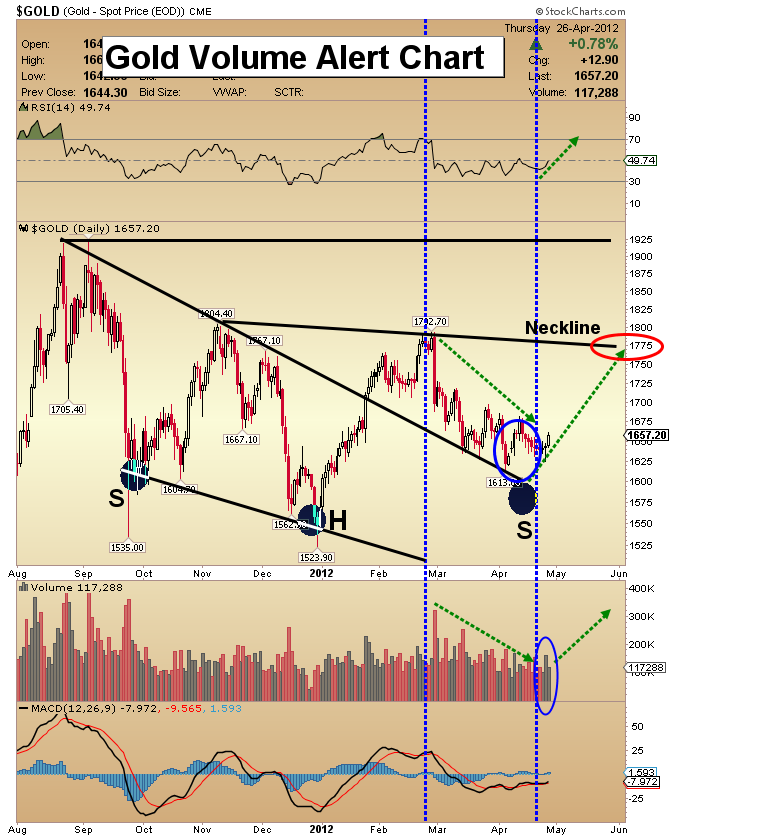
Gold Volume Alert Chart
- Your largest holding should be physical gold. A strong argument can be made that the longer gold takes to break out to new highs the cheaper gold is.
- As long as the debt continues to grow faster than mines can bring new supplies of gold into the picture, gold becomes more valuable. Debt has become a quasi-currency. Measured against the quasi-currency of debt, gold is priced far too low.
- I continue to expect gold to hold its recent lows and begin a move up to $1850. From there, look for a rest before it makes new highs in the fall season.
- On an intermediate term basis, an inverse head and shoulders pattern is targeting prices of $2100 and higher. Note the superb volume pattern that is in place. As the price declined, volume contracted. Now it it expanding as the price rises.
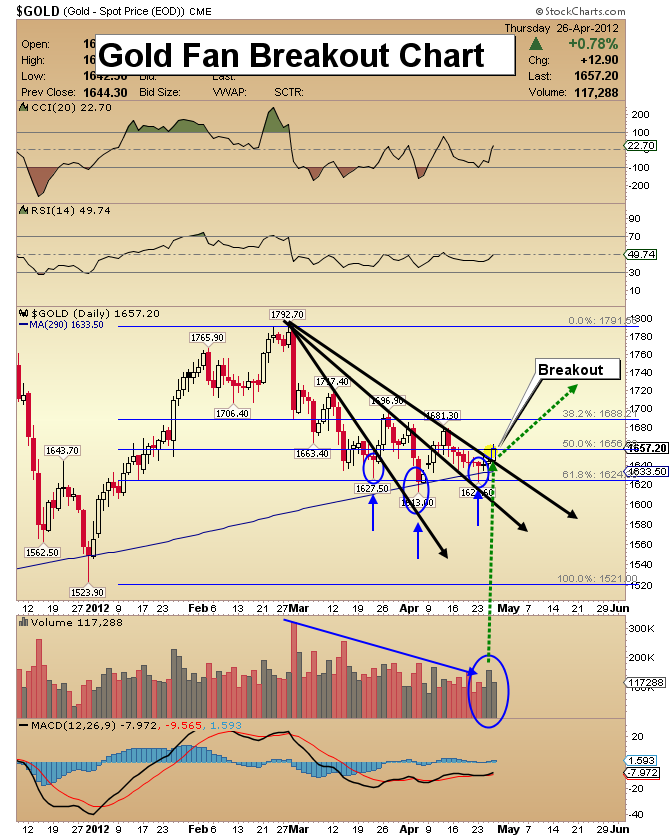
Gold Fan Breakout Chart
- The current leg of the gold correction has been held in check by the 61.8% Fibonacci retracement line.
- Note the textbook-like fan pattern that is in place. Yesterday the price of gold rose above the 3rd fan line. From a standpoint of technical analysis, this is a very positive event for gold. Is this the fan that accelerates a fire in the dollar?
- Note the excellent volume that accompanied the move through the 3rd fan line.
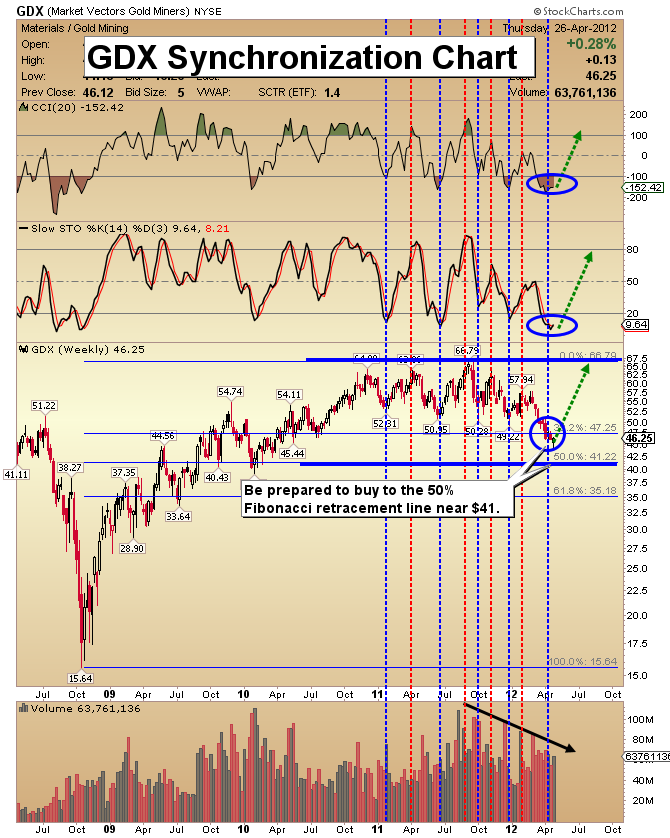
GDX Synchronization Chart
- I see the next leg up in gold as being the rally that shows sleeping analysts the value of gold stocks.
- The technical indicators look even better this week than they did last week. Volume and oscillators are synchronized, and indicating we are poised for a powerful move to the upside.
- Earlier this month I did a series of videos for subscribers touching on the possibility of GDX making a quick washout type move to the $41 area. My statement was that if such an event takes place, it is not a place to sell. It’s a price to buy additional shares.
- I’m continuing to monitor this market for such a possibility, yet all my indicators are saying the next major move coming is not to the downside but to the upside.
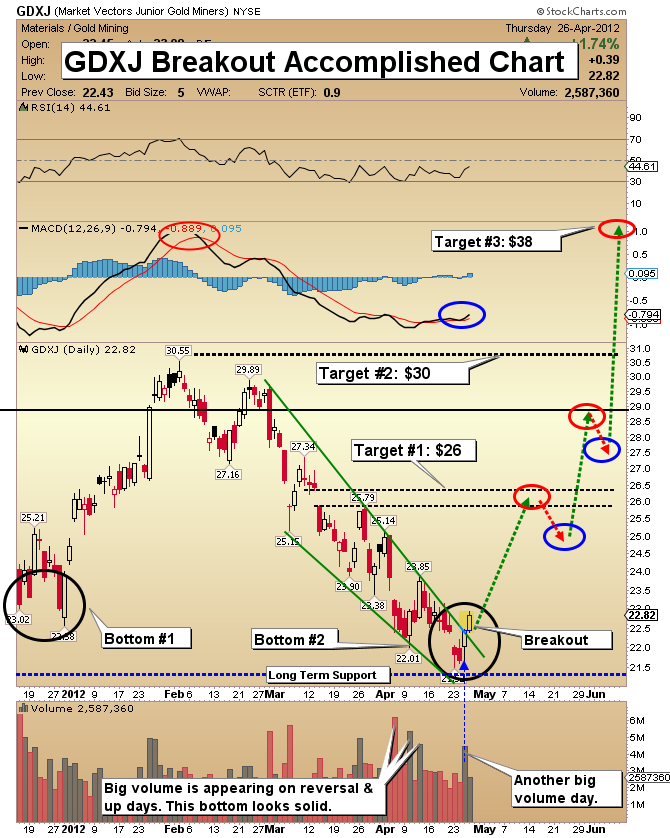
GDXJ Breakout Alert Chart
- This picture speaks a thousand bullish words. A bullish wedge pattern with a big-volume breakout is in place.
- I expect junior gold stocks to outperform all other sectors of the precious metals market for the rest of this year.
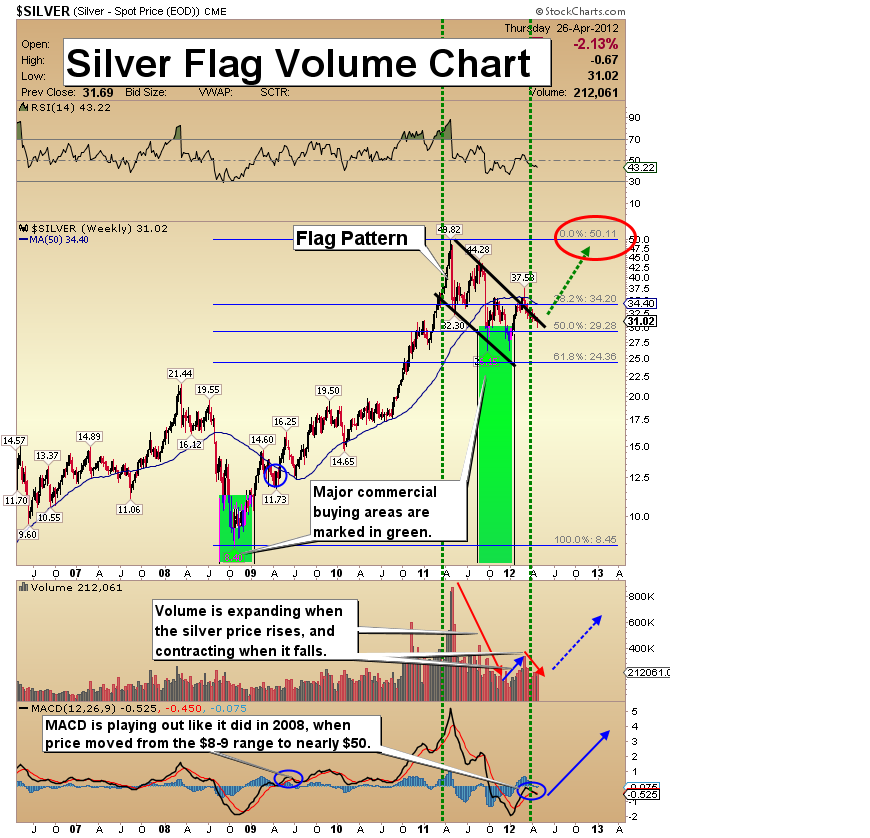
Silver Flag Volume Chart
- The most outstanding feature of the silver market is probably the growth in the commercial traders’ long position, but the volume pattern on the weekly silver chart is almost as bullish.
- Investors should focus on owning physical silver, due to inherent volatility in the price.
- Note the beautiful volume pattern in place within the flag pattern on this chart. The most recent decline saw volume taper off, and the most recent rally saw volume expand nicely. I believe that silver is headed to new highs before 2012 ends, but even if it doesn’t quite make it, I think you’ll be very satisfied with the price of silver at Christmas time!
Friday, Jul 3, 2026 Super Force Signals Unique Introduction For 321Gold Readers:
Send me an email to admin@supergoldsignals.com and I’ll send you my free “Inflation Thunder Now!” gold and silver stocks video report. I’ll also include 3 of my next Super Force Surge Signals free of charge, as I send them to paid subscribers. Thank you!
|
Stay alert for our Super Gold alerts, sent by email to subscribers,
for both the daily charts on Super Force Signals at www.supergoldsignals.com and for the 60 minute
charts at www.supergoldsignals.com
About Super
Gold Signals:
Our Surge Gold Signals are created thru our proprietary blend
of the highest quality technical analysis and many years of successful
business building. We are two business owners with excellent synergy.
We understand risk and reward. Our subscribers are generally successfully
business owners, people like yourself with speculative funds,
looking for serious management of your risk and reward in the
market.
Frank Johnson:
Executive Editor, Macro Risk Manager.
Morris Hubbartt: Chief Market Analyst, Trading Risk Specialist.
website: www.supergoldsignals.com
email:
admin@supergoldsignals.com
email: admin@supergold60.com
Mail:
1276 Lakeview Drive
Oakville, Ontario, L6H 2M8
Canada
###
Apr 27, 2012
Morris Hubbartt
321gold
Ltd

|
