Super Force Signals - A Leading
Market Timing Service
We Take Every Trade Ourselves
Attic Trap Doors and Long-Tailed Candles
Morris Hubbartt
Weekly Market Update Excerpt
posted Apr 22, 2011
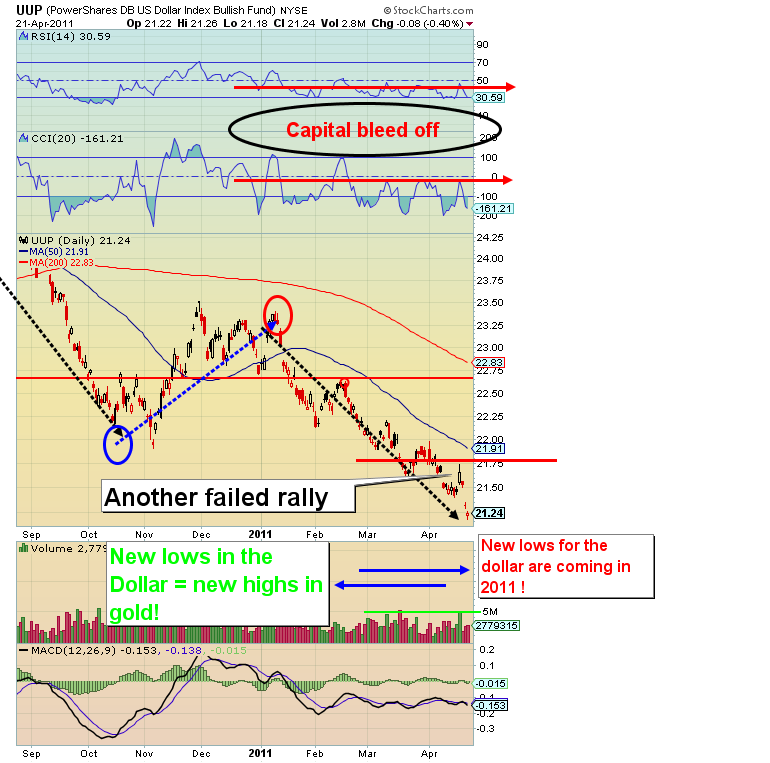
UUP (US Dollar Proxy)
- On Monday Standard & Poor's downgraded the outlook for our nation to negative. The chart below indicates that perhaps a name change for our nation is in order. One of my readers suggests we change it from the United States of America, to the United Credit Cards of America. If the shoe fits, we’re going to have to wear it.
- The S&P warning is too late. Money printing is destroying the purchasing power of the lower and middle class. This dollar proxy chart paints a horrifying picture. The capital bleed on my technical indicators is shocking. Many are flat lining. I marked Wednesday as the latest “dollar rally failure” day. The dollar chart looks like an attic with a dollar sitting on the trap door. That door is very close to dropping wide open.
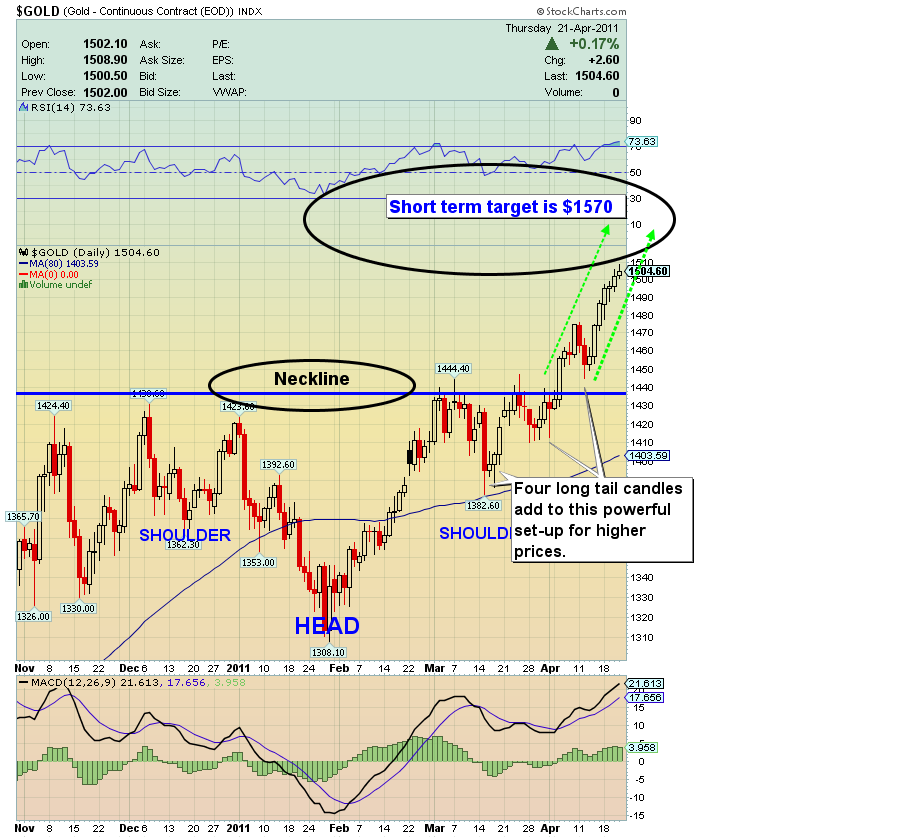
Gold 6 Mth Chart
-
Gold is the barometer of the financial atmosphere. When you see the gold price accelerating as it has recently, this tells you the financial world is not well. The fundamentals are so powerful I expect to see my short term $1570 target acquired within weeks or even days. $1570 is a stepping stone to much higher prices.
- There is now a strong and consistent bid under gold, even after price shoots higher! Besides price, volume is the most important technical indicator for gold, and volume is increasing strongly!
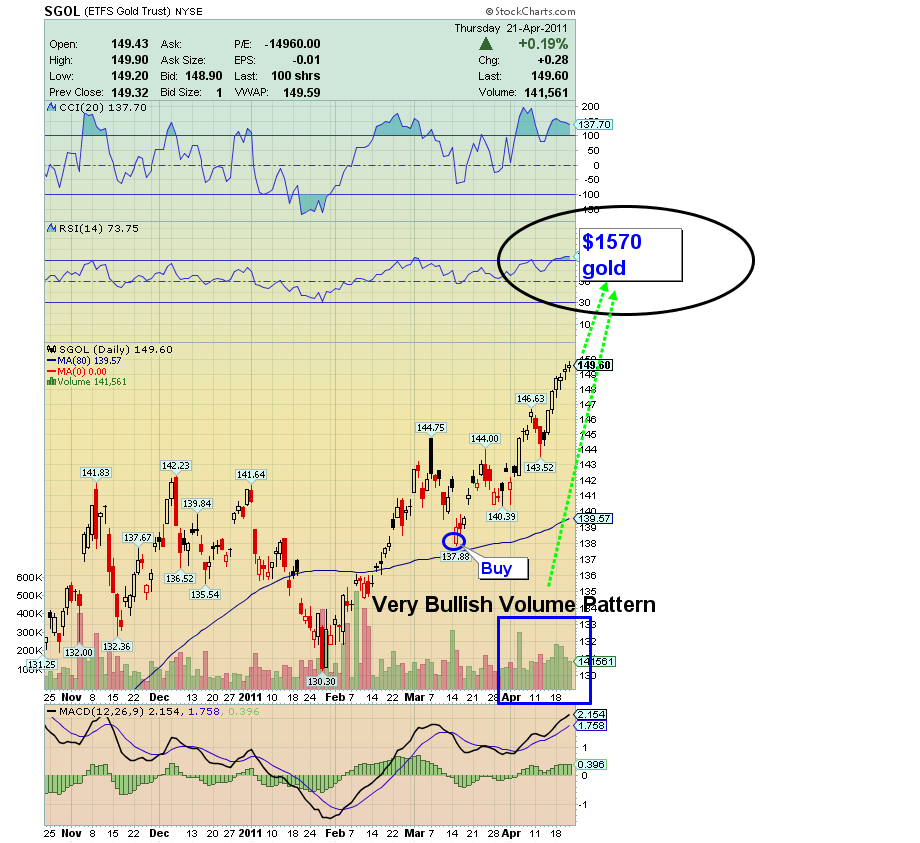
SGOL (gold bullion proxy) 6 Mth Chart
SGOL 6 Month Chart Analysis
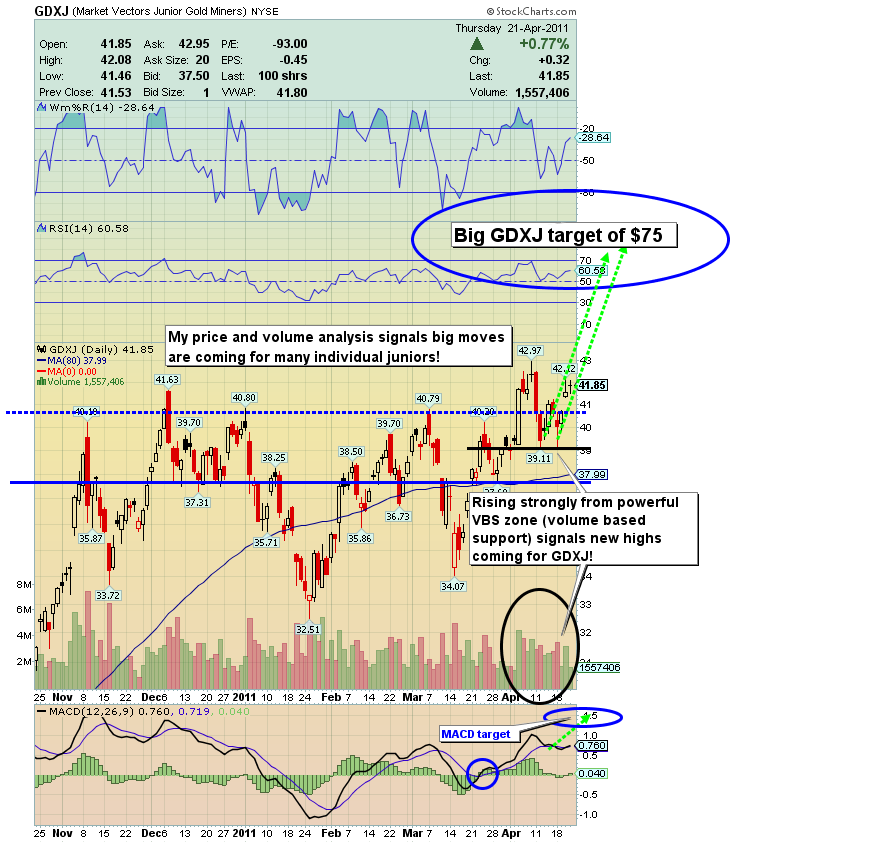
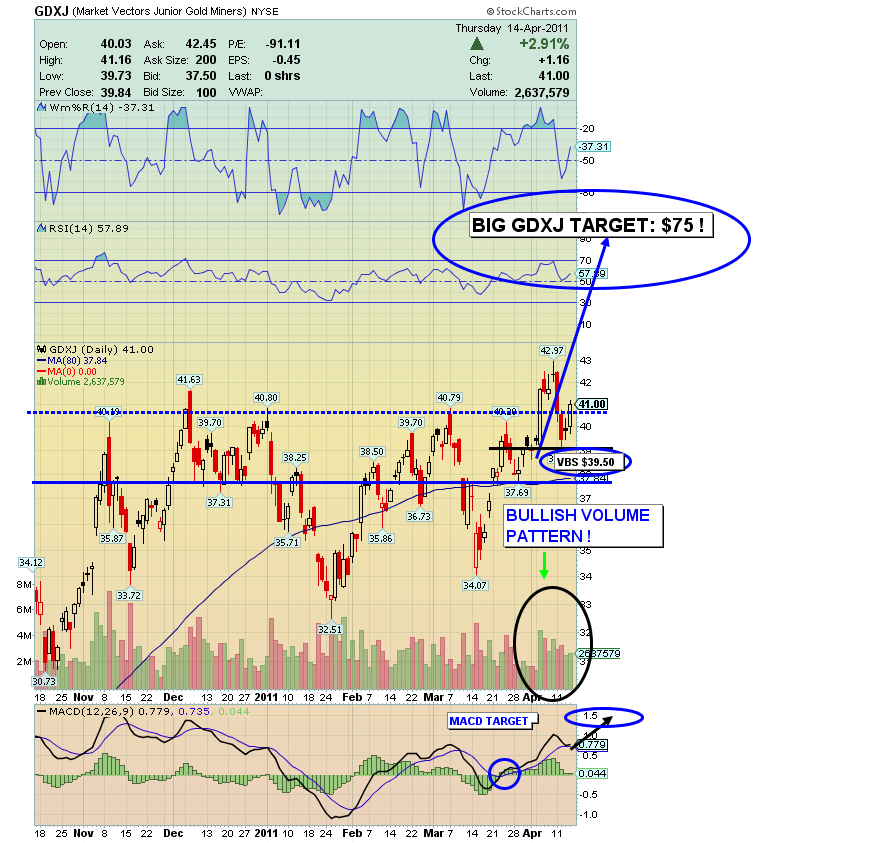
GDXJ gold juniors Chart
GDXJ Chart Analysis:
-
Call yourself a believer. Gold is going much higher. The performance of gold stocks is probably about to stun the gold community with a powerful up move during what is seasonally the worst time of the year. The underlying reality is there is not enough gold. I think junior mining shares are a near “slam dunk”, for the rest of 2011!
-
On Monday price fell hard and then bounced right back. Expect this type of strength and volatility to increase in coming months. Notice where the bounce took place, right on the volume based support (VBS). This move is a volume-powered move, and foretells of new highs coming.
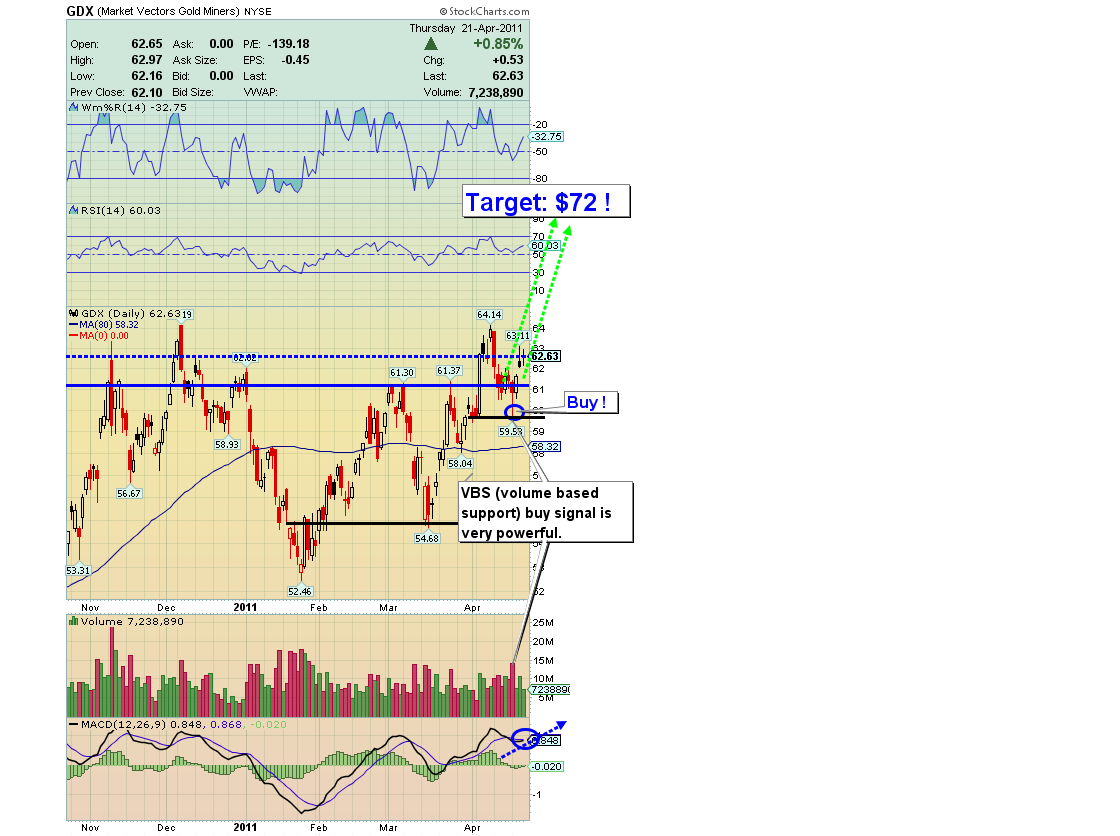
GDX Daily Chart
GDX Chart Analysis
-
Get ready for the greatest short covering rally in decades. It will light your hair on fire, or at least the hair of those who are short gold stocks. John Embry talks about the invisible hand. I think sellers simply overwhelm buyers, and these lower prices are nothing more than a gift to you from them!
-
I stand on the facts; gold stocks are absolutely the greatest bargain on the street. I am accumulating the mining shares, and I issued a new buy was issued on GDX on Monday. Price plunged and closed dramatically higher on the day, a very bullish move.
-
As the sideways grind has continued for over the last six months I have continued to trade these shares with my signals. Volatility has been your friend, not your enemy. That friendship is set to increase!
- I am confident that my GDX target of $72 will be hit. The target is based upon my SFS Gold Stock Ratio. From there I am looking for $80.
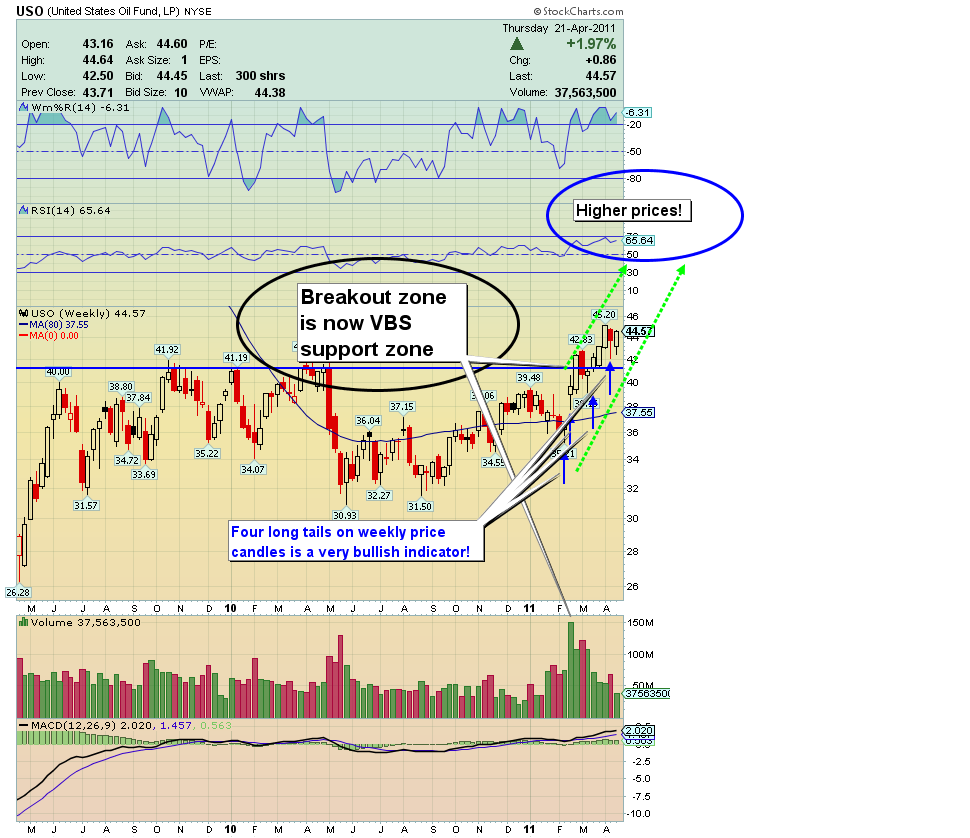
USO (Crude Oil proxy) Chart
Chart Analysis
-
I issued a buy signal on crude oil (via USO) as of Apr.12th at a price of $42.39.
-
Note the price movement through the identified level of support, which was followed by heavy volume.
-
USO is one of my most active trading assets. It can be accumulated for core positions as well, although there is some tracking inefficiency that you need to accept as par for the accumulation course here.
-
The unique event on this chart is the breakout that now serves as VBS (Volume Based Support). Crude Oil’s weekly chart is extremely bullish, and that carries more weight.
-
Also, please note the multiple week price candles with long tails. This is a very bullish intermediate chart pattern.
-
In the case for crude, consider the long term positive fundamentals, the short term buy signals, and the intermediate term positive long tail chart pattern. That puts every time frame in the bull camp!
Friday, Jul 3, 2026 Super Force Signals Unique Introduction For 321Gold Readers:
Send me an email to admin@supergoldsignals.com and I’ll send you my free “Inflation Thunder Now!” gold and silver stocks video report. I’ll also include 3 of my next Super Force Surge Signals free of charge, as I send them to paid subscribers. Thank you!
|
Stay alert for our Super Gold alerts, sent by email to subscribers,
for both the daily charts on Super Force Signals at www.supergoldsignals.com and for the 60 minute
charts at www.supergoldsignals.com
About Super
Gold Signals:
Our Surge Gold Signals are created thru our proprietary blend
of the highest quality technical analysis and many years of successful
business building. We are two business owners with excellent synergy.
We understand risk and reward. Our subscribers are generally successfully
business owners, people like yourself with speculative funds,
looking for serious management of your risk and reward in the
market.
Frank Johnson:
Executive Editor, Macro Risk Manager.
Morris Hubbartt: Chief Market Analyst, Trading Risk Specialist.
website: www.supergoldsignals.com
email:
admin@supergoldsignals.com
email: admin@supergold60.com
Mail:
1276 Lakeview Drive
Oakville, Ontario, L6H 2M8
Canada
###
Apr 22, 2011
Morris Hubbartt
321gold
Ltd
|
