Super Force Signals - A Leading
Market Timing Service
We Take Every Trade Ourselves
Gold Stocks: Bearish Mirage
Morris Hubbartt
Weekly Market Update Excerpt
posted Apr 20, 2012
UUP (US Dollar Proxy) Meltdown Chart
- Money printing is the only tool available to keep the US titanic economy boat afloat. If printing stops, the iceberg is revealed and the ship sinks. This tool may keep the “economy” afloat, if you call frequent transactions with a deteriorating dollar an “economy”.
- Does the velocity of monopoly money really mean anything? The US dollar is being diluted to keep the US economy from sinking, and we are only in the early stages of “The Great Dilution”.
- Just when the consensus on Wall Street is for no more QE, the Federal Reserve members speak. William Dudley, president of the New York Federal Reserve Bank, has assured investors that the Fed would be on call for more QE if the economy starts to decline.
- Dudley said that “the incoming data on the U.S. economy generally has been a bit more upbeat over the past few months”, but added that it is, “still too soon to conclude that we are out of the woods”.
- His assessment is in sync with that of Fed member Janet Yellen. She says that keeping interest rates near zero through 2014 is necessary.
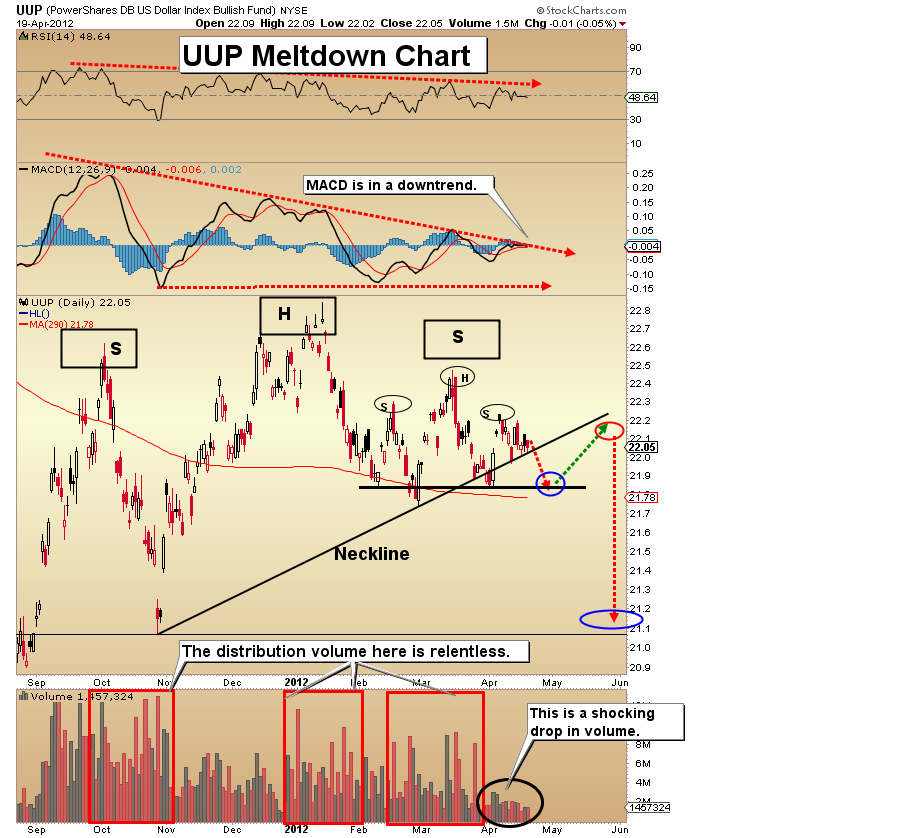
- I have included two key charts of the dollar this week. The first is the “meltdown chart”, which highlights a powerful head and shoulders top pattern on the UUP daily chart.
- This pattern is accompanied by massive distribution volume. It projects an approaching period of new lows and rapid decline for the dollar.
- It is very common for volume to fade off when a head and shoulder top is nearly completed, and you can see that is the case here.
US Dollar Giant Top Chart
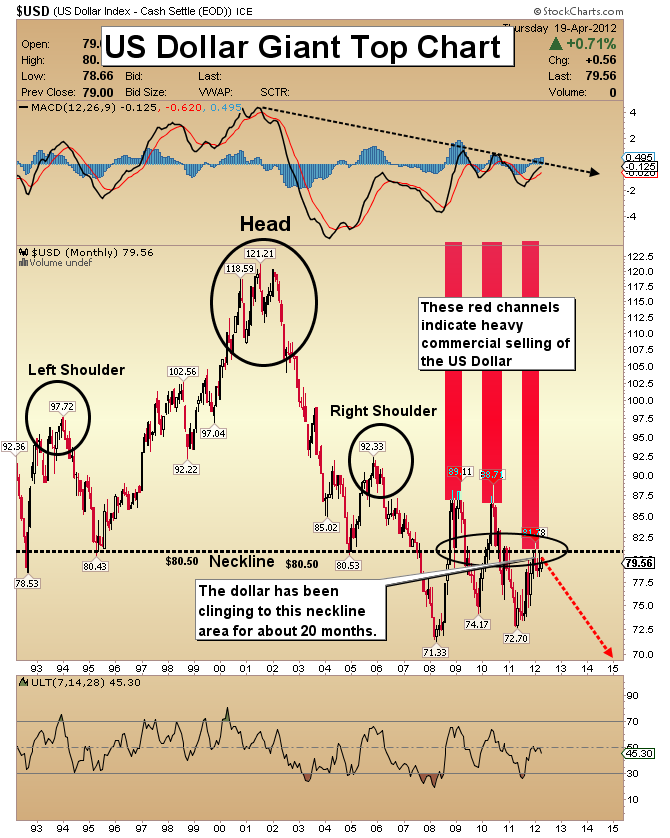
- I’ve also included the monthly head and shoulders top chart, which is possibly the most bearish pattern that I’ve ever seen on a major market monthly chart.
- This chart painted is painted by an artist who loves debt. Both of these dollar charts forecast a bleak future for a nation with debts that are beyond repayment.
- Default is coming, but it will be given the more politically correct term, “currency dilution”.
- The dollar is clearly in a long term bear market and that is very beneficial for owners of physical gold, silver, and precious metal equities.
Gold 2012 Roadmap Chart
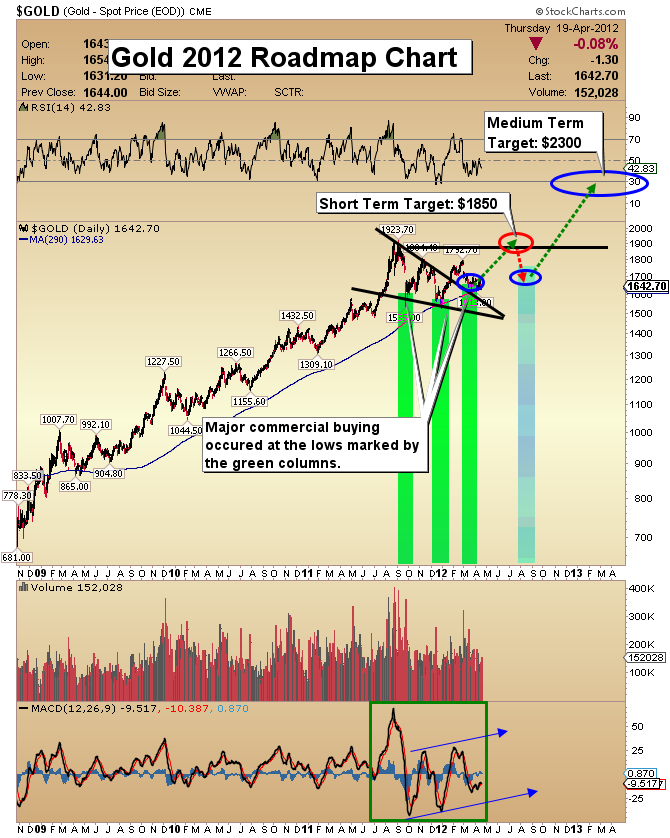
- If the recent low of $1613 is violated, I think the gold price will likely hold very close to $1600. As negative as the mood is amongst gold investors, the bull is not dead and buried.
- This chart shows that gold is in good health. After the major move the metal took last year, we have not made new highs, yet my work suggests we remain on target to do so in 2012.
- The main driver of future strength will be commercial traders, and their actions are highlighted in the weekly COT report.
- The smart money traders have continued to put serious money to work while smaller investors have pulled back, and that historically precedes major moves in the precious metals. The physical gold market is incredibly tight.
- The mood is very negative. Keep the faith. My work forecasts gold will rise to $2100 and $2300, with both targets acquired during 2012. From there, I see $2800 being acquired by March of 2013.
GDX Synchronization Chart
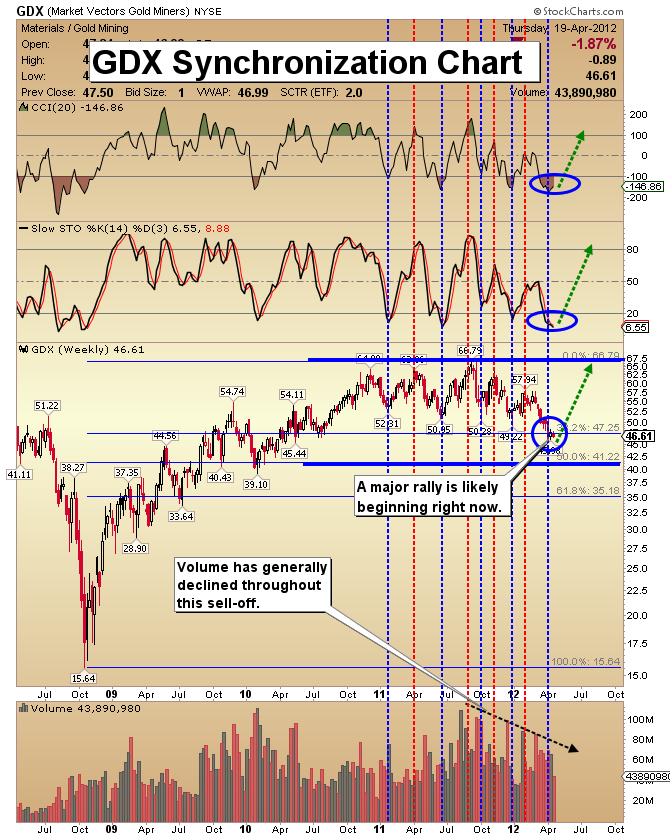
- In this chart I am highlighting the movement of GDX and the movement of the “slow stokes” (slow Stochastics) and the CCI indicators.
- Note how well their movement is synchronized with the movement of the GDX price.
- The bears will argue that there is a top pattern in place, and the price has broken down from that top. That’s possible, but my experience is that when there is a battle of sentiment and oversold indicators going on against a chart pattern, it is the sentiment and indicators that emerge victorious.
- This is another reason that I believe a turn higher in gold stocks is imminent. I’d go so far as to say that the supposed top on gold stocks is purely a mirage.
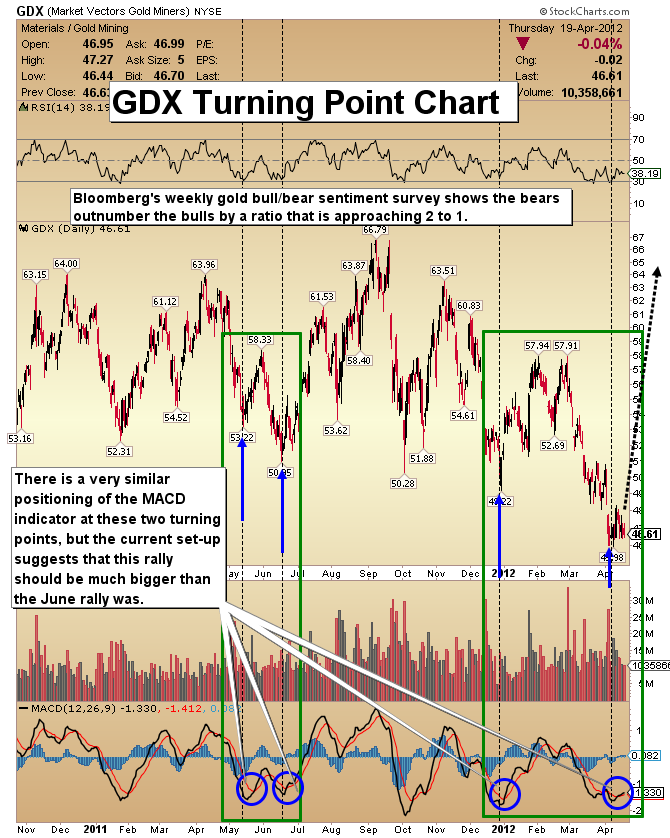
GDX Turning Point Chart
- In June of 2011, GDX rose from about $51 to above $66, which is a gain of about 30%. I think that GDX is held by such incredibly strong hands now that the coming rally could be even bigger than that one.
- I’d like to you to look carefully at the MACD indicator. Each low in the price of GDX has not been confirmed by a new low by MACD.
- I believe you are witnessing a very large technical non-confirmation taking place, with powerful ramifications for the upside potential of GDX.
Gold Sentiment Charts
- Please click this link to view Bloomberg's weekly gold bull & bear sentiment survey. The bears now outnumber the bulls.
- Please click this link to view the Rydex charts, courtesy of www.sentimentrader.com. From a contrary opinion standpoint, there has not been a time in the last six years when gold stocks are as bullish as they are today.
- Wall street analysts continue to assume that gold priced in the $1650 area cannot be sustained. So, their assumption is that gold stocks are overpriced. I think their assumption is wrong.
- The gold stock sector looks very close to a turning point, but investors must remain vigilant for a possible quick move lower, literally a final shakeout. If that happens, hold your positions and buy more if you can.
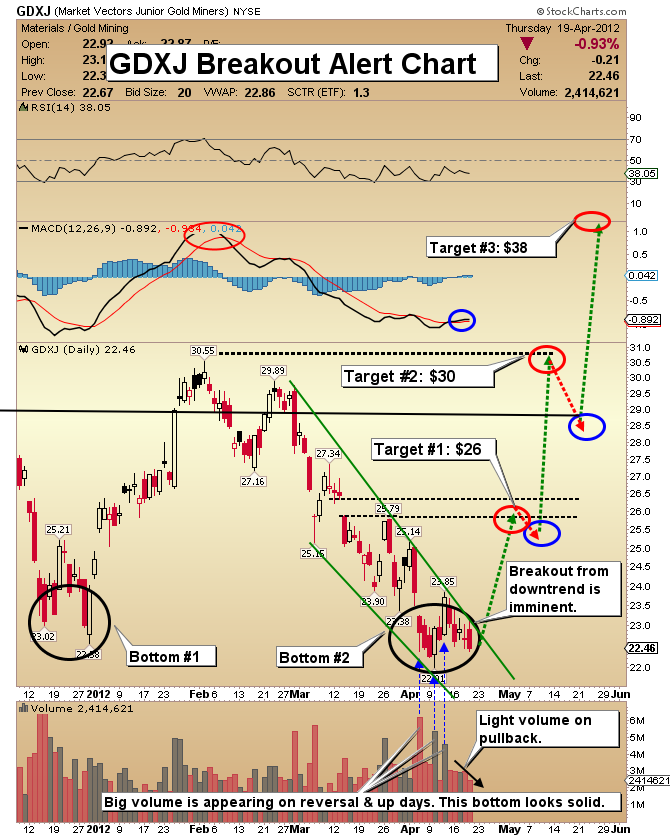
GDXJ Breakout Alert Chart
- The gold juniors stocks are quietly starting to perform better than the gold seniors, and I consider that to be very good news.
- When taking a close look at the recent bottom, the up volume has started to dominate the trade.
- I believe the final confirmation will be a much larger move in the GDXJ price, with even more volume.
- The upcoming FOMC meeting on April 25 could be the catalyst that finally unlocks the junior gold sector from the jaws of the bear.
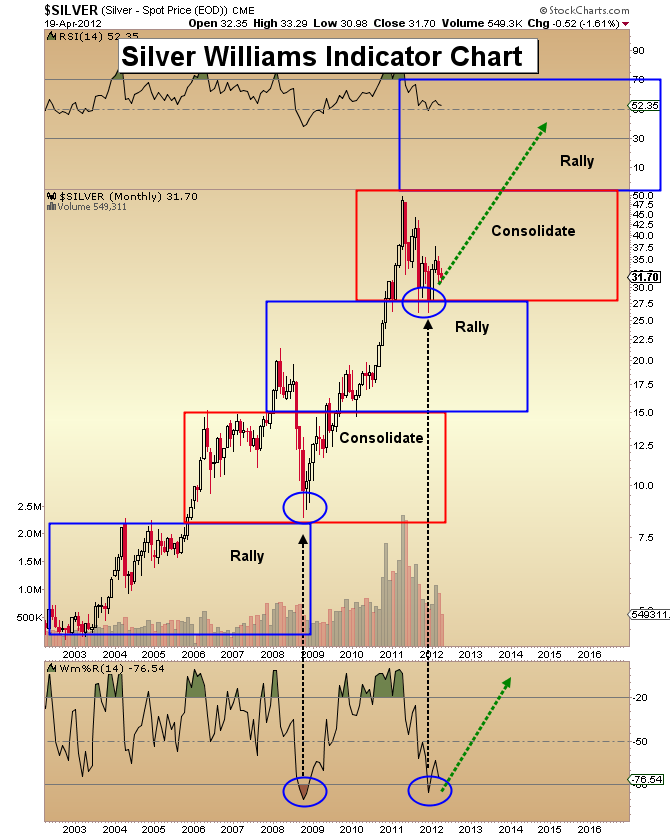
Silver Williams Indicator Chart
- For the past week or so, we’ve seen silver rise a number of times during the day, while gold just sits there. I believe this is the beginning of a trend.
- If silver starts to seriously outperform gold, it is very healthy sign for the entire precious metals sector.
- As with GDXJ, there is a possibility of a final shakeout, but investors need to hold their ground if that happens. The best way to hold your ground during a final shakeout is to own the physical product.
- Gold is much less volatile than silver, so I’m comfortable with recommending exchange-traded gold funds to compliment a physical gold core holding.
- Note the position of the Williams indicator on the enclosed chart. After creating an even sharper spike at the bottom than the one in 2008, the Williams indicator has held that low and is beginning to rise.
- Most silver investors should focus on owning physical metal because its price is so volatile. That has been, and will continue to be, the best way to make money in this mighty metal!
Friday, Jun 19, 2026 Super Force Signals Unique Introduction For 321Gold Readers:
Send me an email to admin@supergoldsignals.com and I’ll send you my free “Inflation Thunder Now!” gold and silver stocks video report. I’ll also include 3 of my next Super Force Surge Signals free of charge, as I send them to paid subscribers. Thank you!
|
Stay alert for our Super Gold alerts, sent by email to subscribers,
for both the daily charts on Super Force Signals at www.supergoldsignals.com and for the 60 minute
charts at www.supergoldsignals.com
About Super
Gold Signals:
Our Surge Gold Signals are created thru our proprietary blend
of the highest quality technical analysis and many years of successful
business building. We are two business owners with excellent synergy.
We understand risk and reward. Our subscribers are generally successfully
business owners, people like yourself with speculative funds,
looking for serious management of your risk and reward in the
market.
Frank Johnson:
Executive Editor, Macro Risk Manager.
Morris Hubbartt: Chief Market Analyst, Trading Risk Specialist.
website: www.supergoldsignals.com
email:
admin@supergoldsignals.com
email: admin@supergold60.com
Mail:
1276 Lakeview Drive
Oakville, Ontario, L6H 2M8
Canada
###
Apr 20, 2012
Morris Hubbartt
321gold
Ltd

|
