Super Force Signals - A Leading Market Timing Service
We Take Every Trade Ourselves
Gold Is Down But Not Out Morris Hubbartt
Weekly Market Update Excerpt
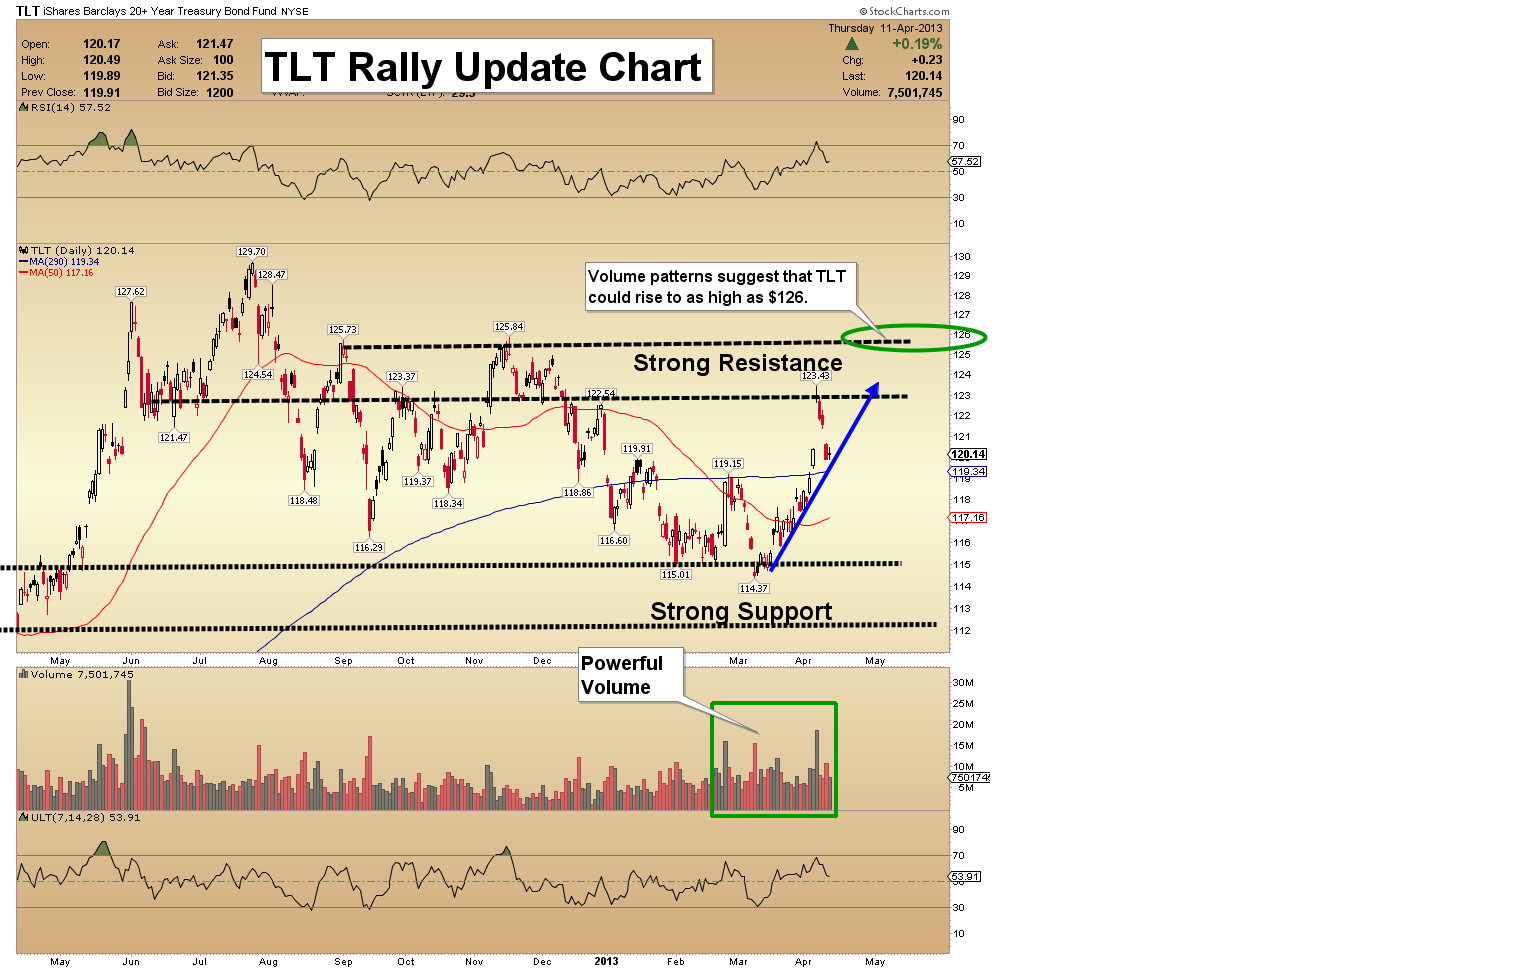
posted Apr 12, 2013 TLT (T-Bond Proxy) Rally Update Chart - The rally in the US T-Bond that I used for a quick trade to the upside, was completed last Friday. The release of weak employment data stunned most market participants. Mainstream economists had expected the report to show between 180,000 to 200,000 new jobs to have been created last month. That didn’t happen. The Labor Department reported that employment increased by just 88,000 jobs nationwide.
- Technically, TLT looks likely to rally a bit further. I think it could go as high as $126, due to the solid volume.
- From a longer term perspective, I would avoid the US bond market, due to “out of control” debt, and ridiculously low yields.
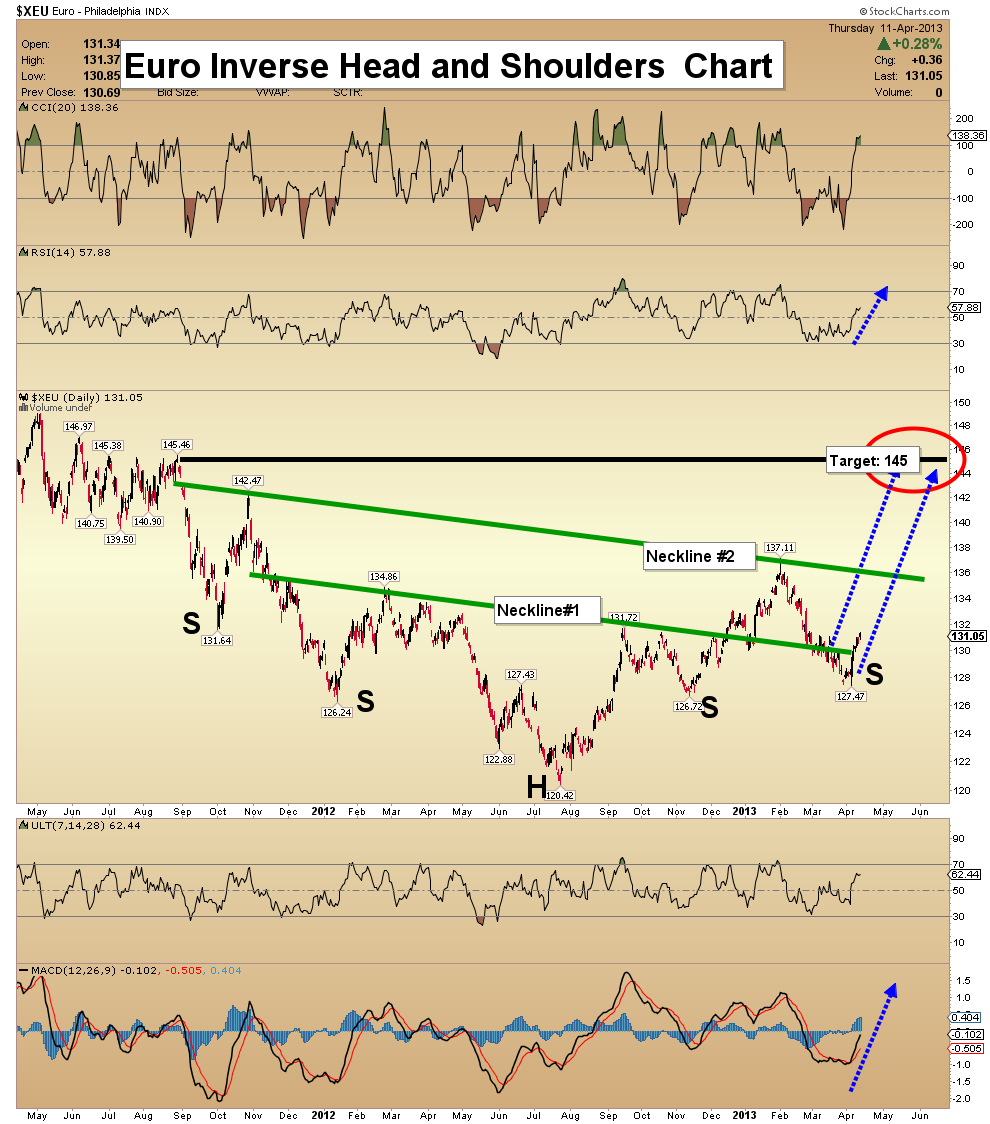
Euro Inverse Head & Shoulders Chart - The headlines over the last many weeks have been anything but encouraging for euro fans, yet there may be an enormous bottom pattern in play on this chart.
- One of the most dependable technical patterns is the head & shoulders formation. For this pattern to be confirmed the Euro will need to close above 136.
- There are four shoulders on this pattern; two on the left side, and two on the right. Complex patterns like this tend to be much stronger than patterns with just two shoulders.
- I’ve put a target at 145 on this chart, but using the 2nd neckline, it could be argued that the target is closer to 154. That should provide some relief to investors in the gold market, because a euro rally is bad news for the dollar. Bad news for the dollar is good news for gold!
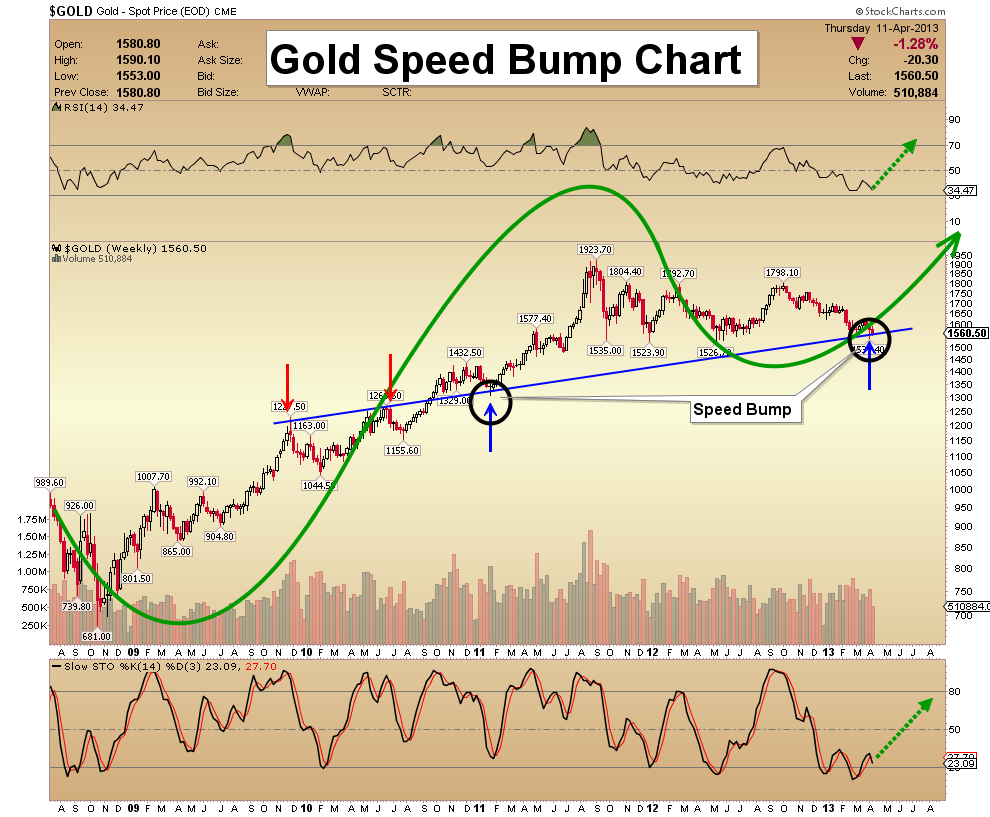
Gold Speed Bump Chart - Gold has not traded above $1900 for nearly two years, and most investors are wondering if the bull market is beginning a bigger correction.
- My gold cycle analysis suggests that gold is testing the blue support line that extends back to the year 2009.
- If you look carefully at the chart, you can see that the gold price is slightly below that support line now, which is creating technical selling by hedge funds. I call that the “speed bump”, and it’s happened before, in early 2011. I’ve highlighted that period on this chart.
- Every gold investor wants a rally now, but this technical speed bump could easily cause gold to decline to $1400 or $1350, before the bigger bull cycle “overpowers” the technicals. I’m not selling any gold here, and if the price goes any lower, I will buy a bit more.
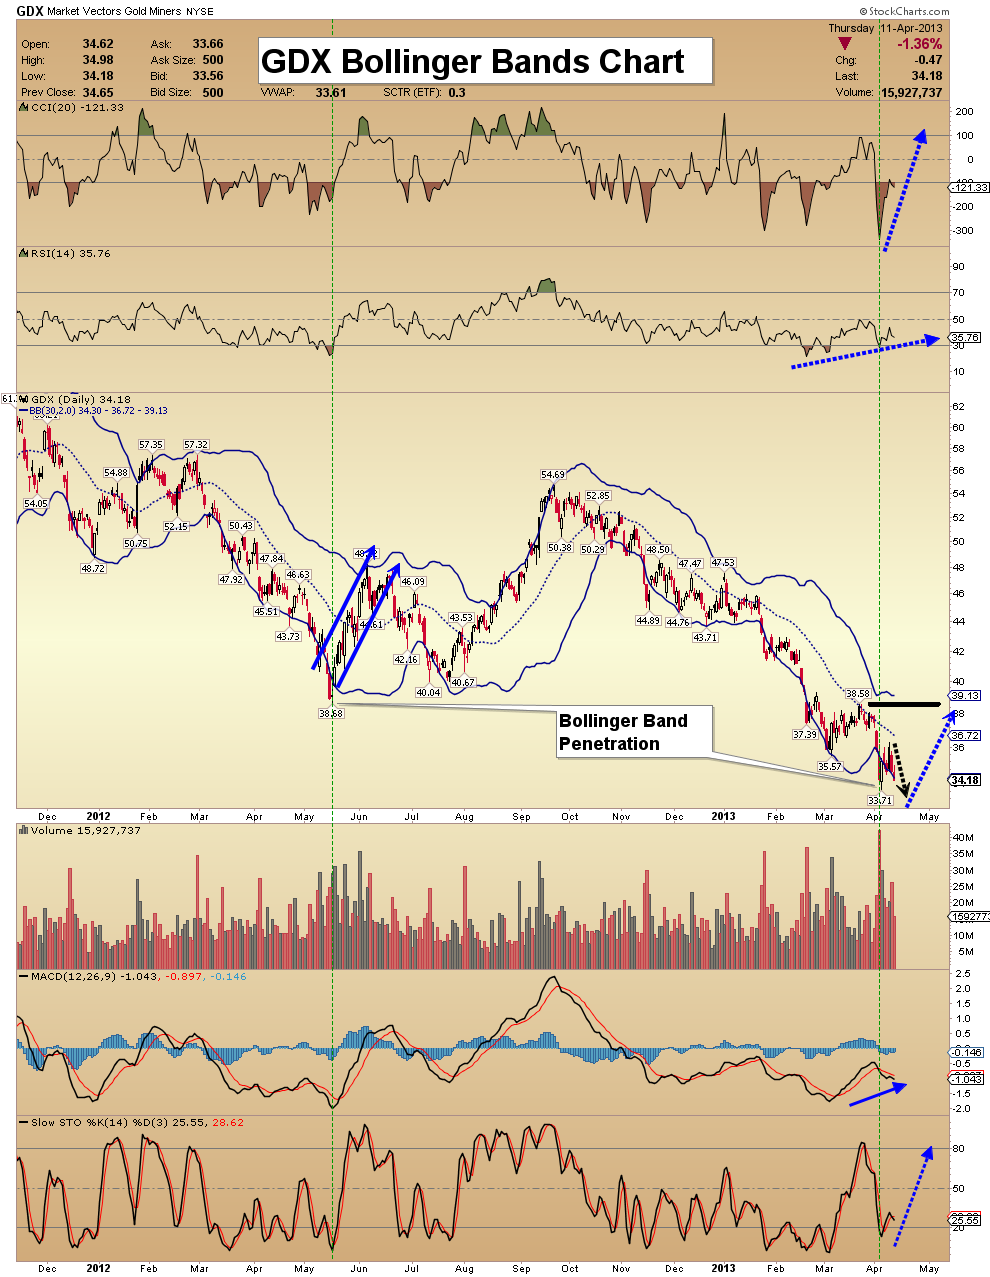
GDX Bollinger Bands Chart - Last May, gold stocks plunged though the lower Bollinger band on this chart, and quickly moved back inside the band. This type of trading normally represents exhaustion in selling.
- Panic volume is present, and key oscillators are offering strong positive divergences, indicating a rally is coming. Unfortunately, waves of hedge fund liquidation are continuing, almost on an hourly basis.
- My strategy is to cut the size of my buying, but not end it. My suggestion to investors is basically, just hunker down until this storm passes. All storms end, and this one will, too!
GDXJ Positive Divergence Chart - GDXJ is showing a strong positive divergence; the RSI indicator is moving higher, while the price of GDXJ declines. The overall technical action, although very disappointing, is quite similar to the July lows.
- The volume patterns are suggesting that a full washout is taking place, right now. A few months ago, some hedge fund managers said they were selling their GDX positions, but not GDXJ.
- These funds use a lot of leverage, and it’s likely that the banks that act as prime brokers for these funds are forcing them to liquidate their junior stock holdings. In the short term, that’s terrible news. In the long term, it is better that the stocks are held by more stable entities.
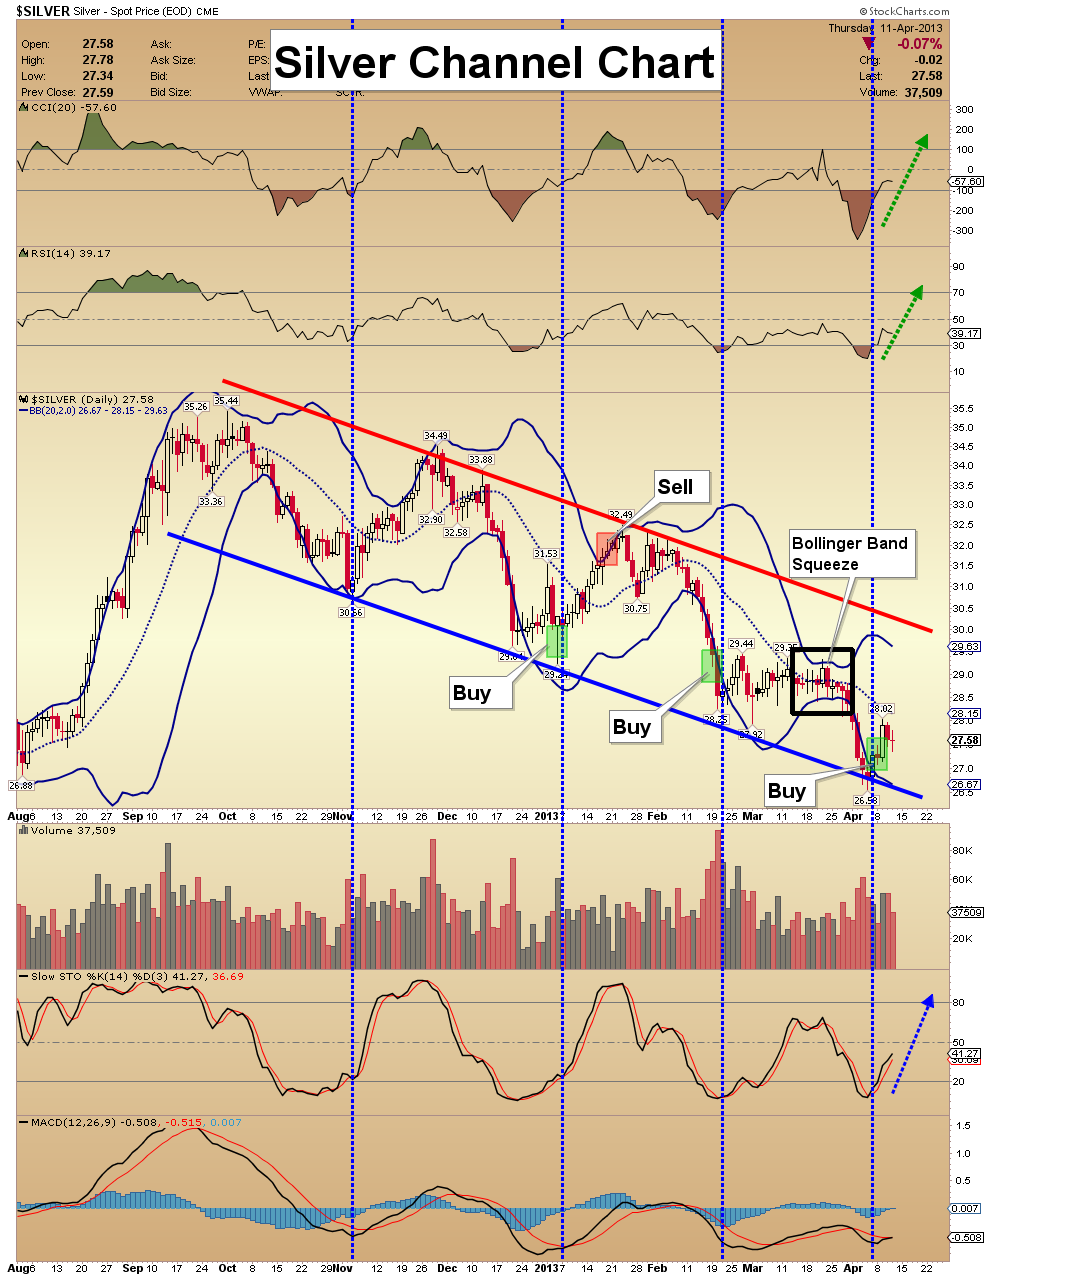
Silver Chart - Two weeks ago I said caution was needed, in the silver market. Most technicians thought the tightening of the Bollinger band meant silver was ready for a rally.
- I suggested that the tightening meant it was ready to begin a trending move, and downside was just as possible as upside.
- For silver accumulators, the severe Bollinger band penetration offered a decent entry point, and I acted on that myself.
- Shorter term traders should be aware that a penetration like this is sometimes followed by a rally, but sometimes it is followed by a fresh decline. I still have a caution flag in play for silver, but it is doing a great job of holding the recent lows, while gold has almost broke through them!
Friday, Jul 3, 2026 Super Force Signals Unique Introduction For 321Gold Readers:
Send me an email to admin@supergoldsignals.com and I’ll send you my free “Inflation Thunder Now!” gold and silver stocks video report. I’ll also include 3 of my next Super Force Surge Signals free of charge, as I send them to paid subscribers. Thank you!
|
Stay alert for our Super Gold alerts, sent by email to subscribers,
for both the daily charts on Super Force Signals at www.supergoldsignals.com and for the 60 minute
charts at www.supergoldsignals.com
About Super
Gold Signals:
Our Surge Gold Signals are created thru our proprietary blend
of the highest quality technical analysis and many years of successful
business building. We are two business owners with excellent synergy.
We understand risk and reward. Our subscribers are generally successfully
business owners, people like yourself with speculative funds,
looking for serious management of your risk and reward in the
market.
Frank Johnson:
Executive Editor, Macro Risk Manager.
Morris Hubbartt: Chief Market Analyst, Trading Risk Specialist.
website: www.supergoldsignals.com
email:
admin@supergoldsignals.com
email: admin@supergold60.com
Mail:
1276 Lakeview Drive
Oakville, Ontario, L6H 2M8
Canada
### Apr 12, 2013
Morris Hubbartt
321gold Ltd
 |
