Super Force Signals - A Leading
Market Timing Service
We Take Every Trade Ourselves
Now is not the time to play games...
Morris Hubbartt
Weekly Market Update Excerpt
posted Apr 01, 2011
Gold and Precious Metals
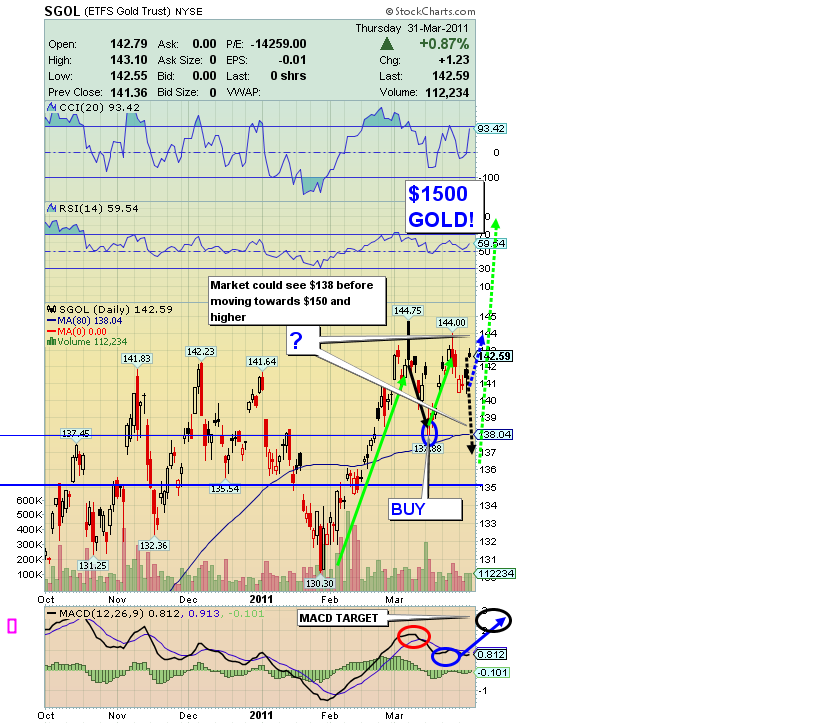
SGOL (Bullion Proxy) 6 Mth Chart
SGOL 6 Month Chart Analysis
-
Look closely at trading signals on my charts today. Use my buy signals to increase your core positions and lower cost, always enlarging your overall position. Strive for real economic security with your gold. If your financial advisor is telling you to sell all your core gold holdings, I hope you are not listening! What is coming down the pipeline, economically, is disaster.
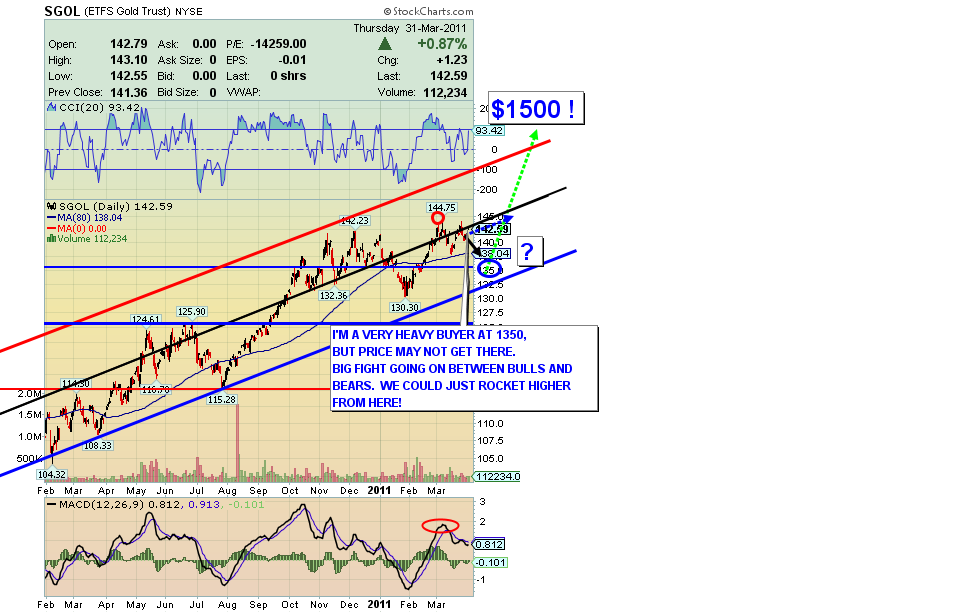
SGOL 14 Mth Chart
-
Black Swan events keep coming. The Middle East, Japan, and food-related events may be in the pipeline. We are at the very cusp of an enormous blast higher in the metals, and it will catch most of the investment world totally off guard.
-
When considering all of the assets one can hold, such as commodities or stocks or cash or gold, which one is the best? Of all assets, physical gold stands tallest. The physical market for gold is in the strongest hands, and they will accumulate all weakness in the market because they sense an economic nightmare is near at hand.
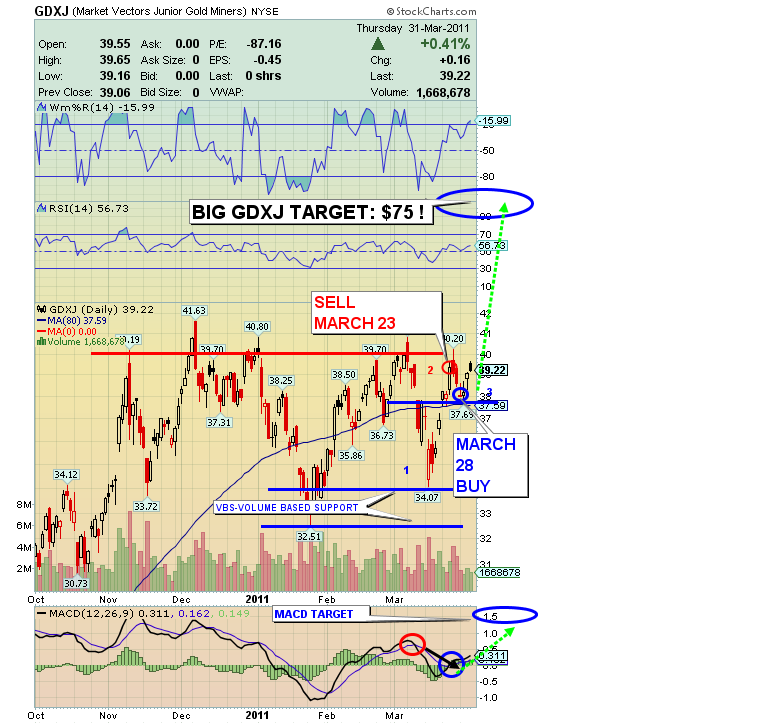
Gold Juniors GDXJ Chart
GDXJ Chart Analysis:
-
With physical gold in the strongest hands, my SFS Gold Stocks Ratio continues to project a huge target of $75.00 for GDXJ! If the target is acquired, many individual juniors would rise by hundreds of percent!
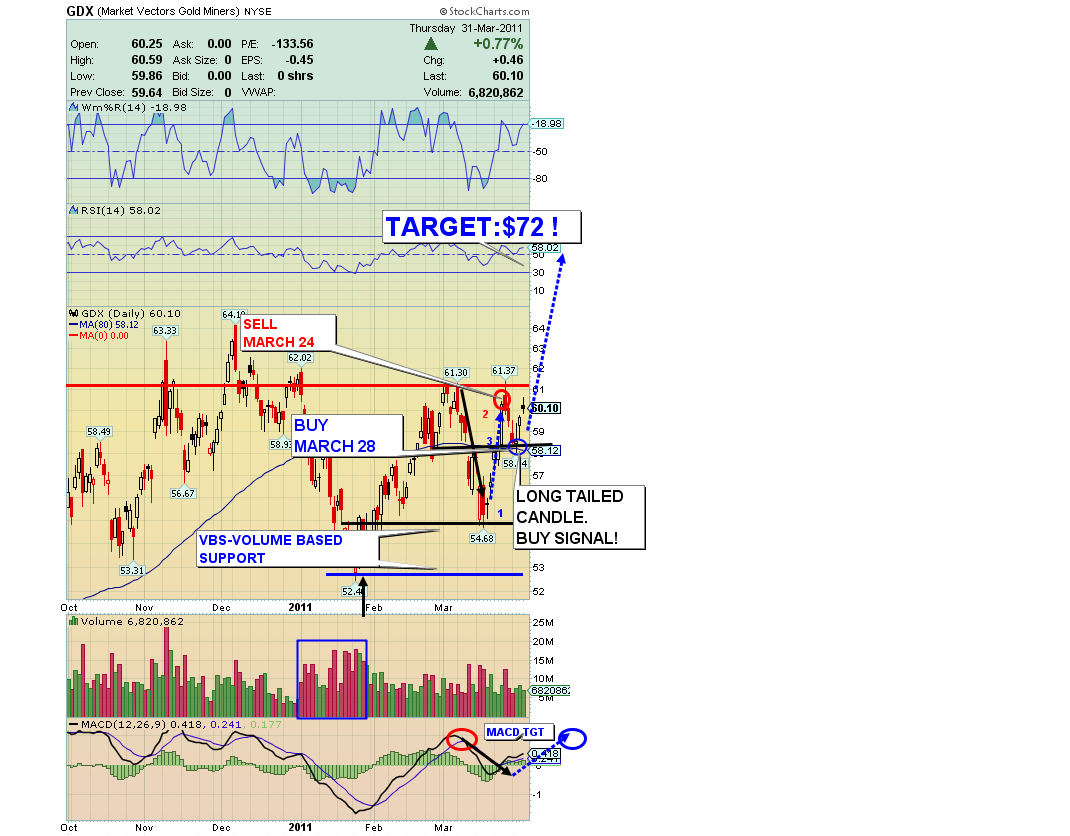
GDX 6 Mth Chart
GDX Chart Analysis:
-
I just issued a fresh buy signal on GDX Mar. 28th. Look at the long tail on the identified candle from Wednesday’s trade. This candle is suggesting more upside for this move. When you get this type of candle configuration, particularly in gold stocks, it can spell higher prices for quite a few more trading sessions. It is a sector-wide phenomenon and very powerful.
-
As bullish as I am, this market could roll over after the current move higher is completed, opening the rocket door for final boarding. In a correction, the GDX $55.00 range is the best opportunity for heavy buys, if we get there. VBS (volume-based support) is sitting in that area for GDX.
SIVR (Silver Proxy) 6 Mth Chart
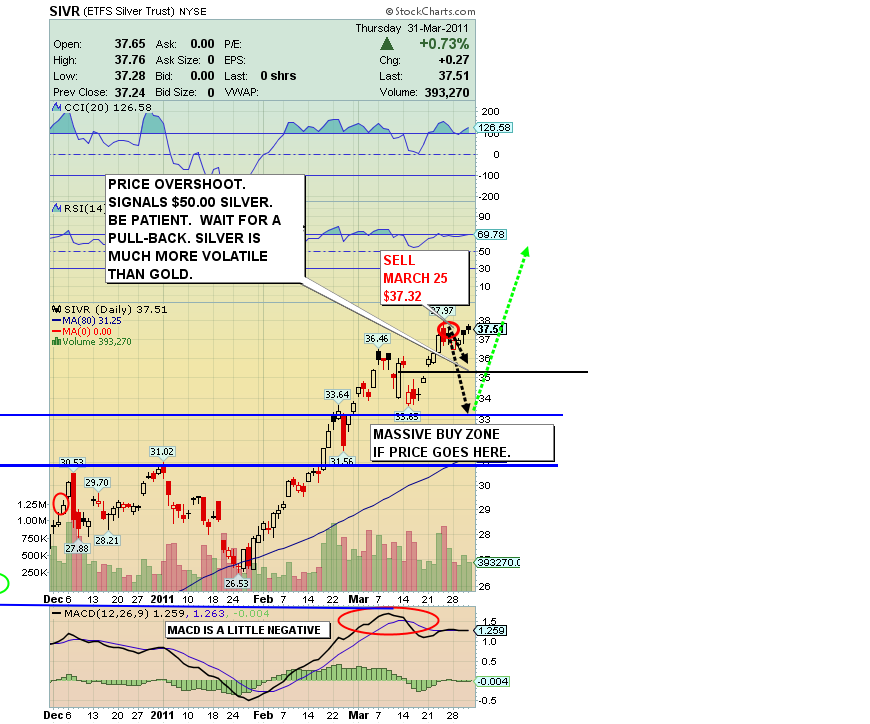
SIVR Chart Analysis
-
I want to urge some caution in the silver market. I am buying small corrections personally, and I think price is going much higher along with gold, but silver is a more volatile market, and more susceptible to being hit if the over-priced general stock market enters a major correction.
-
Incredibly, the very near term scenario for silver calls for even more upside action, followed by a gut-wrenching correction. I worry that investors with little or no silver may not understand how quickly a big downside sell-off can turn the current excitement into tremendous fear.
-
I just issued a profit-taking alert for SIVR at $37.32. Owning the physical product is an absolute necessity. As I send you fresh buy signals in silver, put more money there, in physical silver. Compared to gold, silver is still dramatically underpriced, even after this huge move up in price!
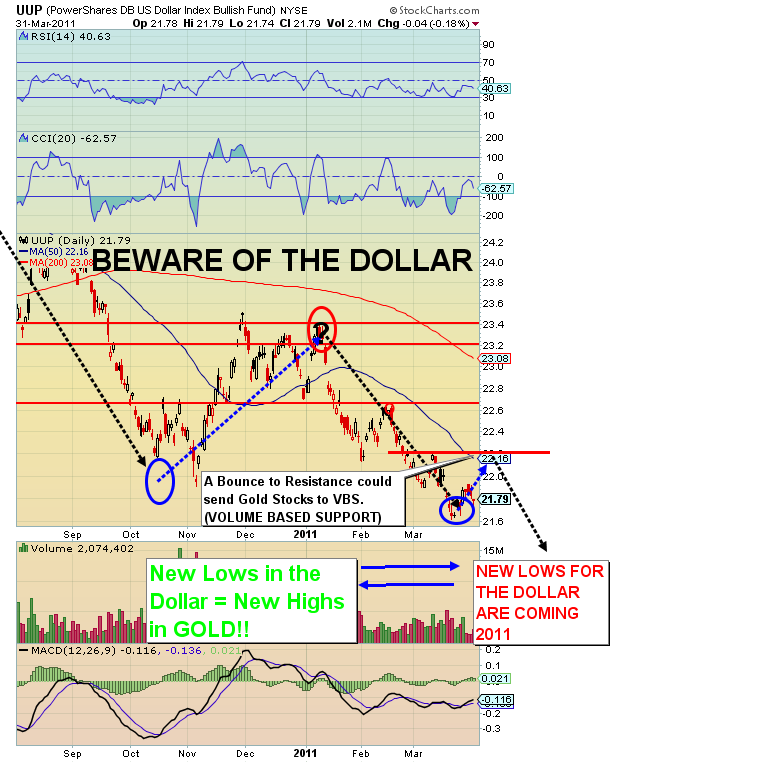
UUP (US Dollar Proxy) Chart
-
The great tell-tale sign for the dollar is the lack of a “safe haven bid”. With all of the current problems in the world I would expect money to flow to the dollar, as it has in the past. That’s not happening, and it is a tell-tale sign of the beginning of the end, for the dollar.
-
The decline coming in the bond market could be enormous. Possibly a bigger problem than the involvement of individual investors (weak hands) in the bond market is the enormous participation by pension funds, both public and private. A major bear market in both the dollar and bonds would destroy the pensions of millions of retirees. A global panic could occur, sending gold parabolic!
-
All my volume and price analysis tells me there is only one more modest rally coming for the dollar and the bonds, before they begin what could be a terminal collapse. I see just one modest buying opportunity coming for gold, and then price begins a quasi-parabolic rise!
Friday, Jul 17, 2026 Super Force Signals Unique Introduction For 321Gold Readers:
Send me an email to admin@supergoldsignals.com and I’ll send you my free “Inflation Thunder Now!” gold and silver stocks video report. I’ll also include 3 of my next Super Force Surge Signals free of charge, as I send them to paid subscribers. Thank you!
|
Stay alert for our Super Gold alerts, sent by email to subscribers,
for both the daily charts on Super Force Signals at www.supergoldsignals.com and for the 60 minute
charts at www.supergoldsignals.com
About Super
Gold Signals:
Our Surge Gold Signals are created thru our proprietary blend
of the highest quality technical analysis and many years of successful
business building. We are two business owners with excellent synergy.
We understand risk and reward. Our subscribers are generally successfully
business owners, people like yourself with speculative funds,
looking for serious management of your risk and reward in the
market.
Frank Johnson:
Executive Editor, Macro Risk Manager.
Morris Hubbartt: Chief Market Analyst, Trading Risk Specialist.
website: www.supergoldsignals.com
email:
admin@supergoldsignals.com
email: admin@supergold60.com
Mail:
1276 Lakeview Drive
Oakville, Ontario, L6H 2M8
Canada
###
Apr 01, 2011
Morris Hubbartt
321gold
Ltd
|
