Super Force Signals - A Leading
Market Timing Service
We Take Every Trade Ourselves
Is The S&P 500 Now A Currency?
Morris Hubbartt
Weekly Market Update Excerpt
posted Mar 30, 2012
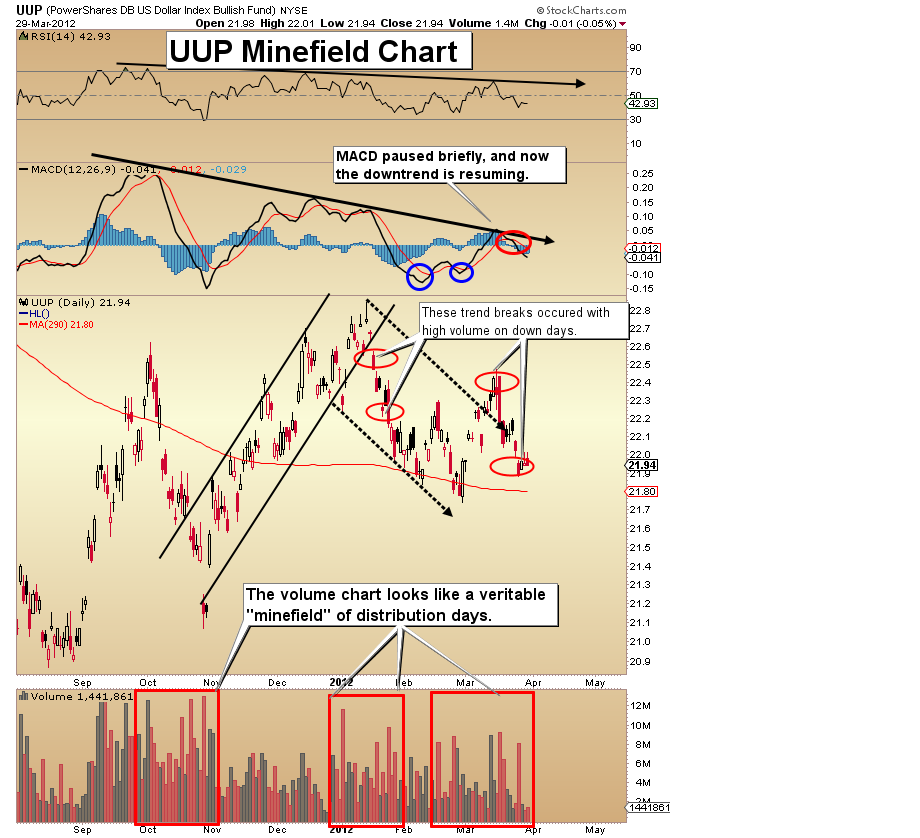
UUP (US Dollar Proxy) Minefield Chart
- China continues to make progress in widening the use of the renminbi in global trade. Partner countries are using swap agreements to bypass the US dollar.
- China has entered into currency swap agreements with about 20 nations, the largest of which is Brazil. The Reserve Bank of Australia announced they have agreed to a $31 billion currency swap. The economy of Australia is one of the most developed and modern market economies in the world, with a GDP of approximately $1.6 trillion. There is a lot of room for more of these currency swaps.
- It is only a matter of time before the renminbi joins the dollar as a major reserve currency, and it may happen sooner than most analysts believe is possible.
- Technical analysis supports this fundamental analysis. Major falls in the dollar have historically produced substantial gains for gold. The highs in the dollar in late December and early January were not confirmed by MACD or RSI. Both of these indicators are exhibiting downtrends.
- The volume section of the chart looks like a veritable minefield of distribution day landmines that have exploded. The distribution has been relentless for well over six months.
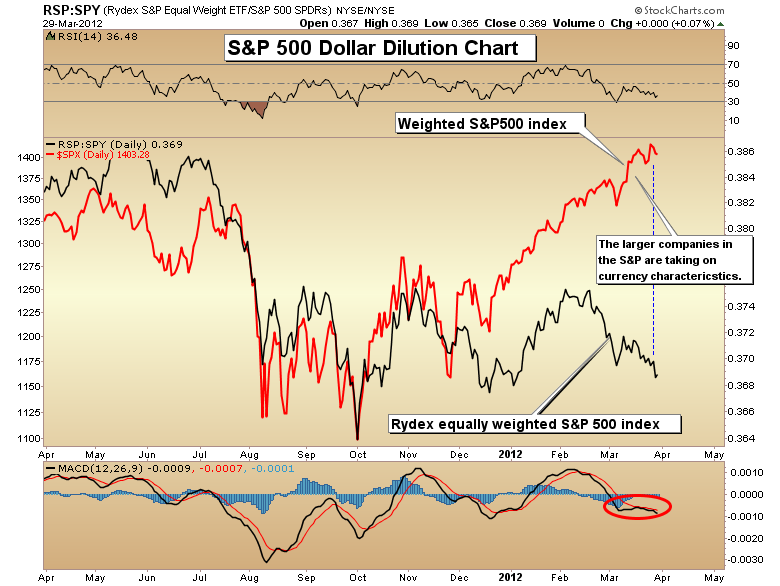
S&P 500 Dollar Dilution Chart
- Another sign of a US currency problem can be found in the way the S&P500 is trading. The S&P is a weighted index. The larger companies have a much larger presence in this index than the smaller ones, and it is these larger companies that I believe benefit the most from the Fed’s destructive policy of currency dilution.
- Look at my comparison of the equally-weighted Rydex S&P 500 index to the regular S&P 500 chart. You can see that a startling divergence is occurring right now, and in recent days this divergence has been intensifying.
- The S&P 500 is trading more and more like a currency, and the large stocks in the index are indicating the extent of the dollar’s decline.
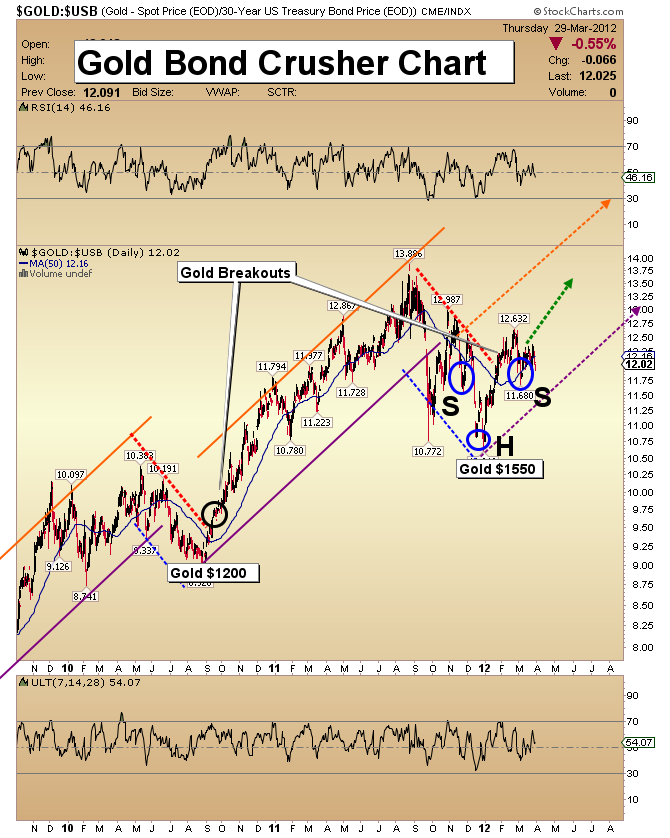
Gold Bond-Crusher Chart
- The US Bond market is probably a ticking time bomb. Gold looks like a “bond-crusher” on the gold:bond ratio chart. Momentum investors should give serious consideration to selling some bonds in this area and replacing that investment with gold.
- Note the head and shoulders pattern that has formed on the chart. I’ve indicated that I believe QE3 is coming. Gold has consistently outperformed bonds. Goldman Sachs research analysts argue that gold is trading at prices that indicate investors have lost confidence in QE3.
- A“QE3 surprise” could create a significant move to the upside in gold, and I think it will happen.
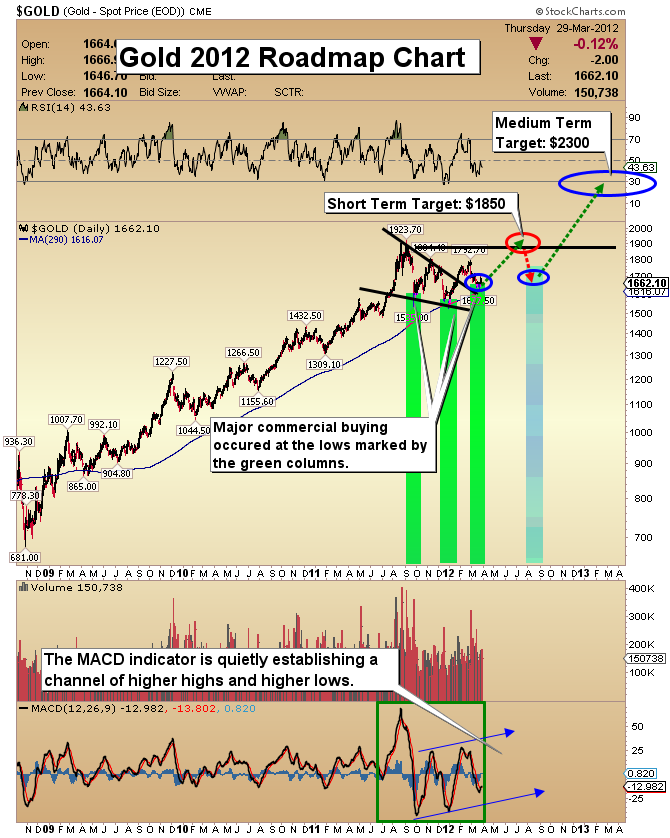
Gold Roadmap Chart
- Commercial traders appear to have entered the gold market in size. The largest commercial trader buys appear to have come near the lows of $1625, and any price lower than that could find even stronger commercial support. At this point in time, I fully expect that low of $1625 to hold.
- I had not colored the current area with a green column until I saw the commercial traders make their move, and you can see there are now three green columns in place.
- The first column occurred in late summer as the $1535 area lows were established. The second wave of commercial buying came in December, and the third just occurred.
- I expect gold to rise now to about $1850. Longer term, my trading model is targeting the $2300 area.
Hulbert’s Gold Sentiment
- I like to use sentiment data provided through www.sentimentrader.com hand in hand with the COT reports. The latest Hulbert sentiment charts show that gold investors are so sold out that they are actually now carrying a net short position.
- This degree of negative sentiment should be taken as your signal to buy physical gold.
- I am going to be doing a video covering the Hulbert statistics as well as today’s COT report, and will email it to anyone in the gold community who requests it. Send me an email to trading@superforcesignals.com and I’ll send it to you.
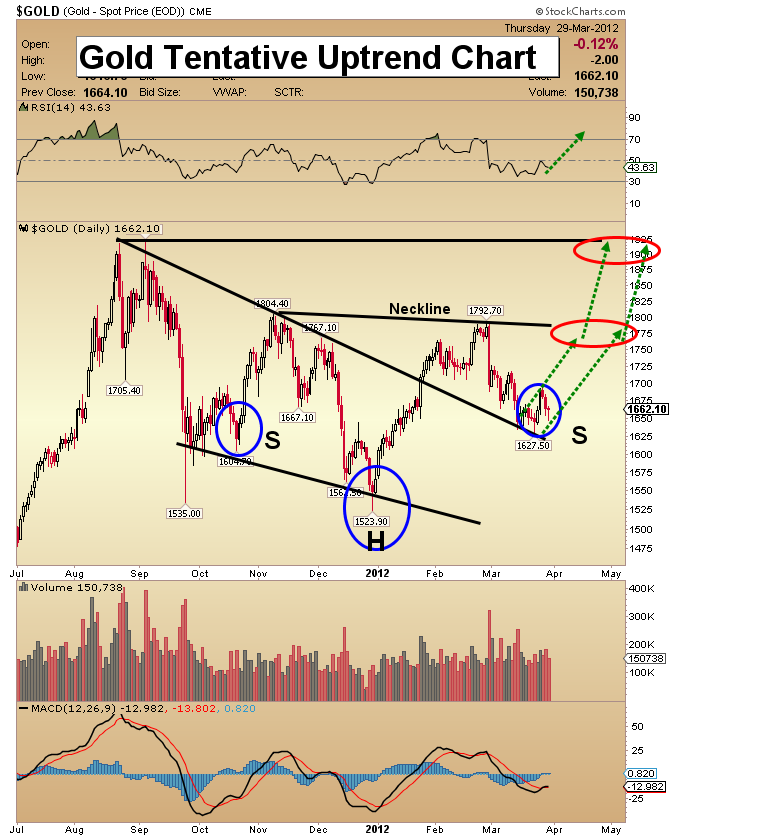
Gold Tentative Uptrend Chart
- Sentiment is so bad that almost nobody thinks gold can really go higher, and that sentiment tells me this head and shoulders formation is likely going to “deliver the goods” for you. The target for the h&s formation is about $2100.
- Look closely at the trading between the two dotted green lines since the right shoulder low was established. The back and forth action between those lines appears to be creating a tentative new uptrend.
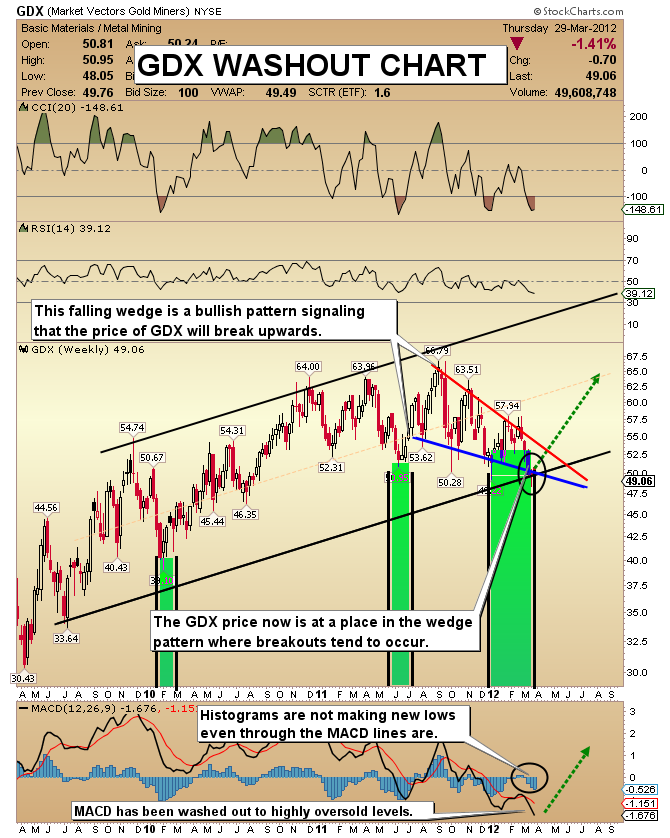
GDX Washout Chart
- Sentiment has not been this bad in the history of the gold bull market, which almost surely spells much higher prices, ultimately.
- The bottom channel has been touched, which I mentioned as a possibility when I last posted this chart about three weeks ago.
- Weekly MACD is washed out and drastically oversold. Don’t try to outsmart yourself by trying to avoid more downside pain. My gold stocks position is now bigger than at any point during the last several years.
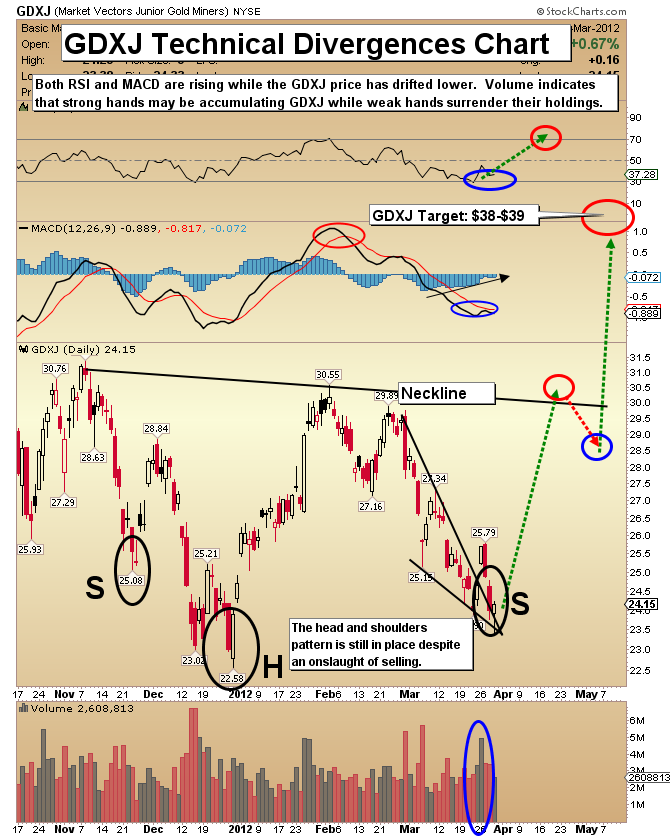
GDXJ Divergences Chart
- The loose inverse head and shoulders formation continues to complete a right shoulder. Additional weakness has occurred on moderate volume. Patience is required.
- Two key divergences have started to appear; both RSI and MACD have refused to confirm the GDXJ price movement to the downside over the past few trading sessions, and that indicates that the right shoulder low will likely hold.
- Obviously we all want to see higher prices for the junior gold exploration sector immediately. I do think a substantial price advance will commence within a week or so.
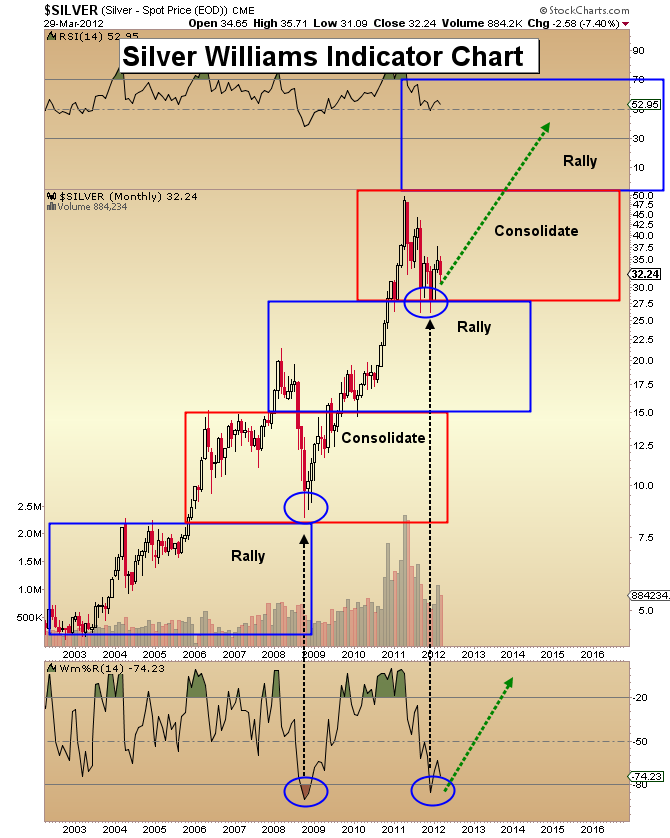
Silver Williams Indicator Chart
- Silver continues to be one of my favorite investments for the long term. I’d like to see investors concentrate on owning the physical metal and some good exploration stocks.
- The Williams indicator on the monthly chart is drastically oversold, and a major rally is very possible now.
- This market, like gold, has been supported by commercial traders, and that is a long term benefit for the metal going forward.
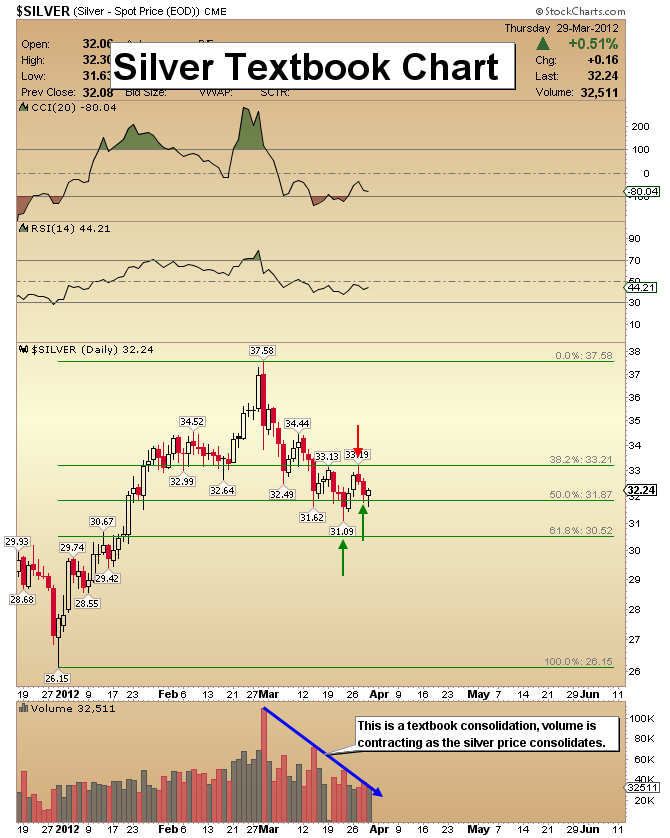
Silver Textbook Chart
- Silver rallied from about $26.15 to $37.58, and from there it declined close to the 61.8% Fibonacci retracement point, but the 50% retracement line has also worked to hold the decline in check.
- Note the beautifully tapered decline in volume during this correction in the silver price.
- Both the action of the price around key Fibonacci retracement points and the action of volume are just what the technical analysis doctor ordered.
- I’m looking at the $31.87 area as the likely bottom of this correction. From there, I think it’s on to higher prices!
Friday, Jul 3, 2026 Super Force Signals Unique Introduction For 321Gold Readers:
Send me an email to admin@supergoldsignals.com and I’ll send you my free “Inflation Thunder Now!” gold and silver stocks video report. I’ll also include 3 of my next Super Force Surge Signals free of charge, as I send them to paid subscribers. Thank you!
|
Stay alert for our Super Gold alerts, sent by email to subscribers,
for both the daily charts on Super Force Signals at www.supergoldsignals.com and for the 60 minute
charts at www.supergoldsignals.com
About Super
Gold Signals:
Our Surge Gold Signals are created thru our proprietary blend
of the highest quality technical analysis and many years of successful
business building. We are two business owners with excellent synergy.
We understand risk and reward. Our subscribers are generally successfully
business owners, people like yourself with speculative funds,
looking for serious management of your risk and reward in the
market.
Frank Johnson:
Executive Editor, Macro Risk Manager.
Morris Hubbartt: Chief Market Analyst, Trading Risk Specialist.
website: www.supergoldsignals.com
email:
admin@supergoldsignals.com
email: admin@supergold60.com
Mail:
1276 Lakeview Drive
Oakville, Ontario, L6H 2M8
Canada
###
Mar 30, 2012
Morris Hubbartt
321gold
Ltd

|
