Super Force Signals - A Leading
Market Timing Service
We Take Every Trade Ourselves
US Domination Top In Play
Morris Hubbartt
Weekly Market Update Excerpt
posted Mar 23, 2012
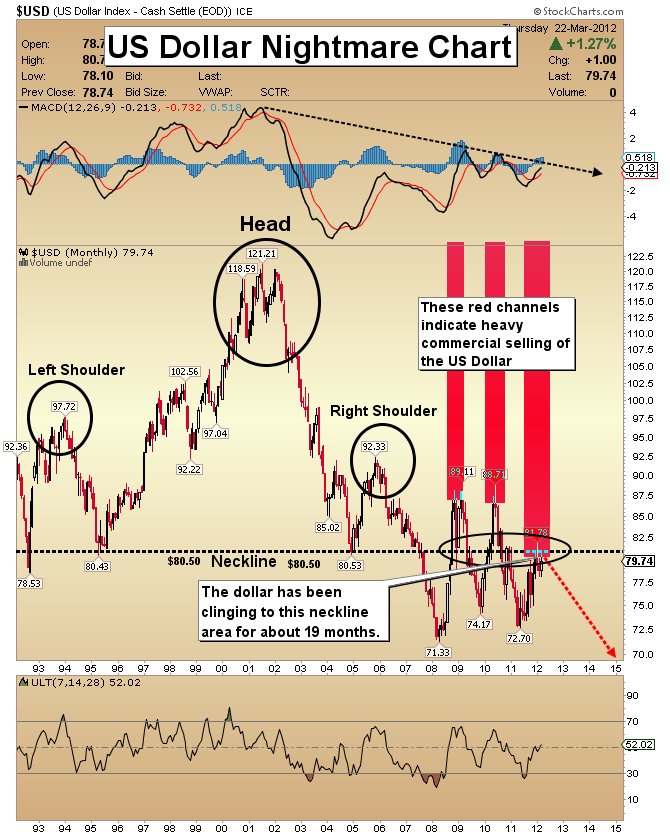
US Dollar Nightmare Chart
- I put a lot of emphasis on the dollar because it is the world’s main reserve currency. Nations have to convert their local currencies into US dollars to buy commodities such as crude oil and agricultural products. So, it’s vitally important to monitor the health of the dollar trade.
- China continues to make major progress in unilateral agreements with its trading partners, thereby eliminating some of their need for dollars. Iran has started trading oil in currencies other than the dollar, putting additional pressure on US currency.
- The US dollar’s role as the world’s dominant settlement currency is waning. If this trend accelerates, it could cause the dollar to become unstable and trade erratically. That instability could potentially cause an upside explosion in the price of gold.
- My nightmare chart covers about twenty years of US dollar trade. Look at the massive head and shoulders price pattern that has formed over the long term.
- That top represents a top in American domination, not the end of the dollar. It is rightfully taking a long time to complete itself. Most importantly, this top targets dramatically lower prices for the dollar.
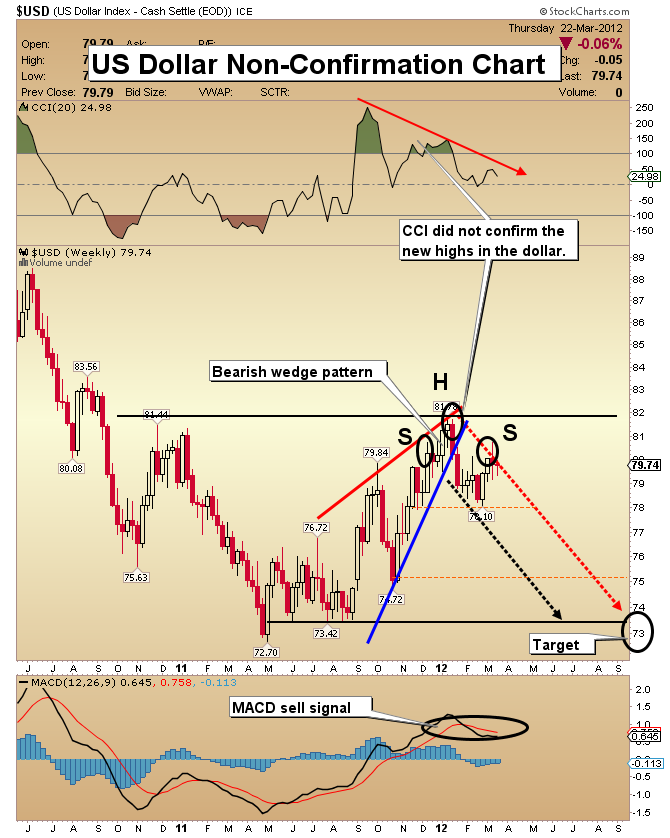
US Dollar Non-Confirmation Chart
- One of the best technical indicators in the short to medium term is the CCI. It has failed to confirm the price high you see at the point of the head in the head and shoulders top pattern.
- This weekly US chart has also recently broken down from a rising wedge pattern.
- Please note the heavy commercial selling areas that I’ve highlighted around the area of the neckline over the past 19 months. Commercial traders obviously aren’t very keen on the dollar’s prospects here.
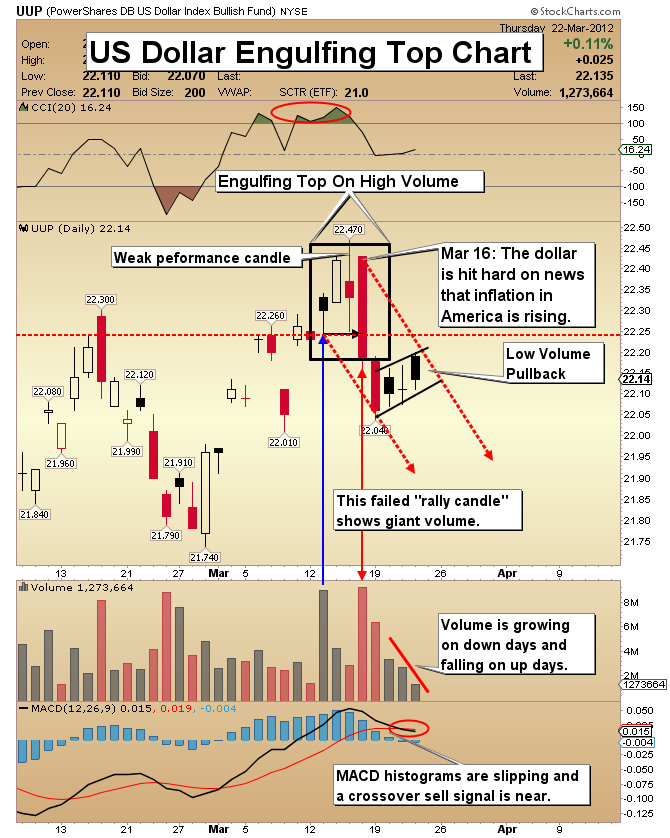
UUP (US Dollar Proxy) Engulfing Top Chart
- The third dollar chart I’m focusing on today is "a" short term engulfing top on this UUP-nyse candlesticks chart. The dollar was acting like a move higher might be in the cards, but this engulfing pattern turned even the short term trend lower.
- Note the volume pattern as the dollar has displayed a tiny pullback to the bottom of the engulfing pattern. Volume is almost non-existent, and this is a very bearish sign.
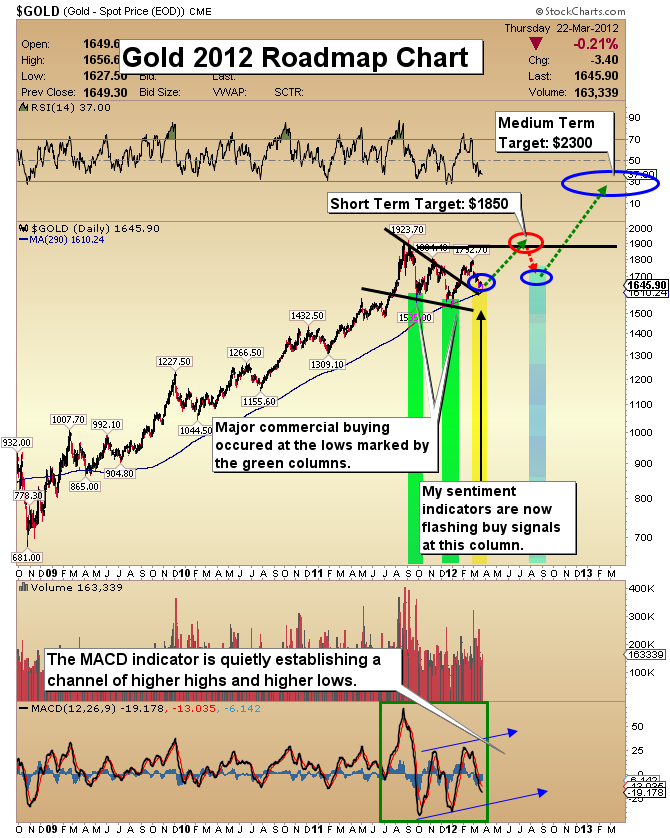
Gold Roadmap Chart
- The latest sentiment numbers are showing that hot speculative money has probably been washed out of the gold market. I believe a “wall of worry” is being built right now in preparation for gold’s next assault on my target of $1850.
- Note the beginnings of a MACD channel with an upside bias (higher highs and higher lows). I’ve highlighted that channel on the bottom of the chart.
- The “all-clear” signal for a move to $1850 cannot be declared until the COT report shows commercial purchases are back in size, and that report is issued Friday afternoon. I will be doing a video for subscribers covering this report.
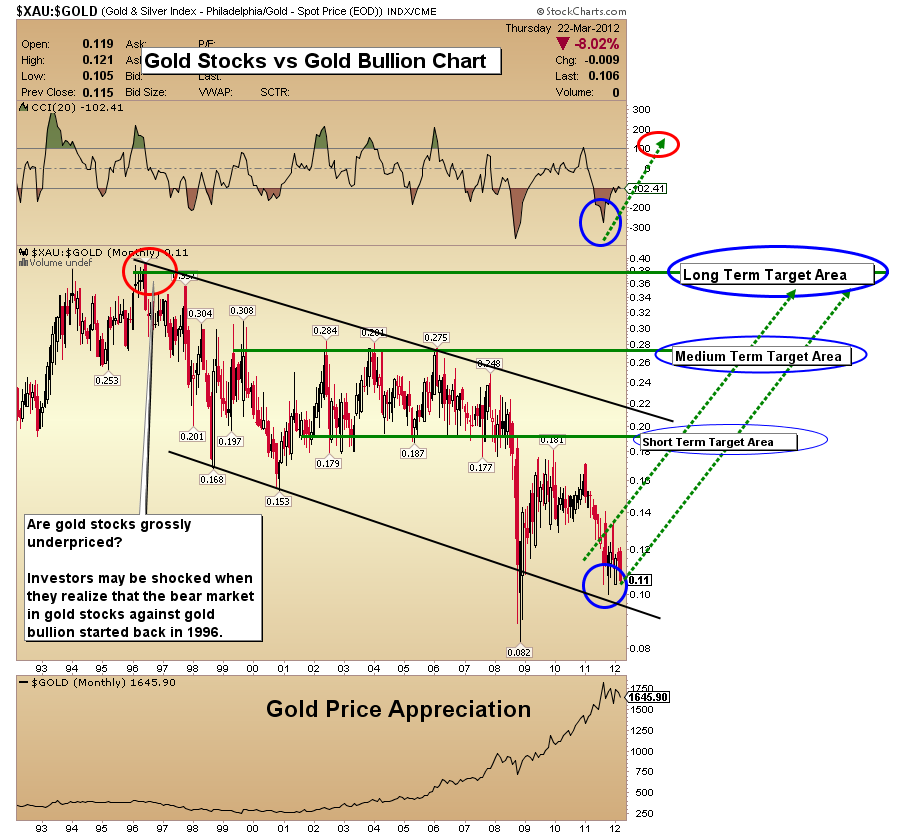
Gold Stocks Versus Gold Bullion Chart
- I have set aggressive targets for gold stocks, because I believe there is “technical evidence” that these shares could move as much as 300% higher over the next 18-24 months.
- The current ratio of gold stocks (basis the XAU index) measured against gold bullion is just .11. In 1996, before the major bull in gold had even started, this ratio was trading in excess of .36!
- If the current ratio goes back to levels of 1996, the price of GDX could go north of $130 per share. Gold has risen about sevenfold from its lows against the dollar, while stocks have fallen by more than 70% against gold. In theory, gold stocks could go up 300% without gold going up at all, and the stocks would still not be grossly overvalued.
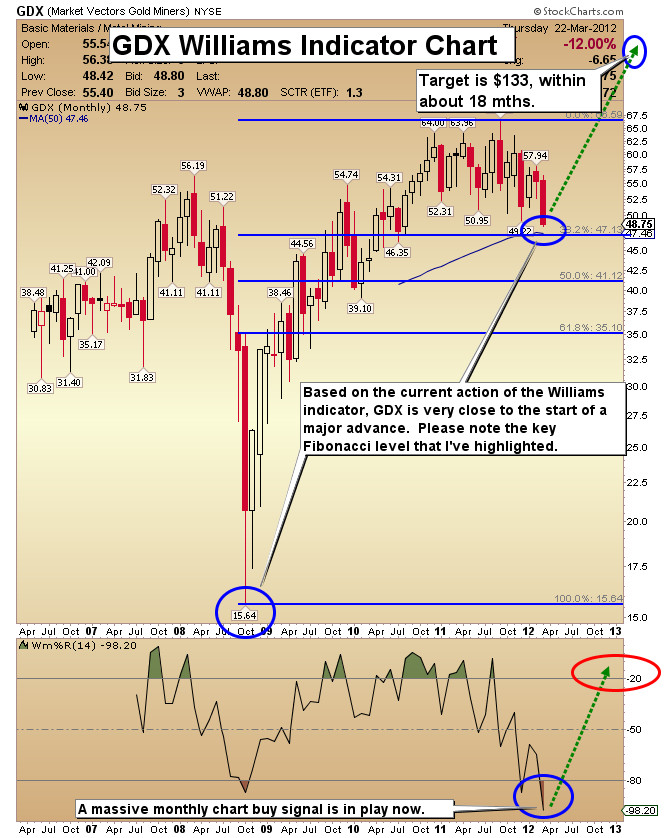
GDX Williams Indicator Chart
- This is a monthly chart, and you can see that the Williams indicator is at truly epic oversold levels for GDX, and thus for most gold stocks.
- Click here now to take a look at general gold stocks investor sentiment. This chart is from www.sentimentrader.com. This data suggests the selling pressure, like the volume, is running out of steam. I continue to be a buyer in the sector. Many investors feel “overweight” in gold stocks, but those feelings should subside as stronger prices occur.
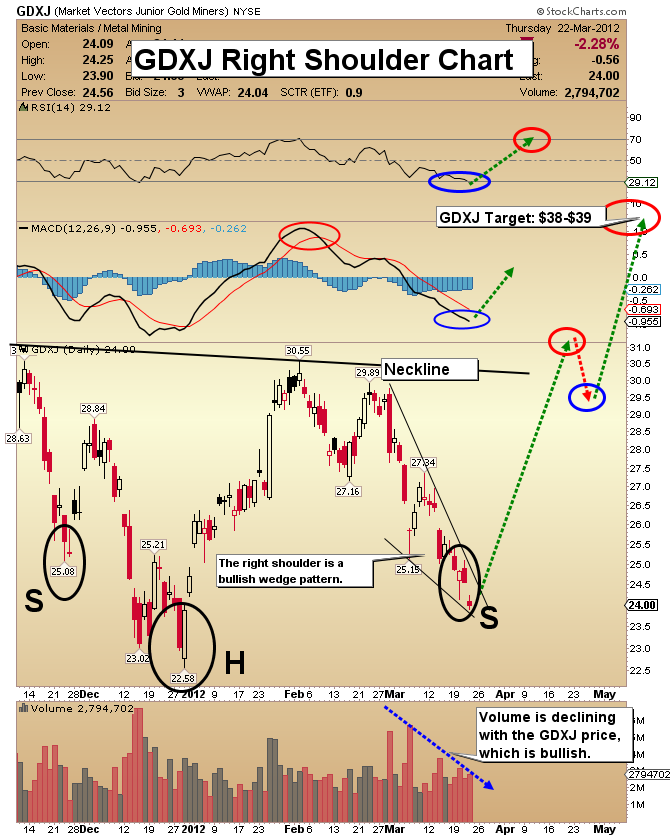
GDXJ Right Shoulder Chart
- I currently own more gold stocks now than any time in recent years. My asset of choice right now is the junior gold sector.
- GDXJ is currently down "about" 40% from its highs of several months ago and the head and shoulders formation indicates a potential price target of $38-$39 per share.
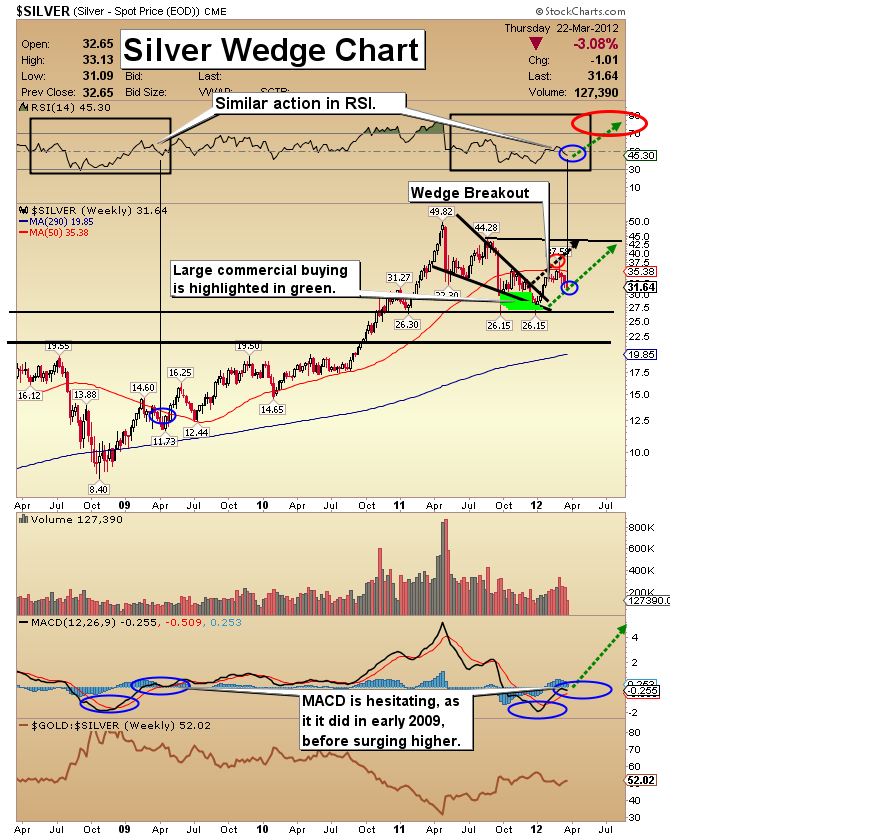
Silver Wedge Chart
- Silver has been correcting now for a few weeks. It is still up approximately 20% from its December lows. RSI has paused, but I think this rally is very close to re-asserting itself.
- In the intermediate term, my target is $44. A move into the $35 price area is required to embolden the speculative bulls, and potentially start a much stronger advance on the price charts!
Friday, Jul 3, 2026 Super Force Signals Unique Introduction For 321Gold Readers:
Send me an email to admin@supergoldsignals.com and I’ll send you my free “Inflation Thunder Now!” gold and silver stocks video report. I’ll also include 3 of my next Super Force Surge Signals free of charge, as I send them to paid subscribers. Thank you!
|
Stay alert for our Super Gold alerts, sent by email to subscribers,
for both the daily charts on Super Force Signals at www.supergoldsignals.com and for the 60 minute
charts at www.supergoldsignals.com
About Super
Gold Signals:
Our Surge Gold Signals are created thru our proprietary blend
of the highest quality technical analysis and many years of successful
business building. We are two business owners with excellent synergy.
We understand risk and reward. Our subscribers are generally successfully
business owners, people like yourself with speculative funds,
looking for serious management of your risk and reward in the
market.
Frank Johnson:
Executive Editor, Macro Risk Manager.
Morris Hubbartt: Chief Market Analyst, Trading Risk Specialist.
website: www.supergoldsignals.com
email:
admin@supergoldsignals.com
email: admin@supergold60.com
Mail:
1276 Lakeview Drive
Oakville, Ontario, L6H 2M8
Canada
###
Mar 23, 2012
Morris Hubbartt
321gold
Ltd

|
