Super Force Signals - A Leading Market Timing Service
We Take Every Trade Ourselves
Ominous Stock Market Technicals Morris Hubbartt
Weekly Market Update Excerpt
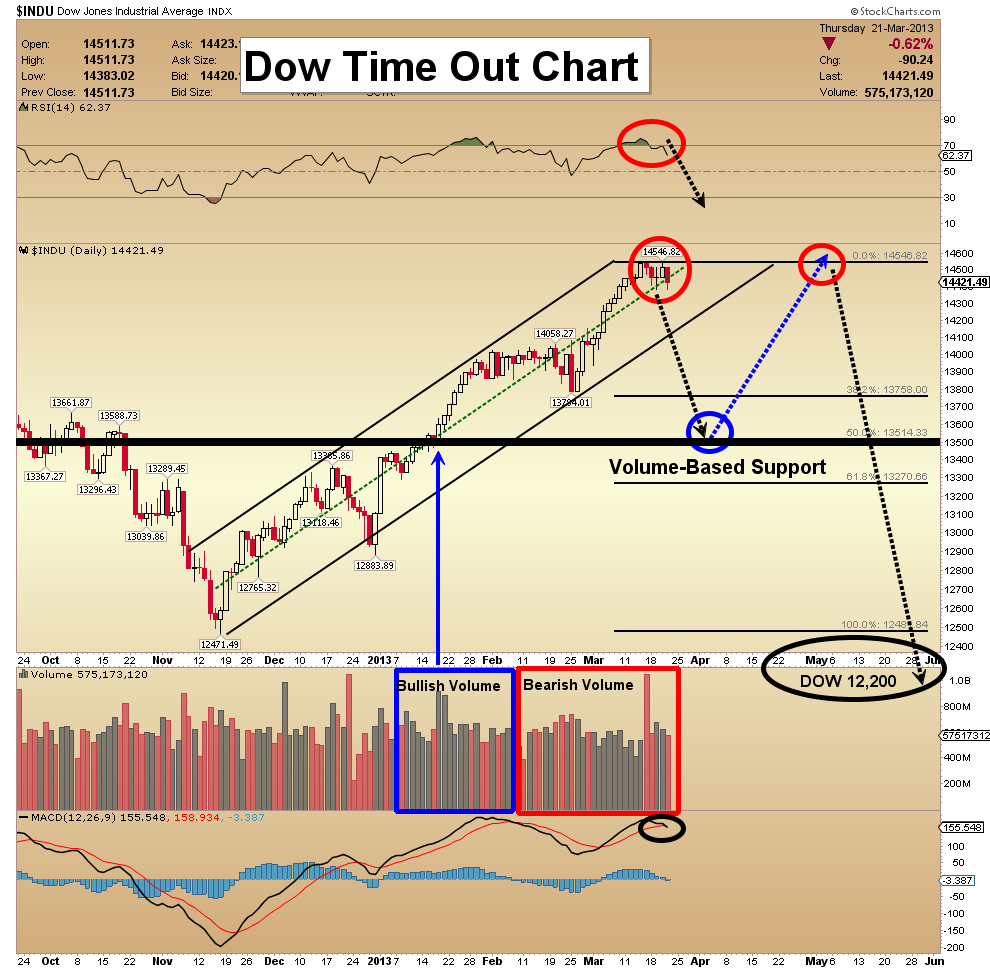
posted Mar 22, 2013 Dow Time Out Chart - At this point, quantitative easing is pumping about 85 billion electronically printed dollars a month, into bonds and other “quality assets”. Without the artificially low interest rates that QE creates, the economy would probably implode.
- I view the current market as a dangerous place to allocate investment capital. I targeted 13,500 initially, for the Dow. Now I’ve added a 2nd target, which is 12,200.
- Note the volume boxes that I placed at the bottom of the chart. Down-day volume is beginning to overwhelm up-day volume, which is extremely bearish. The Dow could soon form a huge double top pattern, just as the infamous “Sell in May, and go away!” period of time arrives!
- Overall, the stock market continues to be a huge beneficiary of QE policy. How long can this stock market rally continue? To help answer that key question in more detail, I am focused on two leading indicators.
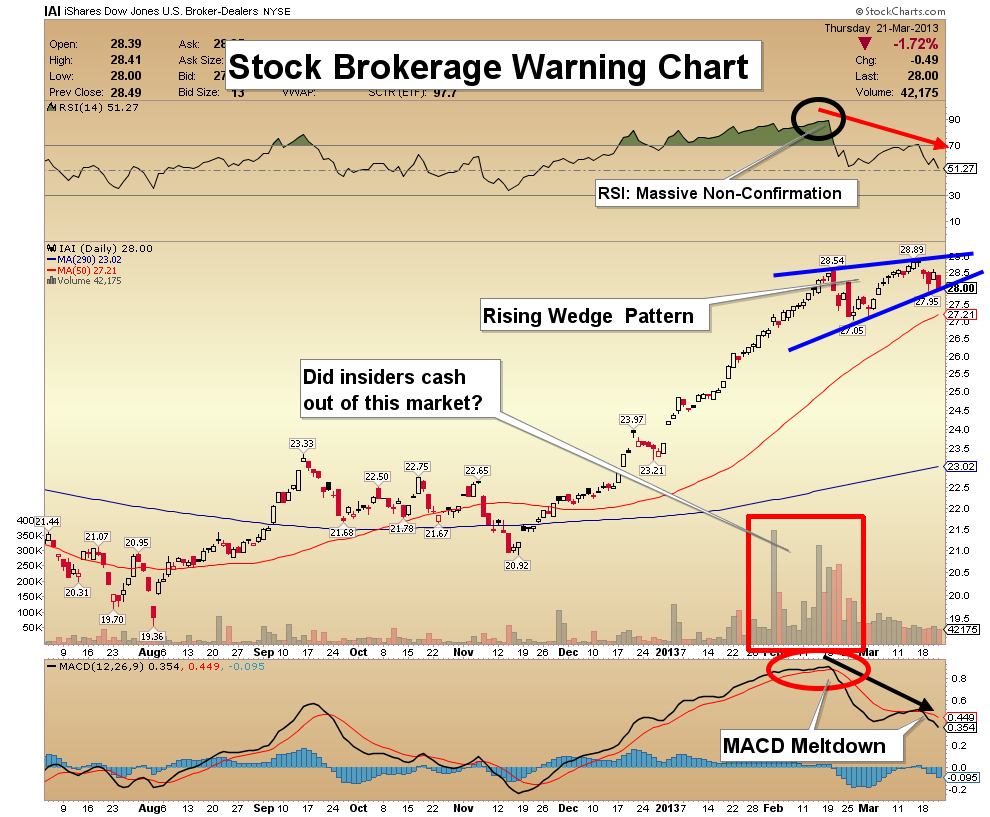
Stock Brokerage Warning Chart - The first one is the broker-dealer sector. As you can see on this chart, RSI became massively overbought. It went to about 90, which is extremely high. Now, the price has continued to rise, while RSI has declined. That sets up a glaring negative divergence.
- Huge money flows have gone into equities throughout the course of this technical meltdown. The danger now, is that a correction could take the form of a flash crash.
- Note the rising wedge pattern in play, and what appeared to be heavy insider selling. Volume has dried up now. If everyone is in, and the insiders are out, where is the price likely to go?
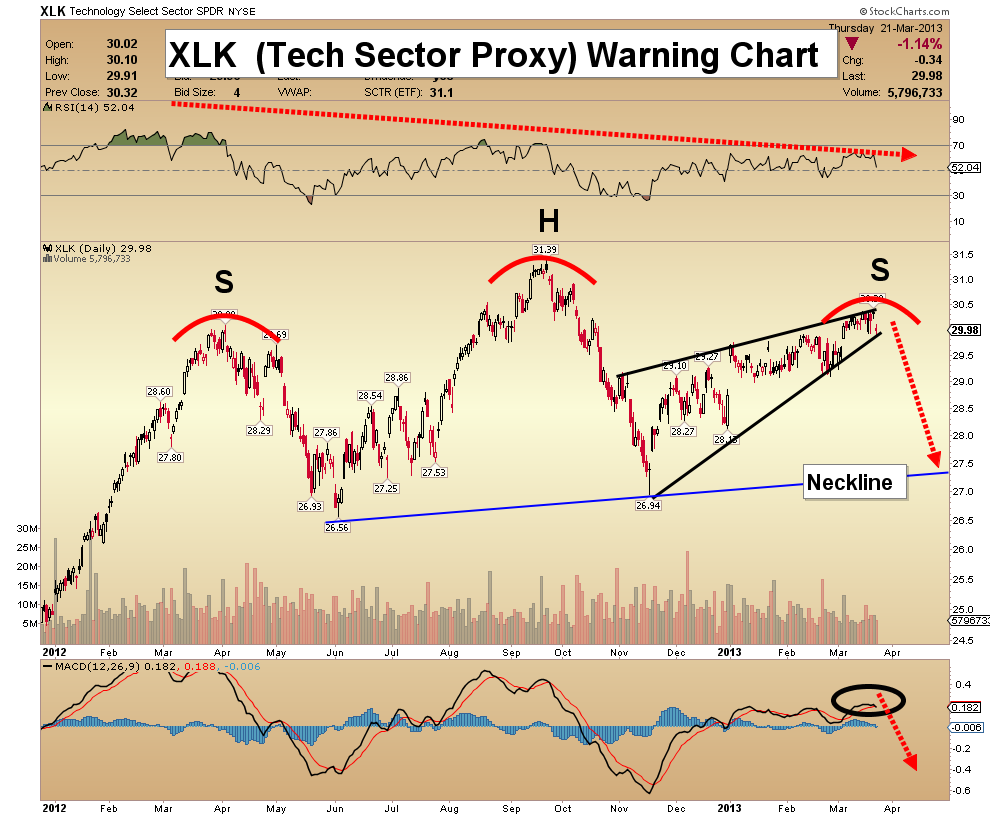
XLK (Technology Proxy ETF) Chart - The second sector that I have looked at is the technology sector, where there is substantial underperformance against the general market.
- Much of the underperformance can arguably be laid at the feet of Apple, but the whole “tech” sector is showing a huge head & shoulders top pattern, with ominous implications for the average investor.
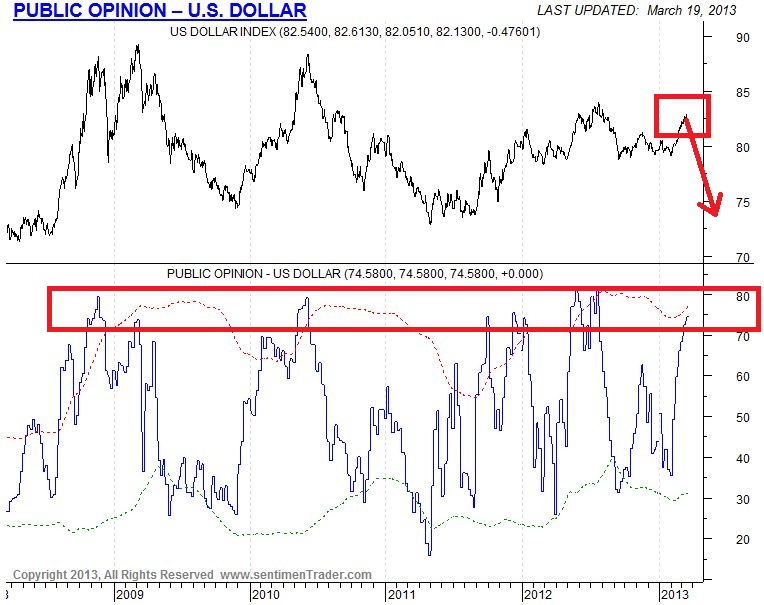
US Dollar Public Opinion Chart - The latest public opinion poll shows the public is loading up on US dollars. Rallies in gold tend to begin at these points of extreme bullishness on the dollar.
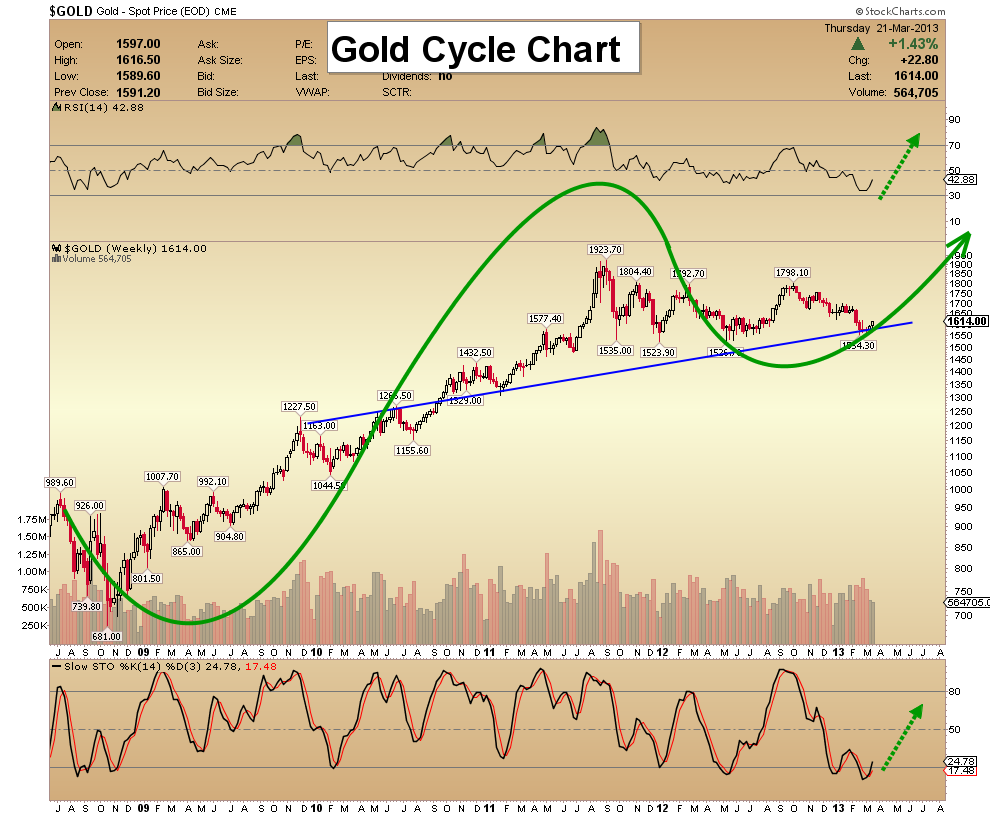
Gold Cycle Chart - I am a bit of an unapologetic bull, when it comes to physical metal, because I won’t sell much of my physical gold bullion at any price.
- As the gold price has consolidated now for nearly two years, sentiment has become overwhelmingly negative.
- The seasonal cycle price for gold is nearing a key low, and the April-June period often features substantial buying from India. There is solid support on the chart in the current price area, which I’ve highlighted in blue.
- Note the slow Stokes and the RSI oscillator. They suggest that this rally could be just starting!
- Still, as the gold price (hopefully) approaches the end of this long consolidation, it pays to be prepared for a quick punch lower.
- The next major move should be to the upside.
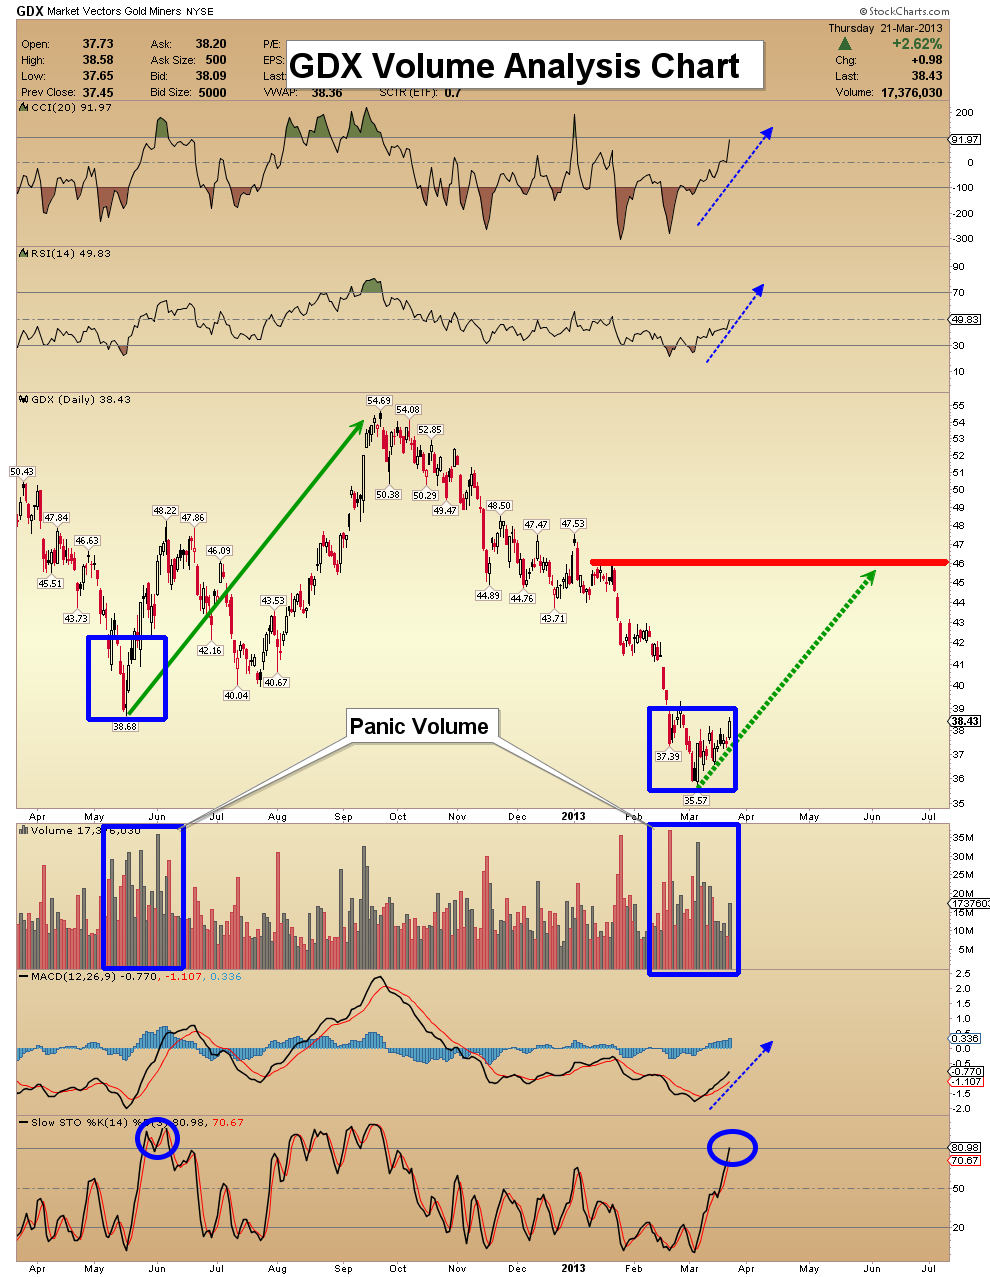
GDX Volume Analysis Chart - The volume patterns in senior gold stocks suggest that a changing of the guard has quietly taken place. As many investors sold in a panic, it looks like smart money has bought.
- So far, there is little fanfare surrounding this small rally, which opens the door to the possibility of something bigger!
- Note the high position of the slow Stokes oscillator, while RSI is around the 50 level. Strong momentum-based moves tend to occur with this type of oscillator set-up in play.
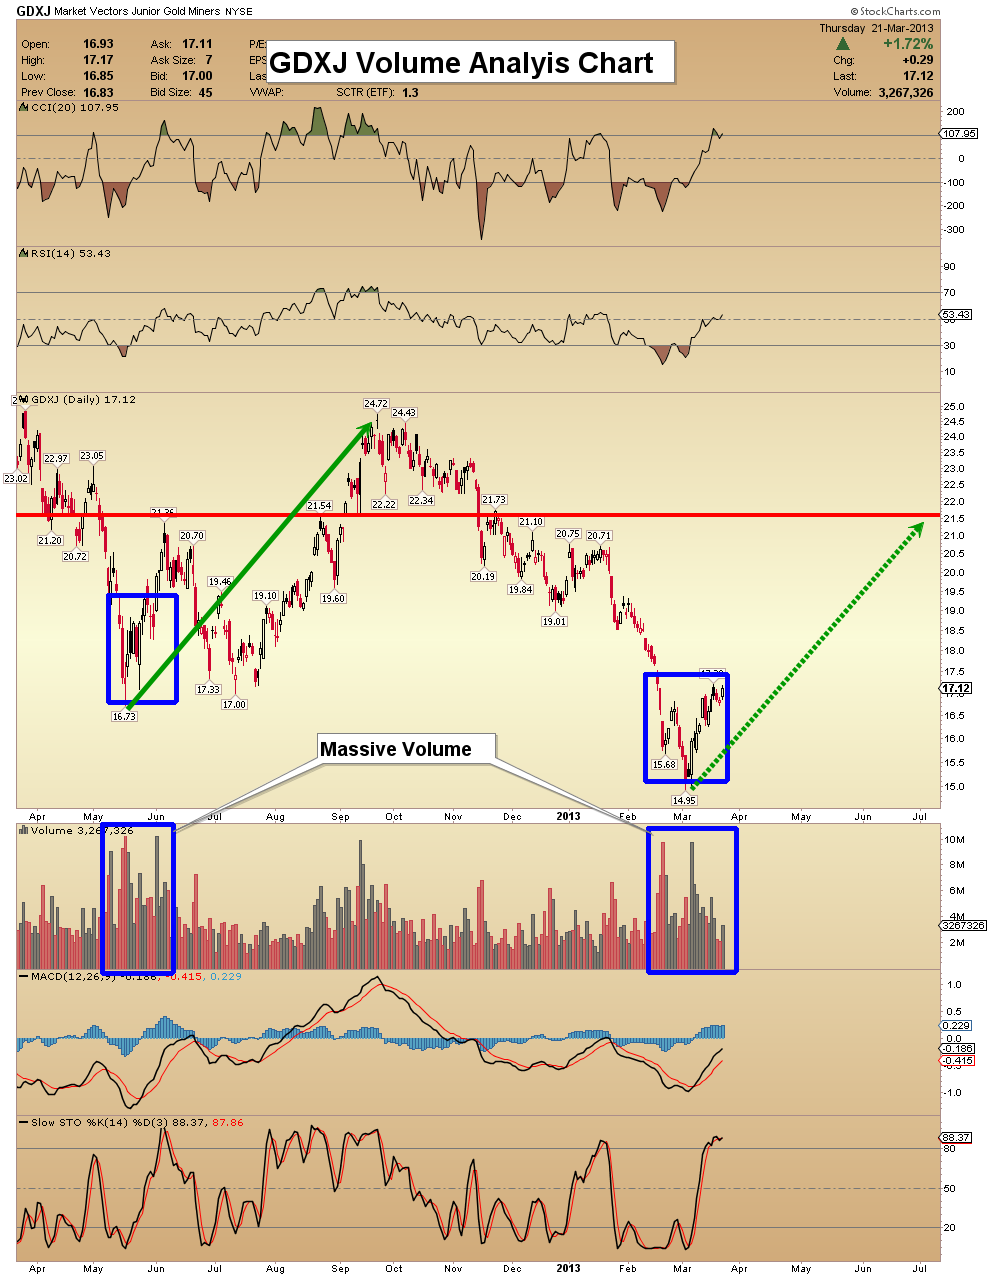
GDXJ Volume Analysis Chart - I have some pretty good news for junior gold stock investors. The “changing of the guard” price & volume action is even more pronounced on this GDXJ chart, than it is for GDX!
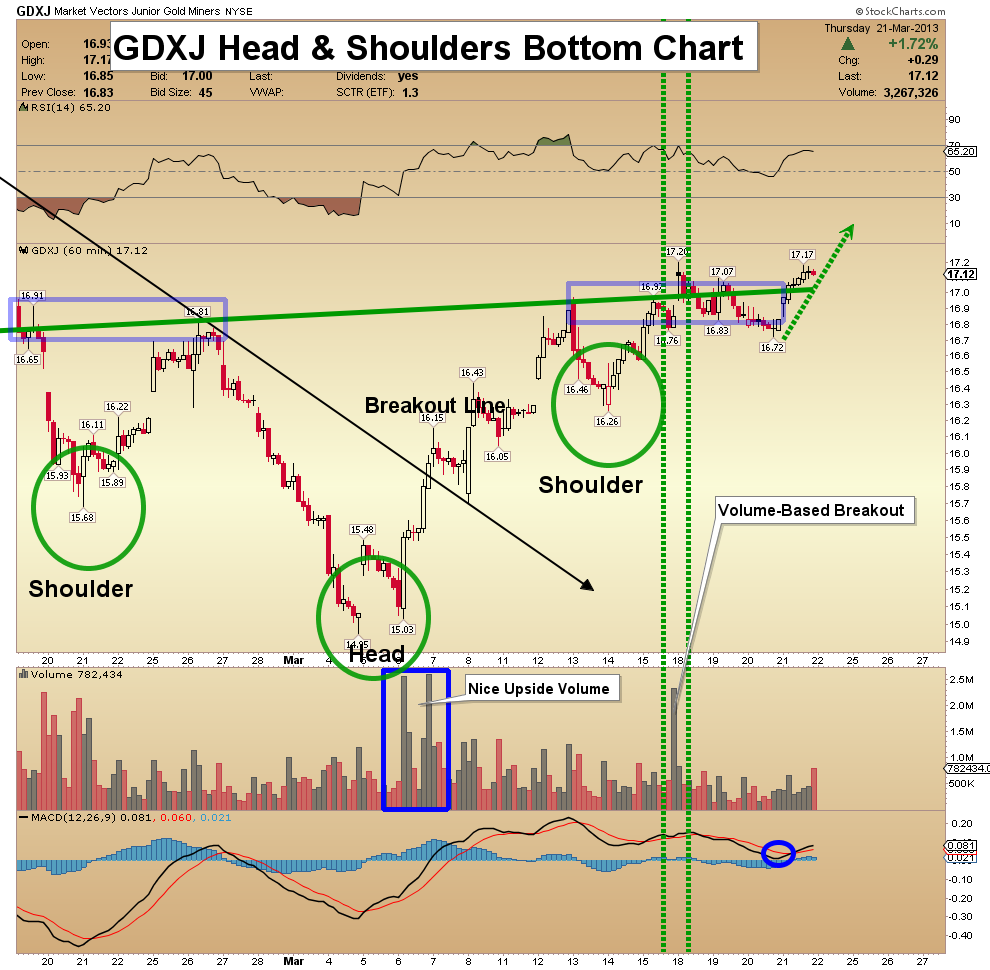
GDXJ Head & Shoulders Bottom Chart - The GDXJ hourly chart is very impressive. I’m anticipating a breakout above $17, on heavy volume. That would generate a huge buy signal, for long-term investors.
- I have a tentative target of $19, but GDXJ is not a “hot money” trade. It’s a long-term play, and investors should hold on for respectable capital gains.
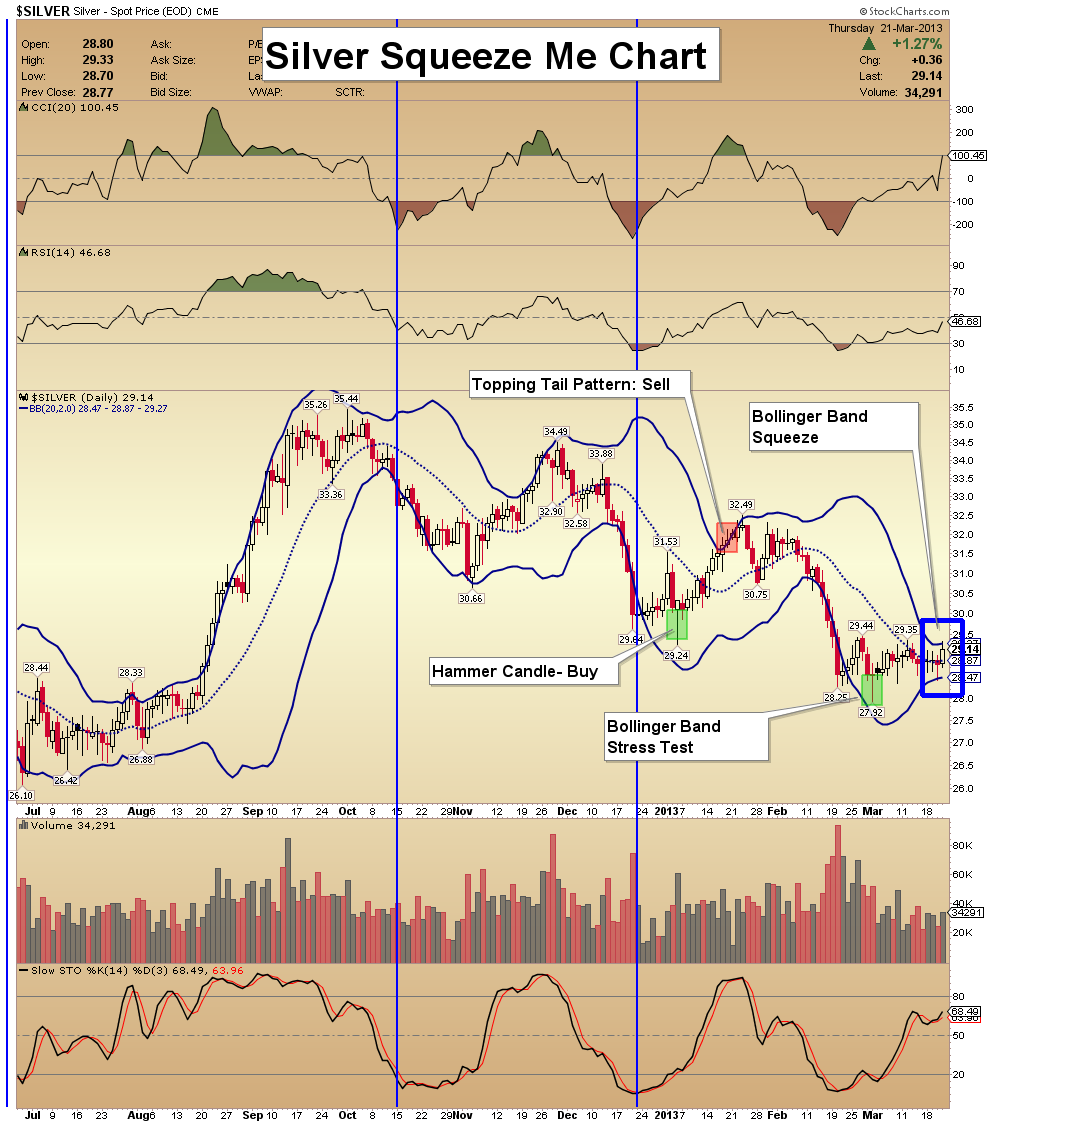
Silver Squeeze Me Chart - The technical situation of the silver chart is improving. Volume looks good. Since late February, more up-days have started appearing on the chart.
- Note the extreme tightening of the Bollinger bands. This kind of “squeeze me” movement usually suggests a turning point is imminent. Since gold has already moved up, I think there’s a solid chance that silver breaks out to the upside, too!
Friday, Jul 3, 2026 Super Force Signals Unique Introduction For 321Gold Readers:
Send me an email to admin@supergoldsignals.com and I’ll send you my free “Inflation Thunder Now!” gold and silver stocks video report. I’ll also include 3 of my next Super Force Surge Signals free of charge, as I send them to paid subscribers. Thank you!
|
Stay alert for our Super Gold alerts, sent by email to subscribers,
for both the daily charts on Super Force Signals at www.supergoldsignals.com and for the 60 minute
charts at www.supergoldsignals.com
About Super
Gold Signals:
Our Surge Gold Signals are created thru our proprietary blend
of the highest quality technical analysis and many years of successful
business building. We are two business owners with excellent synergy.
We understand risk and reward. Our subscribers are generally successfully
business owners, people like yourself with speculative funds,
looking for serious management of your risk and reward in the
market.
Frank Johnson:
Executive Editor, Macro Risk Manager.
Morris Hubbartt: Chief Market Analyst, Trading Risk Specialist.
website: www.supergoldsignals.com
email:
admin@supergoldsignals.com
email: admin@supergold60.com
Mail:
1276 Lakeview Drive
Oakville, Ontario, L6H 2M8
Canada
### Mar 22, 2013
Morris Hubbartt
321gold Ltd
 |
