Super Force Signals - A Leading
Market Timing Service
We Take Every Trade Ourselves
T-bond Train Wreck & Gold's False Bottoms
Morris Hubbartt
Weekly Market Update Excerpt
posted Mar 16, 2012
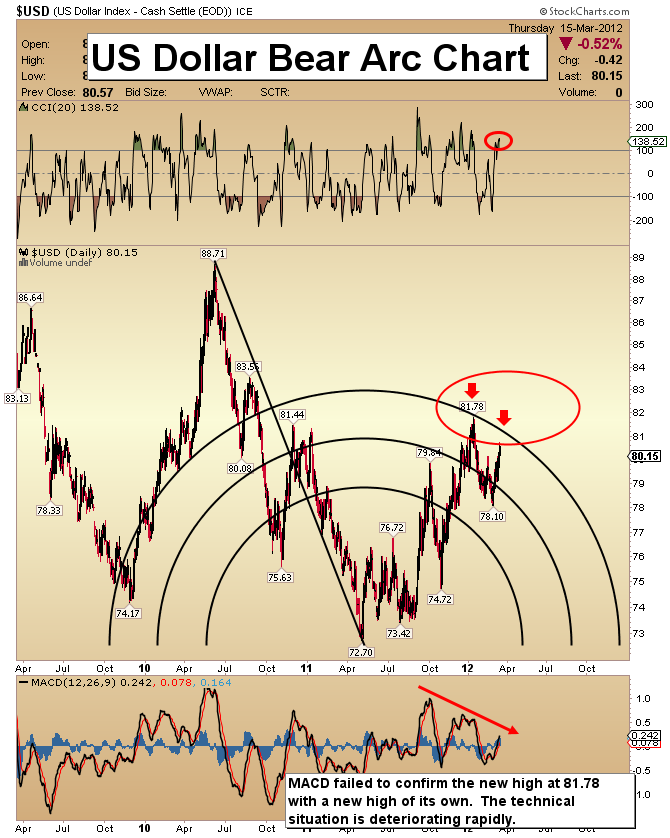
US Dollar Bear Arc Chart
- Trade deficits are historically negative for any currency. The latest U.S. trade deficit numbers show further deterioration. The January deficit widened sharply to a multi-year high of $52.6 billion, up from a revised $50.2 billion in December. We are servicing a welfare state while spending $52 billion more than we produce.
- China’s intention is to extend renminbi loans to BRIC nations. The initiative aims to boost trade between the five nations and promote use of the renminbi. This strategy could put enormous pressure on the dollar.
- Although the dollar has been rallying recently, note the Fibonacci arc resistance just above current prices. Use any price rise to that arc as a signal to purchase more gold.
- The CCI indicator has reached an overbought condition, and MACD has failed to confirm the recent minor highs in the price of the dollar.
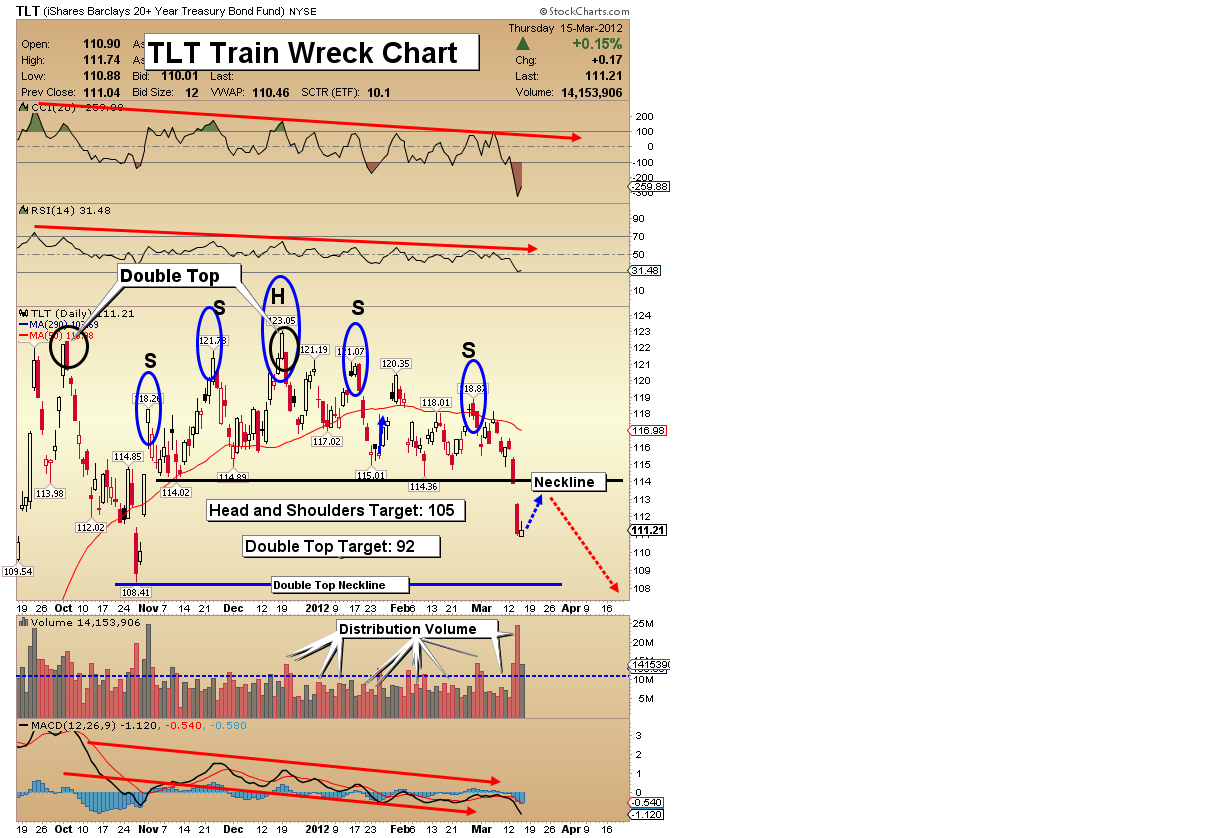
TLT (US T-bond proxy) Train Wreck Chart
- Several weeks ago I warned of a growing head and shoulders top pattern apparent on the T-bond chart. Bond prices are now falling fast. Technically, this chart looks like a train wreck.
- First, I believe the head and shoulders pattern is part of a larger double top. A major top appears to have formed in the bond market. I’m targeting 105 in the short term, based on the head and shoulders pattern.
- 92 is the technical target projected by the larger double top pattern. The distribution volume on this chart is staggering. I suggested investors could short this market a few weeks ago. All rallies can still be shorted with a high degree of confidence.
- The CCI indicator is “spike oversold”, which fits perfectly with my projected rally to the neckline of the head & shoulders top. In the bigger picture, the MACD looks like a ball of tumbleweed blowing down a hill.
- The bond and the dollar are jointly displaying absolutely horrific technical conditions. The set-up could have ominous implications for our nation.
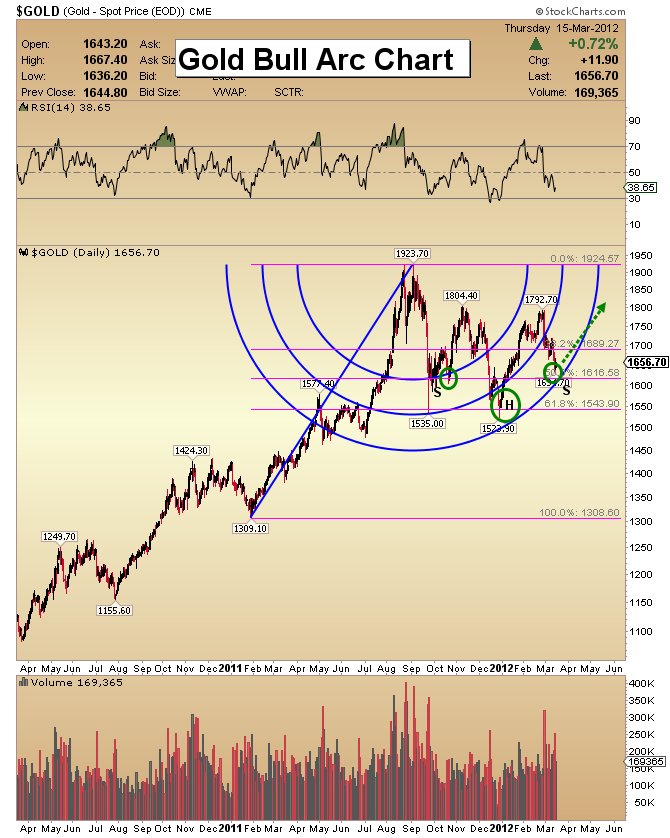
Gold Fibonacci Arc Chart
- Accumulation of gold on price weakness is the best way to approach this market. China reduced its US Treasury exposure by $32 billion in the month of December alone, and is rumored to have continued to buy gold aggressively in the first quarter of this year.
- China’s gold purchases were up nearly 30% for the year in 2011. Should you follow their lead? I think so. Money sitting in US dollar deposits draws virtually no interest.
- Fibonacci arcs identify support and resistance on a scaled timetable. Note that most of the trading that occurred during the formation of the left shoulder of the head and shoulders bottom pattern occurred around the inner arc.
- The trading that formed the head mostly occurred around the middle arc, and the trading during what appears to be the right shoulder has occurred around the outer Fibonacci arc.
- Note that both the left shoulder and the head had brief price spikes down to the next arc level. There could be a brief spike lower in this case too, as the Greek debt crisis has yet to be resolved. It will not be “solved”, but it could be “resolved”, by a gold price spike!
- Technical action suggests that the corrective process in the metals is coming to a close. My work suggests that the gold price of $2100 will be acquired within the next several months.
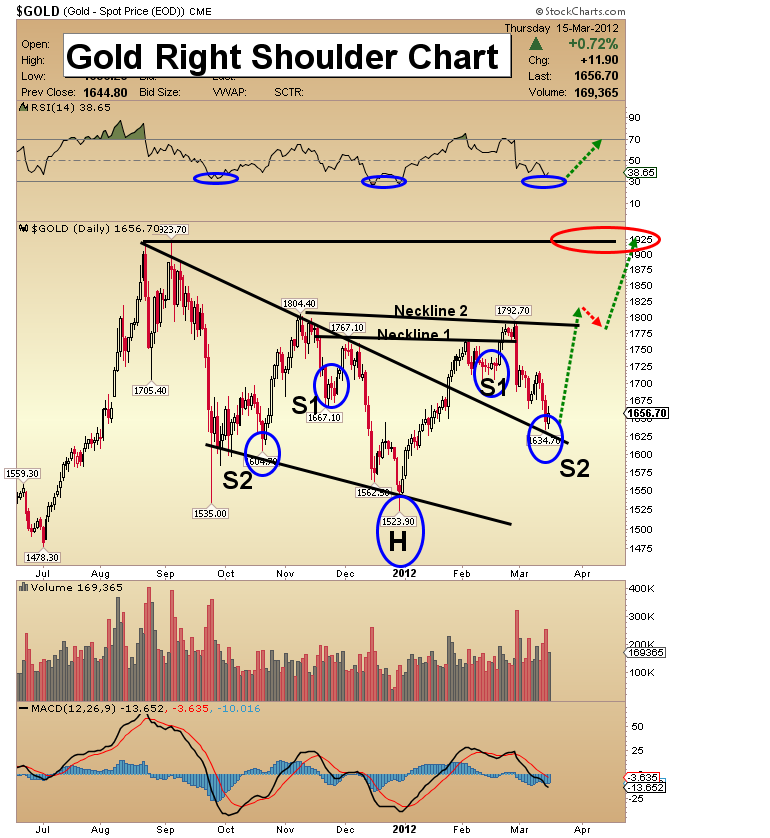
Gold Right Shoulder Chart
- Gold has produced numerous “false flags” of a final low. These false bottoms have been disappointing to investors, but the fact is that the technical picture has been strengthened by these lows. The head and shoulders pattern is much stronger and more symmetrical now. Note the formation of the 2nd right shoulder. That’s created excellent symmetry with the 2nd left shoulder.
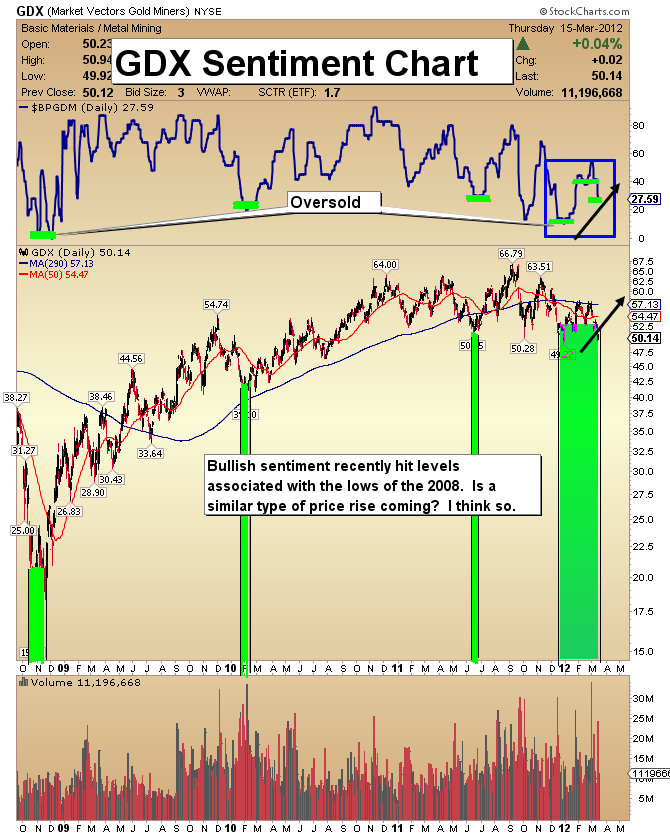
GDX Sentiment Chart
- The most encouraging information I can give the gold community in relation to gold stocks is the fact that the majority of investors are too negative on the prospects of these companies.
- It doesn’t matter if it's small or large stocks, it is the same story; people are worn out. This is the time to go against the flow and buy, so you lower the average entry point of your positions.
- The $BPGDM sits near 27.57, which is up from the extreme lows of December, but still at a point that indicates investors are very wary of investing in gold stocks.
- While gold stocks could still go lower, the current level of the $BPGDM indicates that gold stocks should be bought.
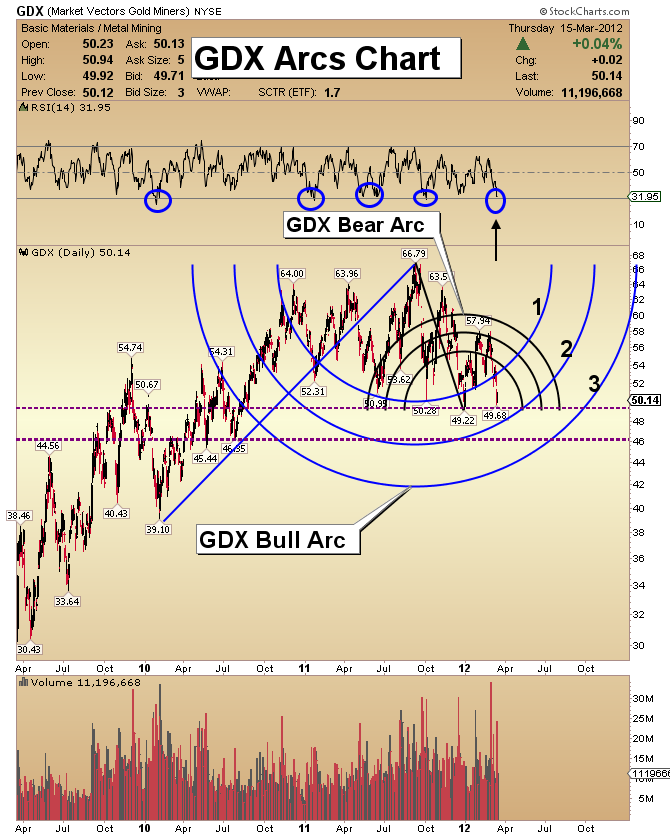
GDX Battle Of The Arcs Chart
- The Fibonacci chart I have included above this week on GDX explains the dilemma in gold stocks. The overall trend is higher, yet there is pressure on a shorter term basis.
- Most of the price action on the downside over the past year has been contained by the inner arc (arc1 on the chart) of the gold bull arc.
- The 2nd ring of the smaller “bear arc” has contained rallies in the $57-$58 price area. If you consider the position of the key RSI indicator, it’s likely that any decline in the price of GDX from here would be very modest, and should generate a much stronger rally than occurred from the $49.22 low.
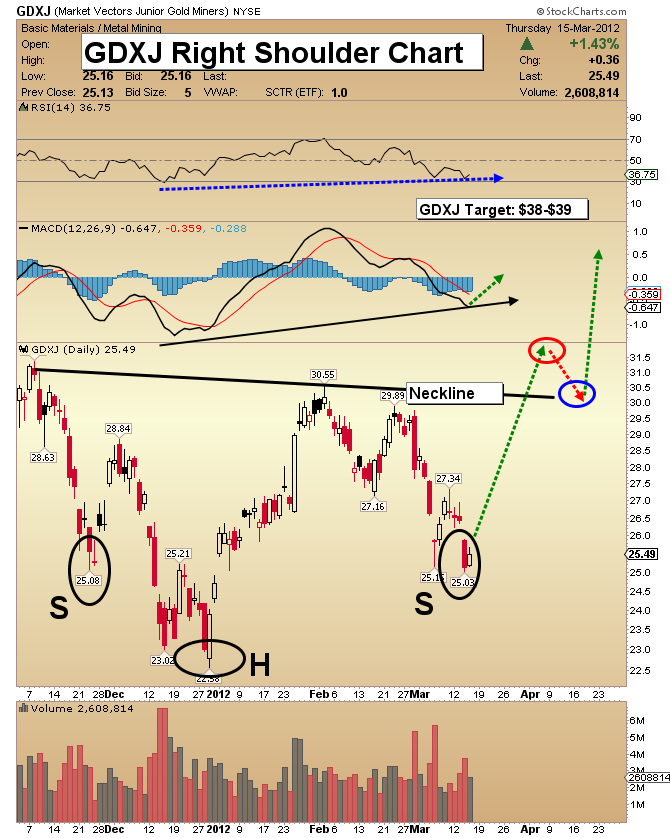
GDXJ Right Shoulder Chart
- The decline in the last week has come on less volume. The head and shoulders pattern is holding and eventually the neckline should be taken out, setting GDXJ up for much higher prices.
- The head and shoulders pattern on GDXJ is not as symmetrical as the one on the gold bullion chart, but junior gold stocks trade much more wildly than bullion does, so I wouldn’t read too much into that lack of symmetry.
- I have a $38-$39 target for GDXJ, and that should be acquired as gold rises towards $2100.
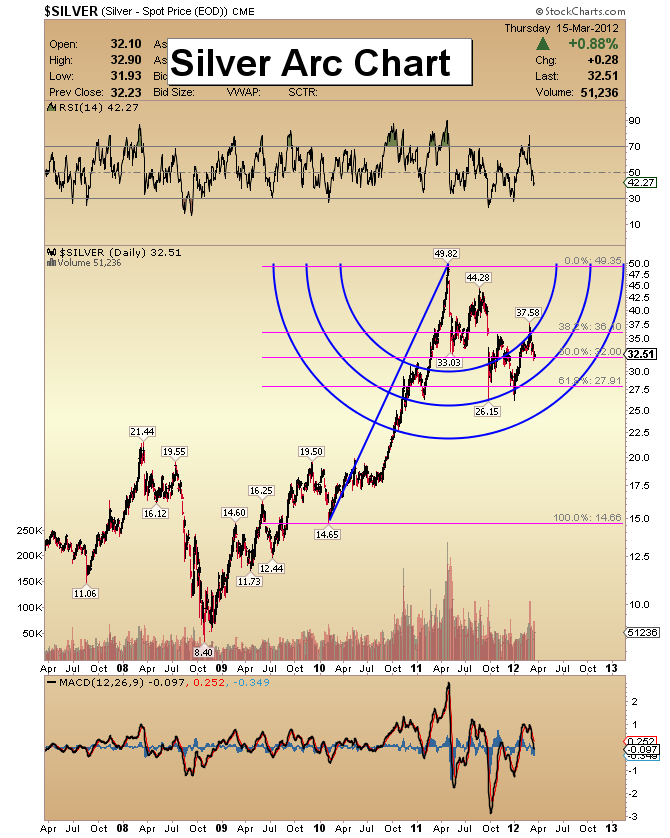
Silver Arc Chart
- Silver has held up well while gold and gold stocks have experienced significant selling pressure. Even a move down to the 3rd ring of the Fibonacci correction arc is unlikely to see silver make a new low.
- MACD continues the trend of higher lows, which is very positive, technically. As with gold, I see the correction coming to a close. My work continues to point to April-June as the key breakout months for silver. Silver fans should definitely consider adding to your silver position on current weakness!
Friday, Jul 24, 2026 Super Force Signals Unique Introduction For 321Gold Readers:
Send me an email to admin@supergoldsignals.com and I’ll send you my free “Inflation Thunder Now!” gold and silver stocks video report. I’ll also include 3 of my next Super Force Surge Signals free of charge, as I send them to paid subscribers. Thank you!
|
Stay alert for our Super Gold alerts, sent by email to subscribers,
for both the daily charts on Super Force Signals at www.supergoldsignals.com and for the 60 minute
charts at www.supergoldsignals.com
About Super
Gold Signals:
Our Surge Gold Signals are created thru our proprietary blend
of the highest quality technical analysis and many years of successful
business building. We are two business owners with excellent synergy.
We understand risk and reward. Our subscribers are generally successfully
business owners, people like yourself with speculative funds,
looking for serious management of your risk and reward in the
market.
Frank Johnson:
Executive Editor, Macro Risk Manager.
Morris Hubbartt: Chief Market Analyst, Trading Risk Specialist.
website: www.supergoldsignals.com
email:
admin@supergoldsignals.com
email: admin@supergold60.com
Mail:
1276 Lakeview Drive
Oakville, Ontario, L6H 2M8
Canada
###
Mar 16, 2012
Morris Hubbartt
321gold
Ltd

|
