Super Force Signals - A Leading Market Timing Service
We Take Every Trade Ourselves
Gold Market Stress Test Morris Hubbartt
Weekly Market Update Excerpt
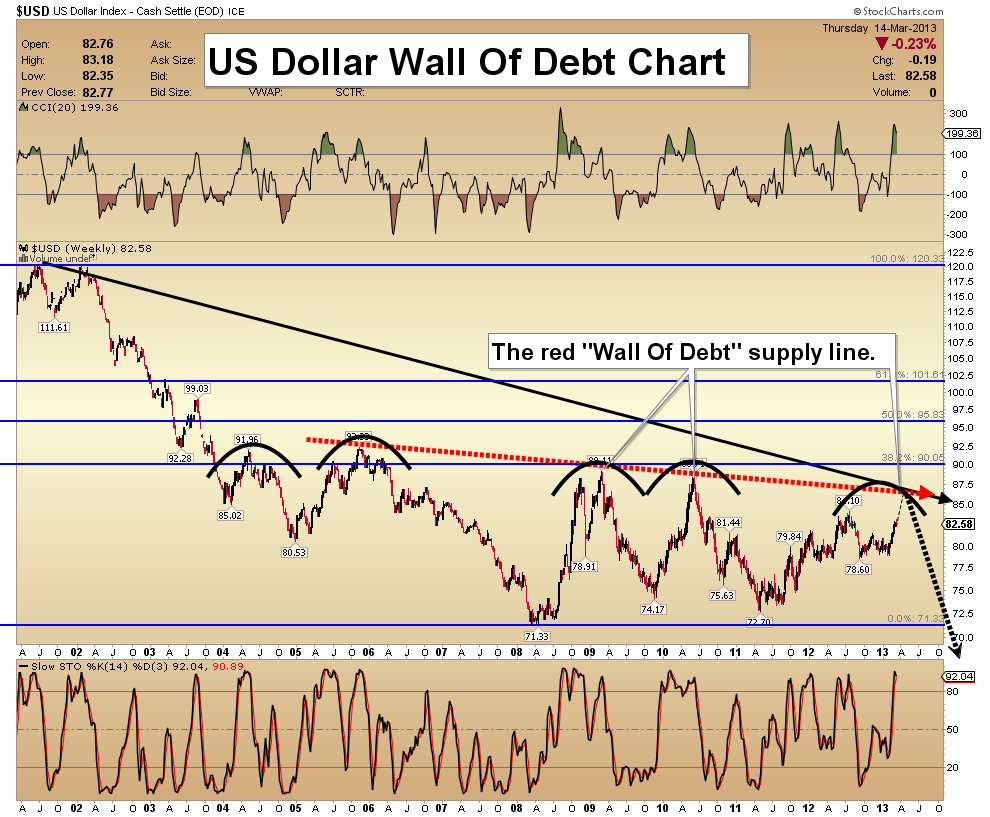
posted Mar 15, 2013 US Dollar Wall Of Debt Chart - The dollar has bounced, and many analysts are now making their case, for an even strong dollar. Fiat currencies are unlike other assets, because of the electronic printing press.
- Technically, the US dollar chart now looks likely to move up to the 86 area, where substantial overhead chart resistance resides. From there, I expect a move back to about 72, where support will likely initially hold.
- I call the dotted red trendline the “wall of debt” line, because it represents a price area where all the dollar rallies have failed, during this debt crisis.
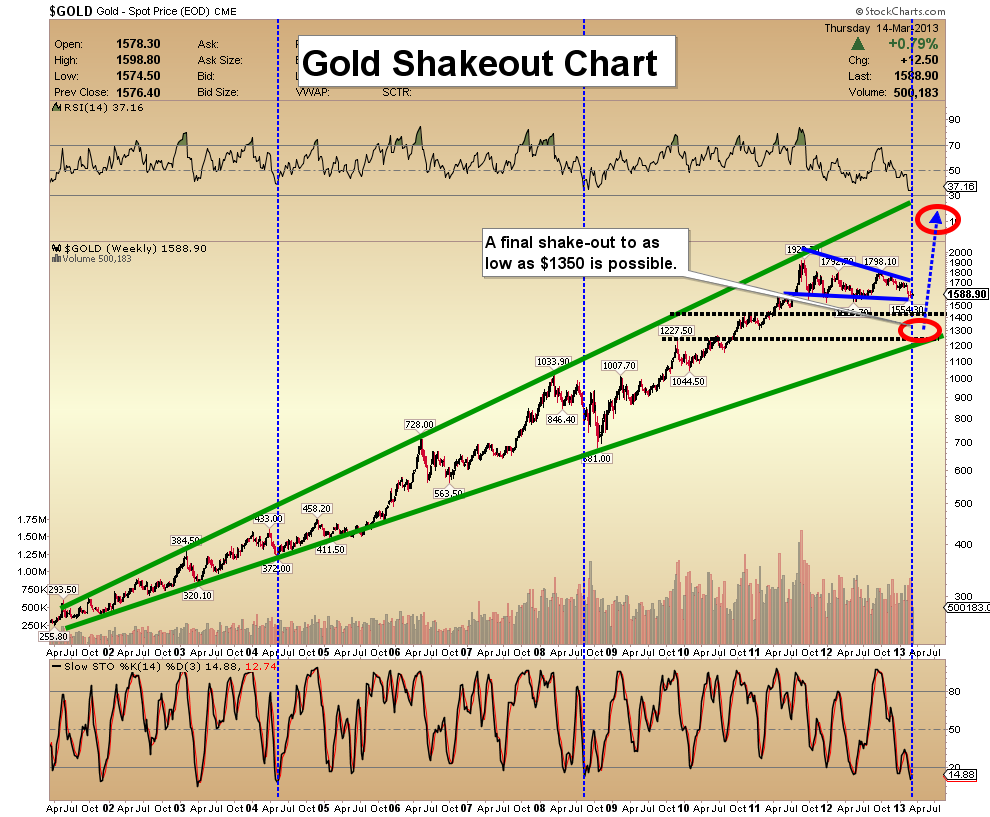
Gold Shakeout Chart - Corrections are a cleansing process. They shakeout weak investors, and get the market poised to move higher. Technically, key oscillators are already in the “basement”, but that does not mean you can ignore the possibility of one or more rounds of price weakness, before gold begins to rally.
- Note the expanding channel on this weekly chart, which portrays what is really my worst case scenario. Most bullish analysts, including myself, think the lows for gold are occurring at this point in time. Still, it’s important to look at the other side of the “price prediction coin”.
- The channel suggests that the gold price could fall to about $1350, without doing any technical damage to the big bullish picture.
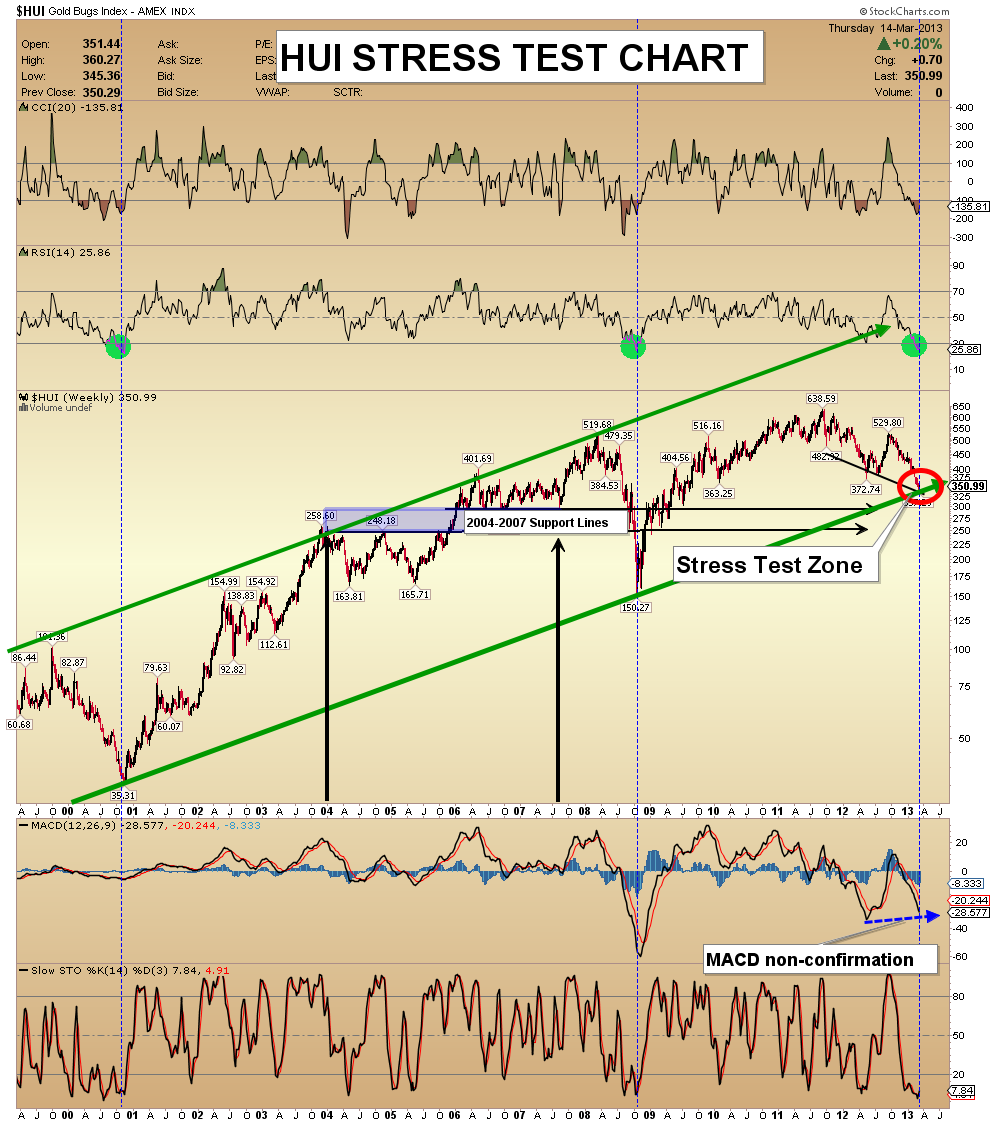
HUI Stress Test Chart - This long term chart shows the HUI index testing a major uptrend line. Gold stocks are massively oversold and key oscillators are poised to rise much higher. That being said, an oversold market can always get even more oversold.
- I believe the next big move in gold stocks will be to the upside. Gold stocks are known for volatility, so the best strategy is to buy a little bit on weakness, so more can be bought on extreme weakness.
- If the trend line breaks decisively, investors should not panic. Purchase some put options as insurance, but try to buy a bit more stock, too!
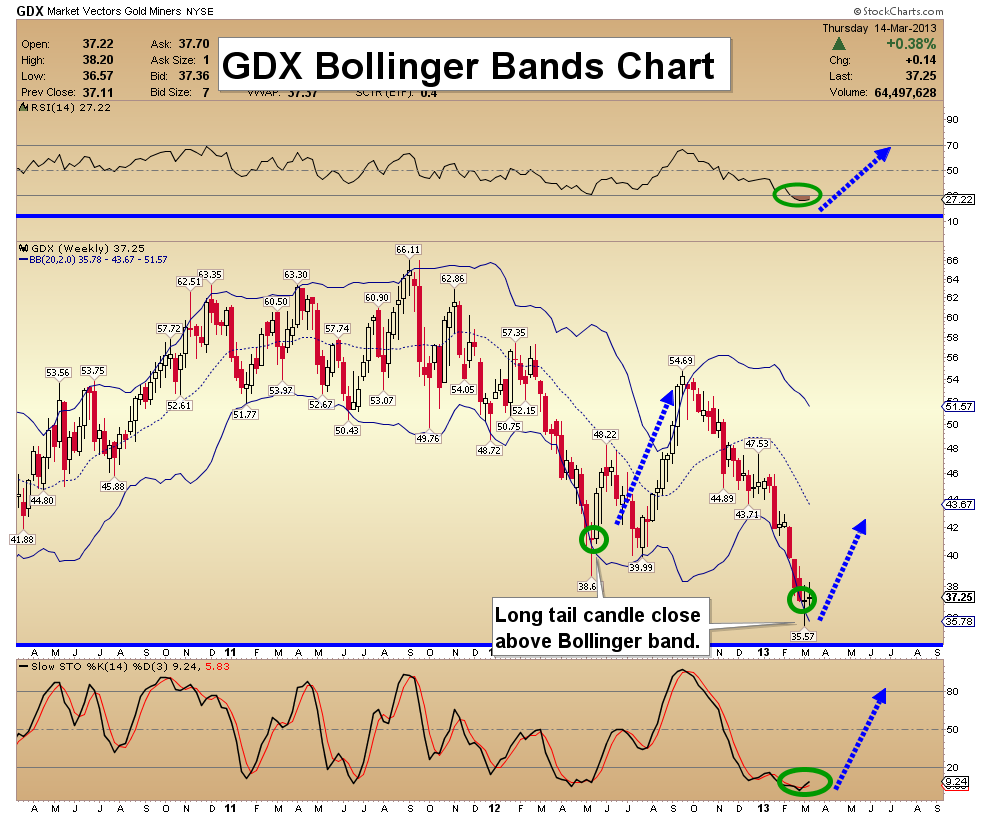
GDX Bollinger Bands Chart - This weekly chart is probably approaching a “moment of truth”. Sentiment indicators suggest a huge opportunity exists for this sector, but this market is not out of the woods.
- The last time the market was set-up like this, GDX rallied over 40%. I am equally bullish now, but it always makes sense to be prepared for another nasty shakeout, prior to the next major up-leg getting underway.
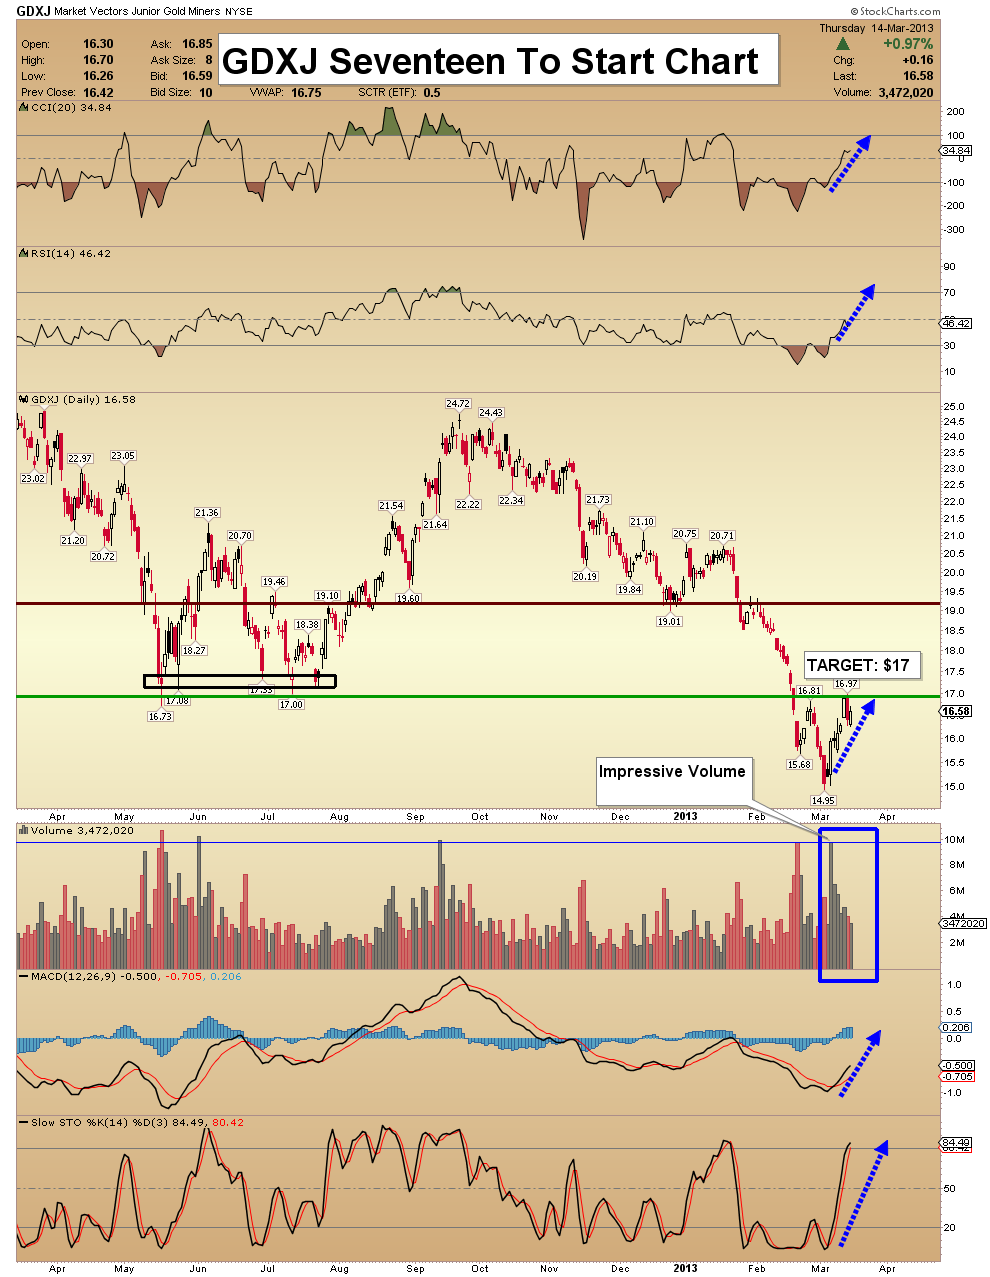
GDXJ $17 To Start Chart - The $17 target area I mentioned a week ago has been acquired. Volume looks quite supportive, for even greater gains, after a pause in the current price area.
- A lot of technical damage has been done, and the rise to $17 is just a start, but it’s a welcome one!
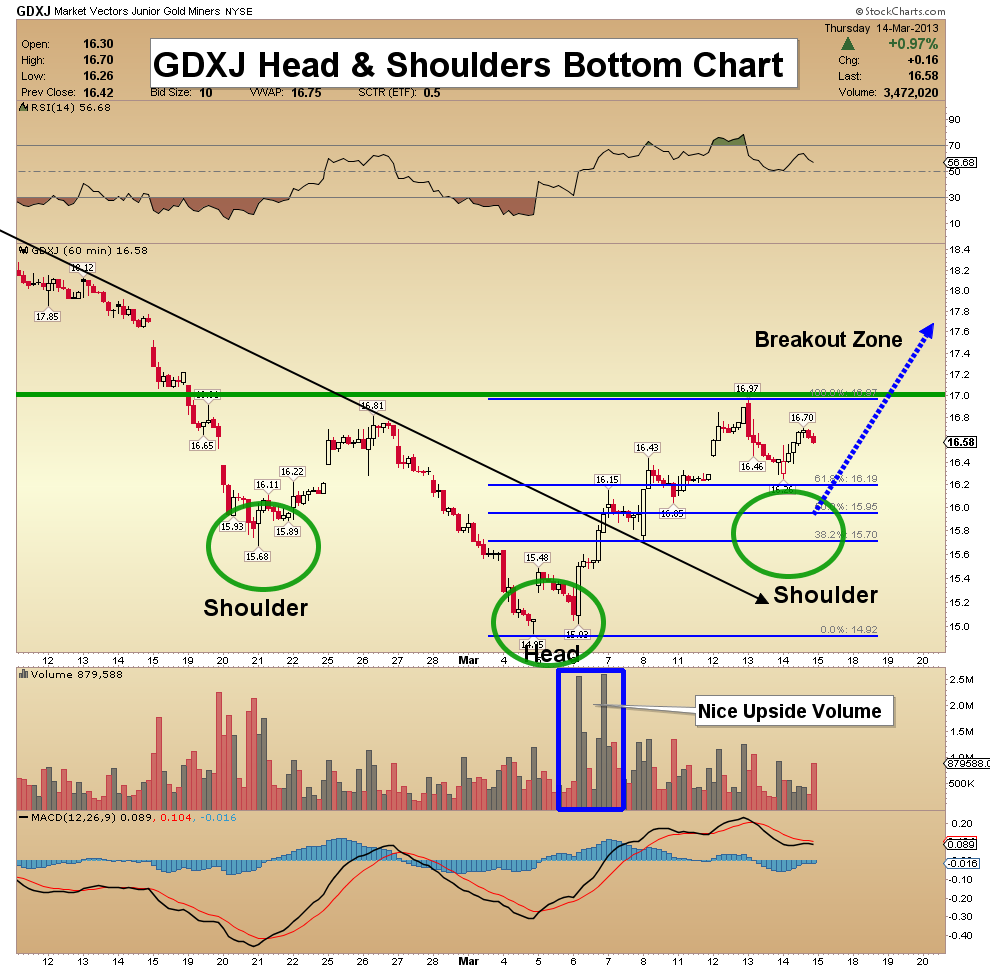
GDXJ H&S Bottom Chart - This 60 minute chart shows the remarkable “power volume” bar that occurred in the first week of March. I'm always impressed with heavy volume that occurs after a low is made.
- It represents a changing of the guard, at least for the short term. Since my initial $17 area target was acquired, the volume on the pullback has been subdued.
- There is a nice inverse head and shoulders in play now, targeting the $18 zone. I am looking for a move through $17 to come on heavy volume. That should confirm a breakout, from this bullish price pattern.
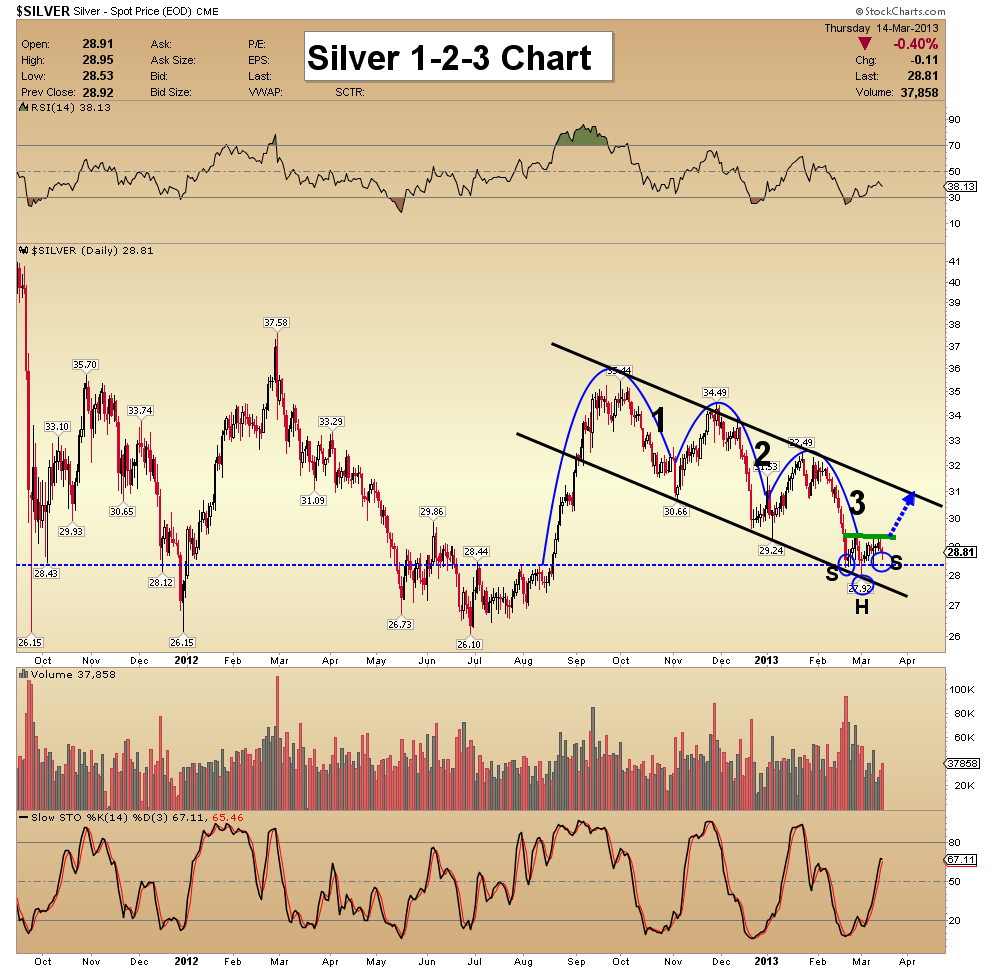
Silver 1-2-3 Chart - Silver is in the “correction zone”. This price area served as a platform for a sizable rally, last fall. Fundamentally, silver is a solid asset to own, poised to benefit from the ongoing industrialization in Asia.
- Technically, there is a small inverse head & shoulders pattern in place on this daily chart. Silver also has a classic three-wave correction in play, and big rallies can occur from this type of set-up.
- We all need a rally, even more than we want one, so patience is our greatest ally now. Silver must take out the downtrend line in the $31 area, to start a trending move higher!
Friday, Jul 3, 2026 Super Force Signals Unique Introduction For 321Gold Readers:
Send me an email to admin@supergoldsignals.com and I’ll send you my free “Inflation Thunder Now!” gold and silver stocks video report. I’ll also include 3 of my next Super Force Surge Signals free of charge, as I send them to paid subscribers. Thank you!
|
Stay alert for our Super Gold alerts, sent by email to subscribers,
for both the daily charts on Super Force Signals at www.supergoldsignals.com and for the 60 minute
charts at www.supergoldsignals.com
About Super
Gold Signals:
Our Surge Gold Signals are created thru our proprietary blend
of the highest quality technical analysis and many years of successful
business building. We are two business owners with excellent synergy.
We understand risk and reward. Our subscribers are generally successfully
business owners, people like yourself with speculative funds,
looking for serious management of your risk and reward in the
market.
Frank Johnson:
Executive Editor, Macro Risk Manager.
Morris Hubbartt: Chief Market Analyst, Trading Risk Specialist.
website: www.supergoldsignals.com
email:
admin@supergoldsignals.com
email: admin@supergold60.com
Mail:
1276 Lakeview Drive
Oakville, Ontario, L6H 2M8
Canada
### Mar 15, 2013
Morris Hubbartt
321gold Ltd
 |
