Super Force Signals - A Leading
Market Timing Service
We Take Every Trade Ourselves
Nasdaq & Gold Technicals Update
Morris Hubbartt
Weekly Market Update Excerpt
posted Mar 11, 2011
US Stock Market
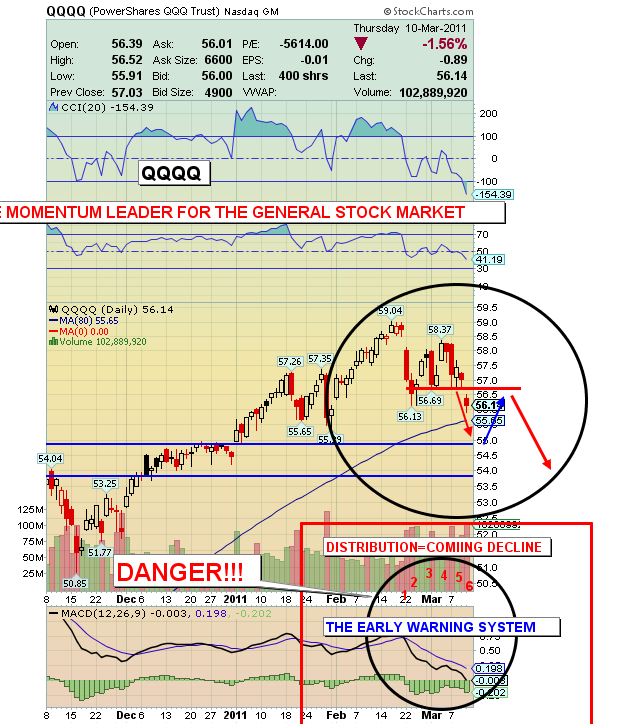
QQQQ (Nasdaq Proxy) 6 Month Chart
QQQQ Chart Analysis
-
On Feb 15th I issued strong a sell and short sale signal for SPY, the S&P500 proxy. Today I want you to look at the Nasdaq, which Jim Rogers is shorting. The Nasdaq is the momentum/action sector of the general stock market.
-
I recommend you short the SP500 to protect your gold stock portfolio. This week, as the general stock market took another hit, the decline also did indirect but significant damage to your gold stocks. I would urge those of you who have not yet taken protective action by shorting the SPY or QQQQ, to do so as I issue my sell and short sale signals.
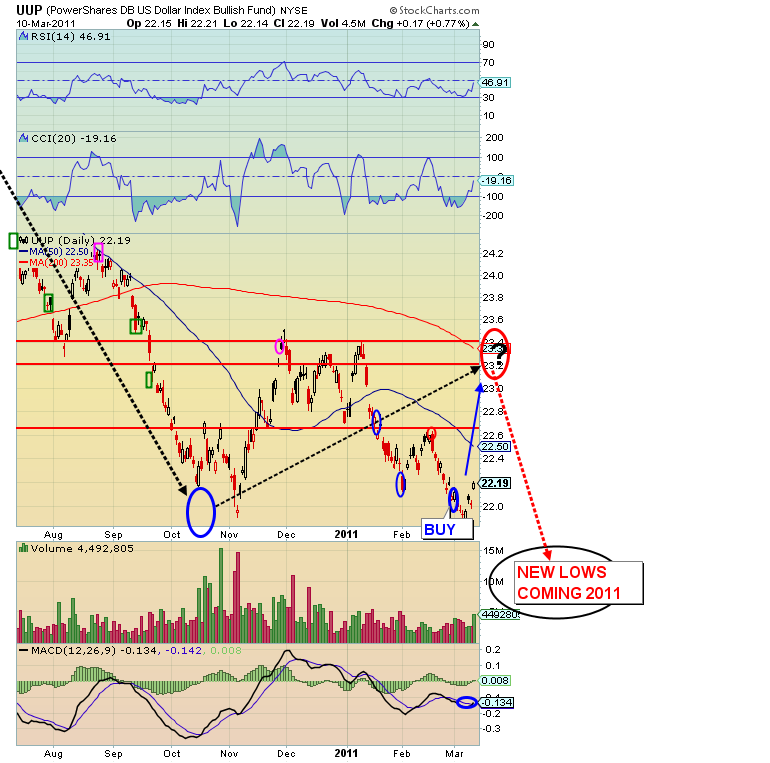
UUP (US Dollar Proxy) Chart
UUP (USD Proxy) Chart Analysis:
-
I am looking for a weak volume rally in the dollar, prior to a horrible panic coming later in 2011. The best way to protect yourself from the incredible damage caused by this panic is: physical Gold and Silver. This size of the panic is going to catch not just a few, but most of the world, completely off guard.
Gold and Precious Metals
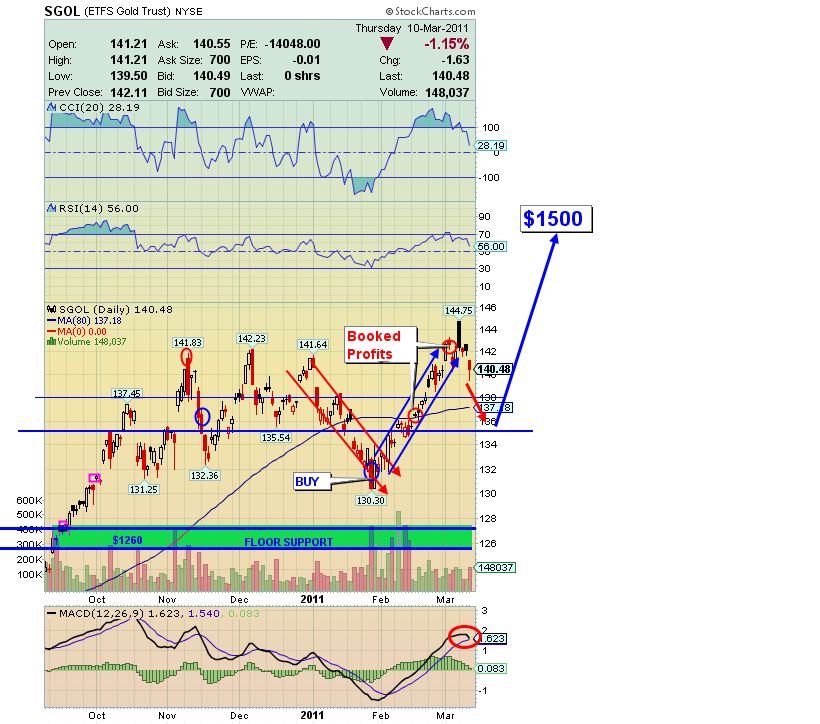
SGOL (Bullion Proxy) 6 Month Chart
SGOL 6 Month Chart Analysis
-
Short term: My short term outlook is you are going to experience a painful correction that could see Gold fall to 1325. I recommend you engage in substantial buying in the 1350 area, because in every correction, central bank buy programs, led by Asia, are going to put higher and higher support floors into this market.
-
The central banks can act in the market without announcing their intended buys, adding to the difficulty in predicting exactly where the ultimate bottom occurs. The global central bank buy programs could halt a fall in the gold price well before any technical support level or target price is reached.
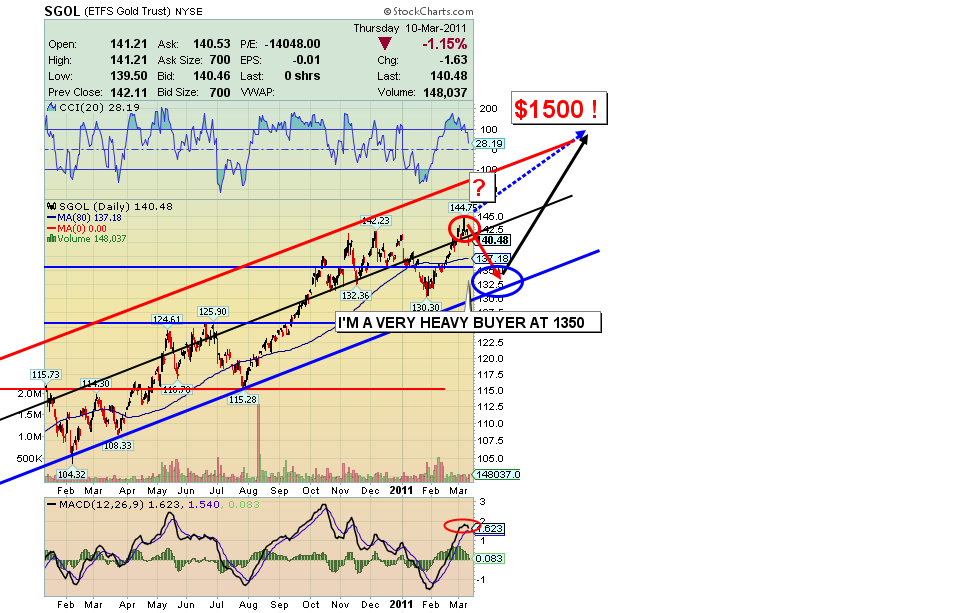
SGOL 14 Month Chart
SGOL Chart Analysis
-
My recommendation on all precious metal positions is to hold some positions that you will not sell. My core position recommendation, which I apply to myself, is 65%. Think about the phrase, “Deep Underground Storage”. It’s time to act on that thinking.
-
I have used every major Super Force Buy signal to add to my own physical position, for many corrective cycles. As Gold goes higher and higher, you should be trading less of your position and holding more and more as a physical core. Your number one investment goal should be: Enlarging your physical gold core position.
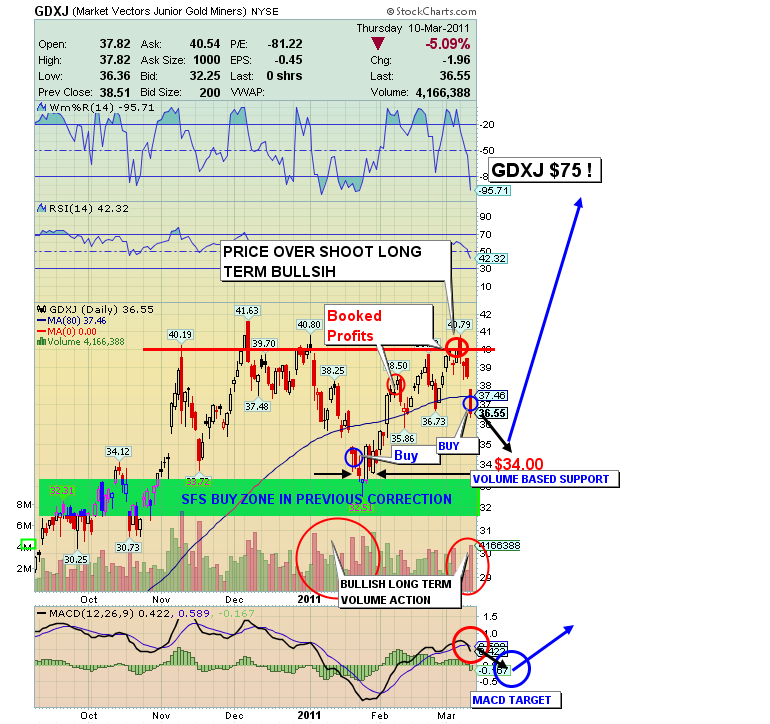
Gold Juniors GDXJ Chart
GDXJ Chart Analysis:
-
Short Term: I see the next great buying opportunity in Gold juniors now in play, while the US stock market sinks in a serious down move. My work is suggesting a major correction is coming in the general stock market, far bigger than the 10% feel-good number currently being bandied about, by the CNBC talking heads. For many analysts, 20% down earns the market a label of BEAR MARKET. This is a serious situation. The correction could take the stock market down by at least 15-20%.
-
So, unfortunately, I am projecting a hard hit for juniors, well beyond the serious discomfort most of you are already feeling. The good news is the move down will be followed by an up move on huge volume, taking gold juniors to record highs.
-
The sound strategy now is to buy GDXJ (or your favorite individual juniors) as it corrects in price, and buy aggressively right down to the strong volume supported zone, which I have highlighted on the GDXJ chart as the $34 price area. This move down is probably the last great buying opportunity of your lifetime, for gold juniors!
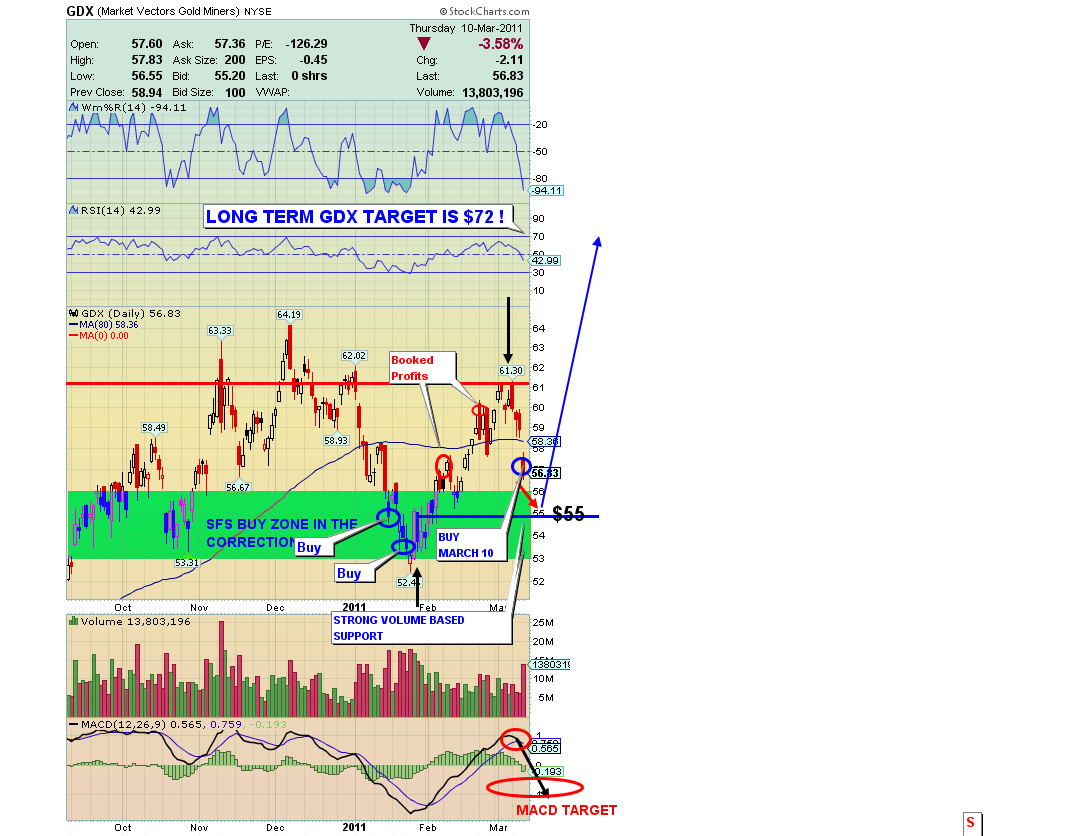
GDX 6 Month Chart
GDX 6 Month Chart Analysis
-
On March 10 (yesterday) I issued a new buy signal for GDX, at $56.60. My buy signals are created mainly through combining the technical action of my SFS oscillator, weak price, and soft volume.
-
Short Term: My indicators are warning of a dangerous general stock market decline, and this will create a vicious tug of war for GDX. I see GDX (and most senior/intermediate gold stocks) falling initially as the general stock market falls, but then, while the general stock market keeps falling, GDX rockets higher!
-
Long Term: The GDX performed decently in the last year, rising a respectable 30%. The story that I repeat to readers on a daily basis is that like the juniors, the senior and intermediate Gold stocks are drastically undervalued. Gold bullion’s performance has far exceeded your Gold Stocks, at least for most investors. Before this Bull Market is over, it’s going to be your Gold Stocks that are drastically outperforming your bullion.
-
GDX has strong volume support in the $55 area. Price could easily go back to 55 in this stock market correction, but when looking at the next 12 months and beyond, GDX could double in price, and more!
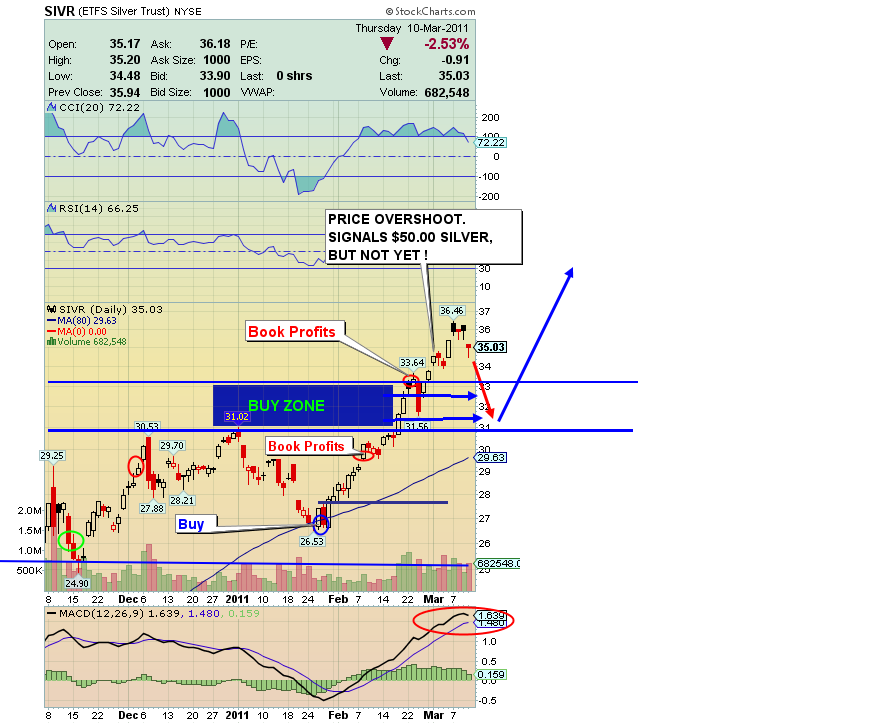
SIVR (Silver Proxy) 6 Mth Chart
SIVR Chart Analysis
-
On Feb 23rd, I gave you a profit taking alert for SIVR, at $33.26. My suggestion is that for every dollar you invest in silver stock, at the same time buy one dollar of SIVR or physical silver. This strategy is an ideal way to build wealth over time, and is exactly what the richest people in my circle are doing.
-
Owning the physical product is an absolute necessity. As I get fresh buy signals in silver, I put more money in physical silver. My latest buys are at $28. Use my buy signals to buy SIVR, and to add to your physical Silver inventory!
Friday, Jul 3, 2026 Super Force Signals Unique Introduction For 321Gold Readers:
Send me an email to admin@supergoldsignals.com and I’ll send you my free “Inflation Thunder Now!” gold and silver stocks video report. I’ll also include 3 of my next Super Force Surge Signals free of charge, as I send them to paid subscribers. Thank you!
|
Stay alert for our Super Gold alerts, sent by email to subscribers,
for both the daily charts on Super Force Signals at www.supergoldsignals.com and for the 60 minute
charts at www.supergoldsignals.com
About Super
Gold Signals:
Our Surge Gold Signals are created thru our proprietary blend
of the highest quality technical analysis and many years of successful
business building. We are two business owners with excellent synergy.
We understand risk and reward. Our subscribers are generally successfully
business owners, people like yourself with speculative funds,
looking for serious management of your risk and reward in the
market.
Frank Johnson:
Executive Editor, Macro Risk Manager.
Morris Hubbartt: Chief Market Analyst, Trading Risk Specialist.
website: www.supergoldsignals.com
email:
admin@supergoldsignals.com
email: admin@supergold60.com
Mail:
1276 Lakeview Drive
Oakville, Ontario, L6H 2M8
Canada
###
Mar 11, 2011
Morris Hubbartt
321gold
Ltd
|
