Super Force Signals - A Leading
Market Timing Service
We Take Every Trade Ourselves
USD Meltdown Is Your Gold Advantage
Morris Hubbartt
Weekly Market Update Excerpt
posted Mar 9, 2012
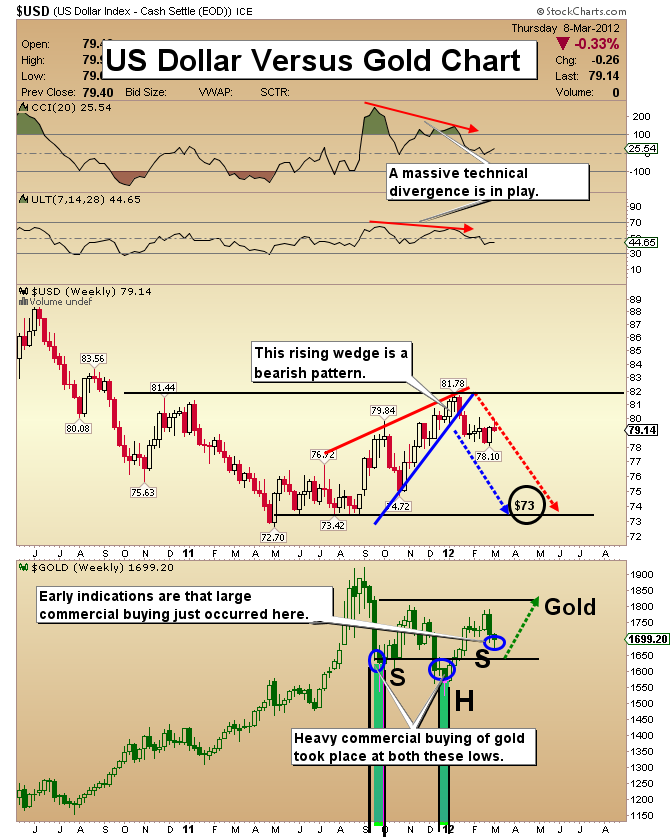
US Dollar Versus Gold Chart
- The dollar is only in the middle stages of what appears to be a very long term bear market, and this bear market is stealing the purchasing power of American citizens.
- The Federal Reserve is out of control. Investors need to protect themselves from increasingly negative interest rates. Your savings and income are being severely diluted, by both the printing press and stealth inflation.
- The best thing to do in preparation for any financial crisis is to own physical gold. It should be your largest holding. Asian physical buyers are accumulating gold at these highly attractive prices. In the gold market, a good motto is, “Do as the Asians do!”
- The dollar could barely rally while Greece almost imploded, when it should have skyrocketed. There is a large technical divergence in play on the US dollar chart. Both the CCI and Ultimate Oscillator lost momentum while the dollar price went higher. Dips on the dollar should not be bought, and rallies should be sold.
- The rising wedge delivered a price breakdown at resistance. On meaningful strength, the dollar is met with stout selling and shorting from large commercial traders.
- The dollar’s great long term vulnerability is gold’s advantage.
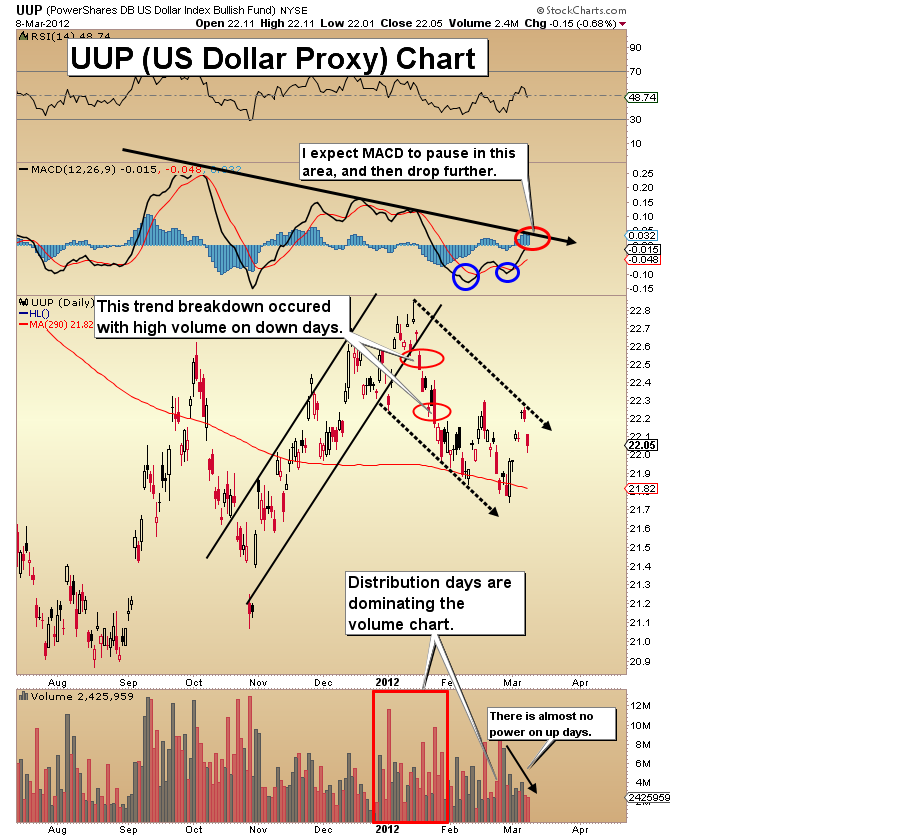
UUP (US Dollar Proxy) Chart
- The dollar, as shown on this UUP dollar proxy chart, has moved up in the last week, but the volume is absolutely terrible. There is little fundamentally-based buying behind this move. If the dollar has limited upside potential, that likely means the gold correction is almost completed.
- The MACD indicator shows a significant non-confirmation with the UUP price. In January, UUP surged above the October highs, but MACD came nowhere close to making a new high.
- Technically, the US dollar is terribly weak. Sell some dollars and buy some physical gold.
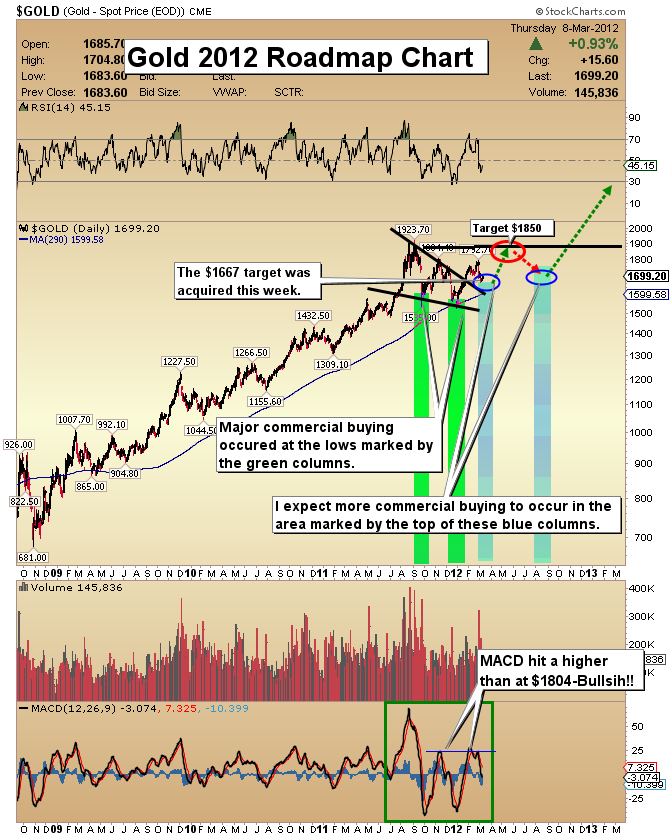
Gold 2012 Roadmap Chart
- Gold touched my projected $1667 target, although price still could go slightly lower. What won’t be known until after Friday’s market close is the actions of the commercial traders. Those actions will be shown clearly in today’s COT Report.
- My projected model suggests that commercial buyers have stepped up by covering shorts and have been buying heavily since the correction began last week.
- Once this correction ends, my short term target is $1850. I will be doing a video Friday afternoon reviewing the COT Report after the market close. I’ll send it to everyone in the gold community who requests it. Send me an email at trading@superforcesignals.com, and I’ll send it to you.
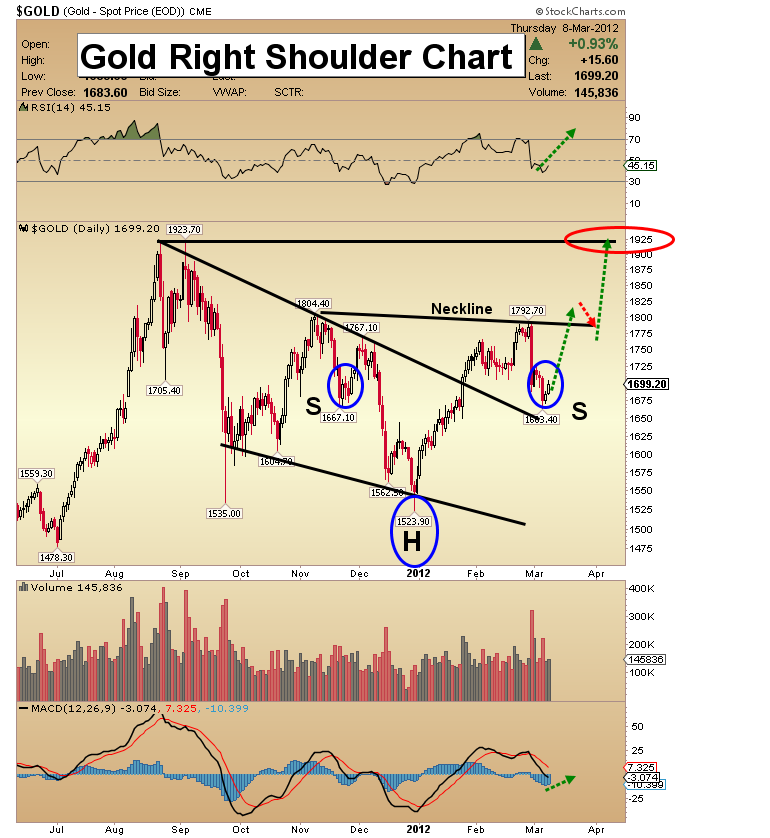
Gold Right Shoulder Chart
- The biggest news for the gold community in the last couple of weeks was probably Ben Bernanke’s speech, which caused investors to sell gold in a panic. The price plunged nearly $100 an ounce and started a correction.
- I have been an advocate and will continue to be an advocate for owning physical metal. My work suggests gold $2100 in the next few months and $2400-2500 late in 2012.
- Please note how close to the upper trendline of the wedge pattern the price of gold came as it built what appears to be the right shoulder low of a head & shoulders pattern.
- For the gold price, I think the bottom is either in place, or very close to being there.
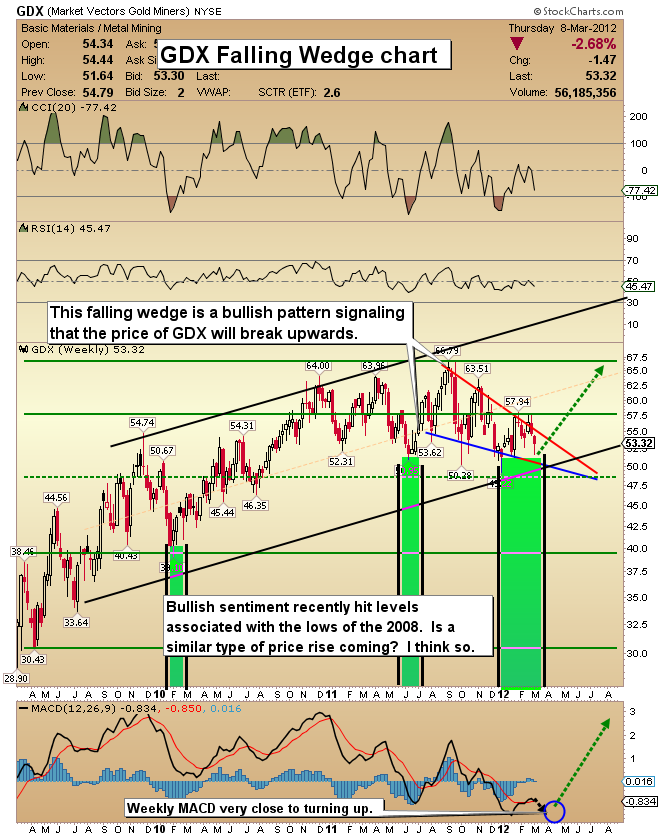
GDX Falling Wedge Chart
- Investors have become exasperated with their gold stocks. After not seeing solid gains for nearly a year, and longer in many cases, investors are discouraged. Before you throw in the towel, allow me to point out a couple of positive things on the chart.
- First, although the action in gold stocks is discouraging, sentiment indicators have not been this favorable since 2008, when GDX was trading under $20! That should give you an idea of what the upside potential could be for your gold stocks.
- The long term trend of this ETF is still up. The falling wedge is a bullish pattern signaling a price break upwards is imminent. Silver bullion and gold bullion have already shown break-outs from similar patterns, so there’s a good chance that the same thing occurs with GDX.
- The MACD indicator looks as though there could be one small dip down, and from there a major rally should occur.
- The long corrective period appears to have run its course, and in the process has worn down most precious metals stock investors. I see the potential for a slight move lower, but that is overshadowed by huge upside potential.
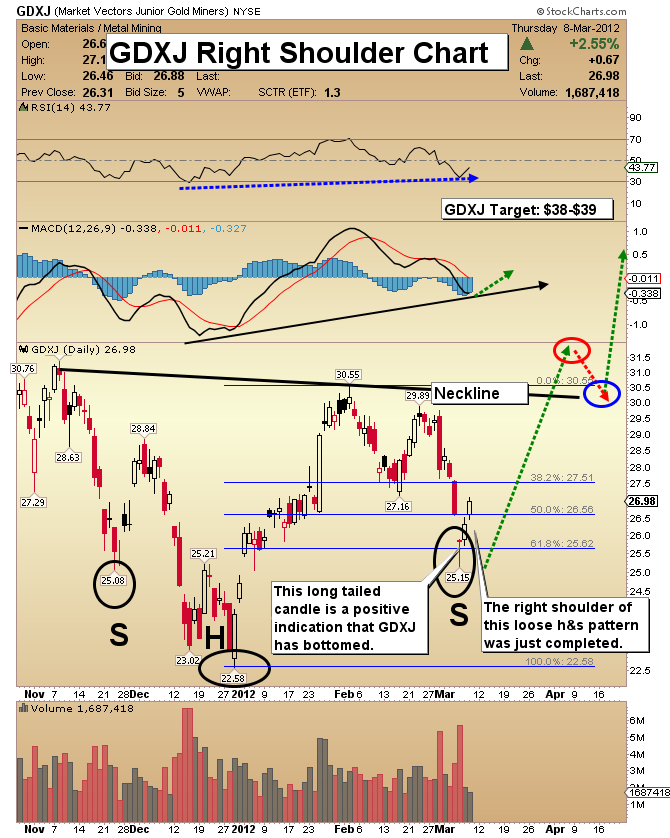
GDXJ Right Shoulder Chart
- In December, I highlighted silver as my asset of choice. Since then, silver rallied 42% in several weeks. Currently it is undergoing a correction. I still like silver, but right now my asset of choice is the gold juniors sector. I am forecasting that GDXJ will lead the entire precious metals higher during the next bull leg.
- The right shoulder target that I have been looking for has been acquired. On Tuesday, I issued a fresh buy signal for GDXJ at $25.32. Note the long tailed candle that just appeared. I think it marks the right shoulder low of a very loose head & shoulders pattern. The MACD indicator is also in a solidly bullish posture.
- Wedges and h&s patterns are in play across the entire precious metals sector. Some will play out better than others, but it is very good news to see so many bullish price patterns in play at the same time.
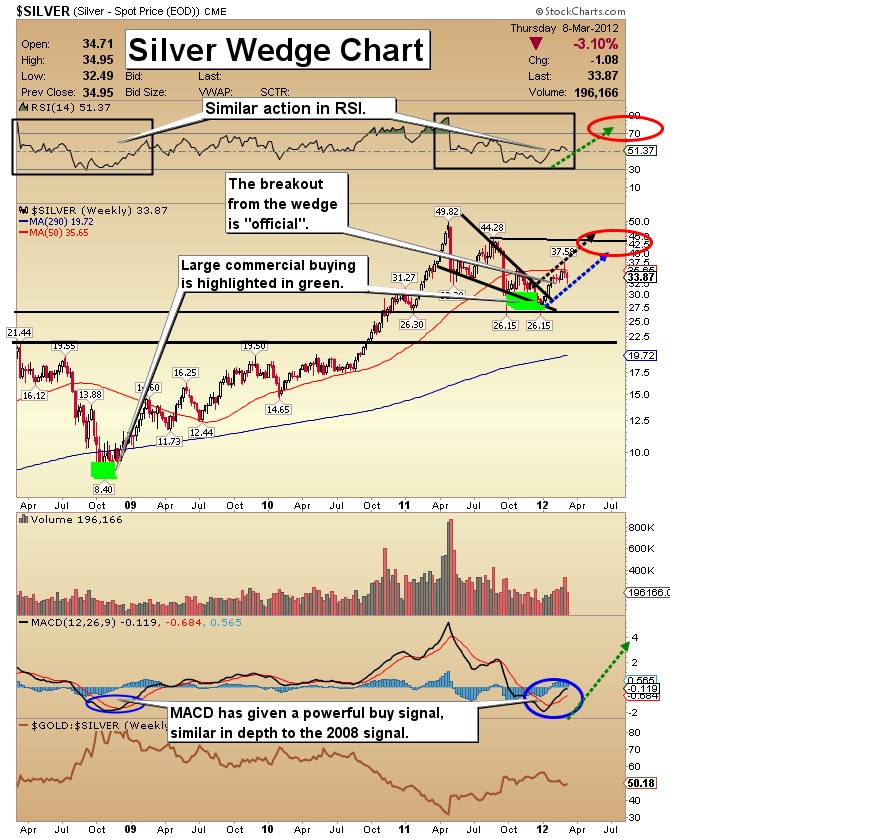
Silver Wedge Chart
- Silver's price decline has likely also triggered fresh long side interest from commercial buyers. Speculation seems to have dried up and the source of buying is coming in physical purchases and the smart money commercials.
- On this weekly chart, a potential new uptrend is highlighted with dotted blue and black trend lines. I have a $42-$45 price target for silver. If you are bullish on silver, keep in mind that the silver price has a well-earned reputation for extreme volatility!
Friday, Jul 3, 2026 Super Force Signals Unique Introduction For 321Gold Readers:
Send me an email to admin@supergoldsignals.com and I’ll send you my free “Inflation Thunder Now!” gold and silver stocks video report. I’ll also include 3 of my next Super Force Surge Signals free of charge, as I send them to paid subscribers. Thank you!
|
Stay alert for our Super Gold alerts, sent by email to subscribers,
for both the daily charts on Super Force Signals at www.supergoldsignals.com and for the 60 minute
charts at www.supergoldsignals.com
About Super
Gold Signals:
Our Surge Gold Signals are created thru our proprietary blend
of the highest quality technical analysis and many years of successful
business building. We are two business owners with excellent synergy.
We understand risk and reward. Our subscribers are generally successfully
business owners, people like yourself with speculative funds,
looking for serious management of your risk and reward in the
market.
Frank Johnson:
Executive Editor, Macro Risk Manager.
Morris Hubbartt: Chief Market Analyst, Trading Risk Specialist.
website: www.supergoldsignals.com
email:
admin@supergoldsignals.com
email: admin@supergold60.com
Mail:
1276 Lakeview Drive
Oakville, Ontario, L6H 2M8
Canada
###
Mar 9, 2012
Morris Hubbartt
321gold
Ltd

|
