Super Force Signals - A Leading Market Timing Service
We Take Every Trade Ourselves
Gold Double Bottom & Dow Warning Morris Hubbartt
Weekly Market Update Excerpt
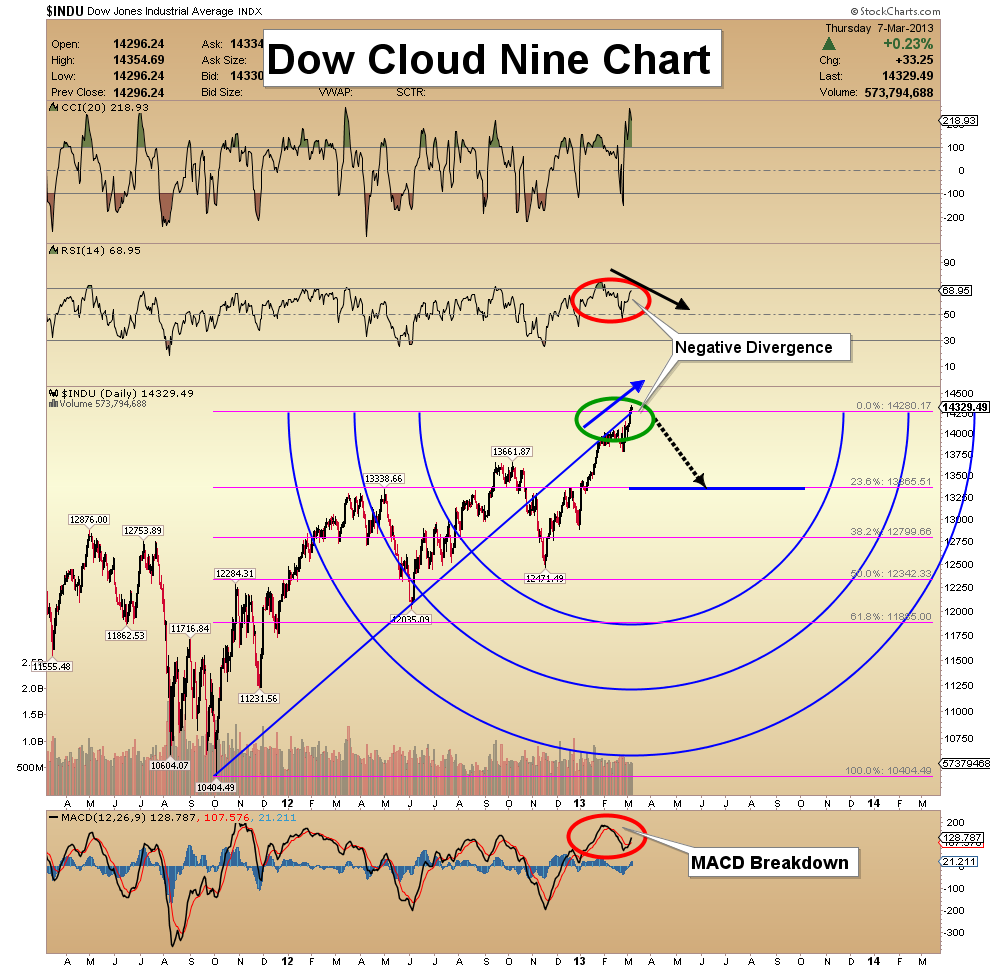
posted Mar 8, 2013 Dow Cloud Nine Chart - The stock market has continued higher. On Tuesday, I issued my largest profit taking signal to date, at 14,260. Technically, the market needs a correction. The longer the rally goes without one, the greater the risk of a substantial decline, or even a crash.
- My view is we will get the correction. It will likely happen sooner rather than later. Key technicals are not confirming the recent high for the move.
- The action of the RSI oscillator is concerning. One indicator that is flashing what could be called a “screaming” sell signal, is the CCI. There is a spike to the 250 level, in play now.
- The bottom line is that there is a red technical sky for Dow sailors!
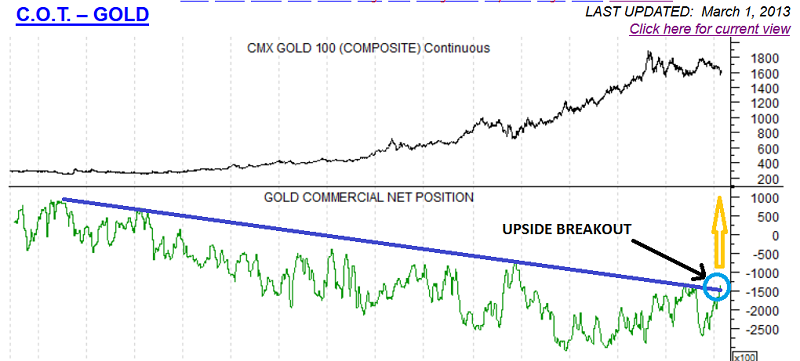
Gold COT Signals Chart - The “smart money” commercial traders are coming back to gold, in a big way. This chart from Sentiment Trader shows a key breakout in their position, to the upside.
- That breakout means the commercial traders may be moving to a much more bullish stance, for quite a long period of time.
- There is arguably a head and shoulders bottom pattern on the COT position of the commercial group, and I’ll be discussing that ultra-bullish situation, in a video report to subscribers this week-end.
Gold Dual Triangle Chart - With strong buying support from commercial traders, and a bullish “dual triangle” technical formation, this market is set for a strong performance. A symmetrical triangle is usually formed during a consolidation period.
- In the case of gold, the consolidation has gone on now for nearly a year and a half. The larger the base is, the greater the rise out of it.
- There are actually two triangles in place, and gold has just staged a near-perfect pullback to the top of one of them.
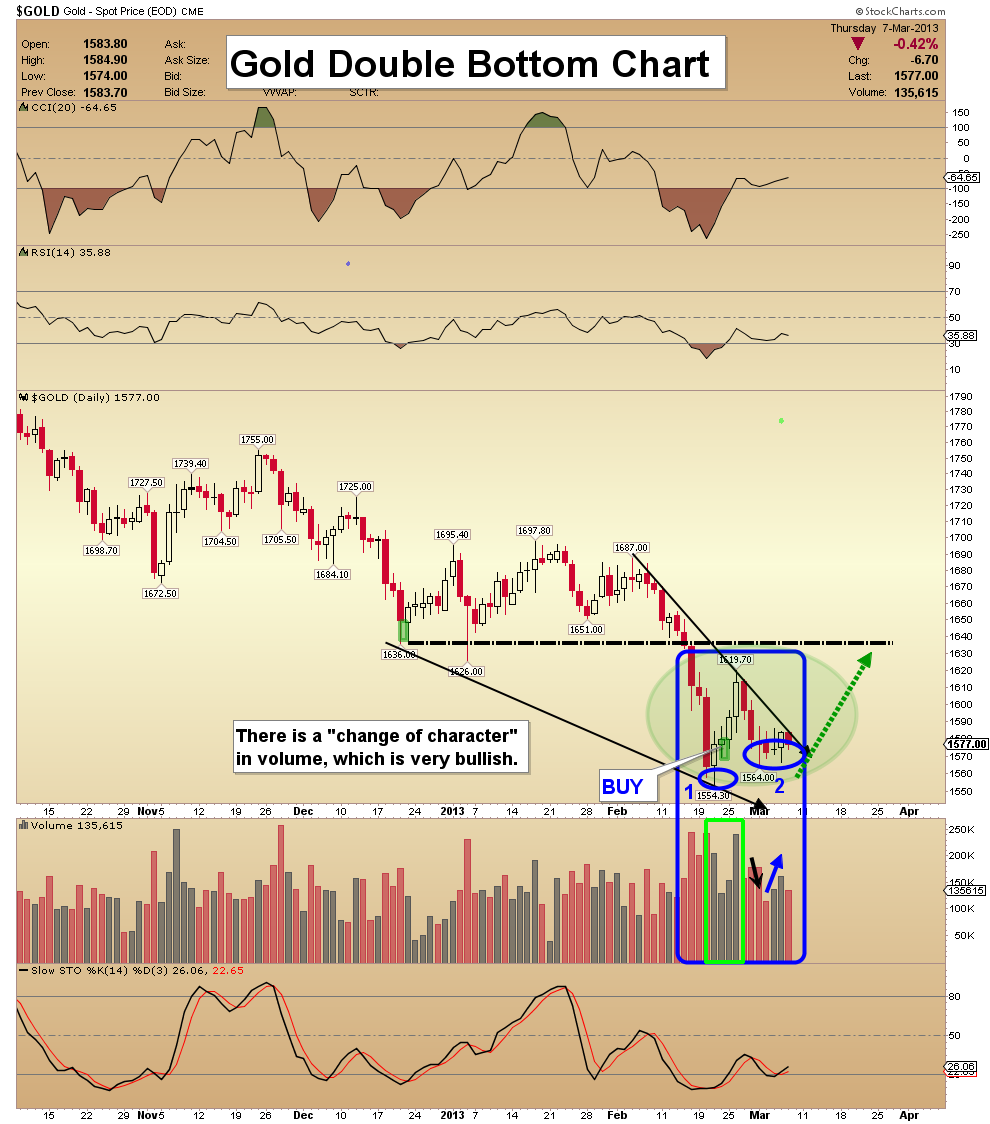
Gold Double Bottom Chart - The gold market is under some pressure, but it always makes sense to be prepared to buy lower than where it feels most comfortable.
- The volume patterns are very encouraging. If the uptrend is ready to begin, volume patterns will continue to improve, too.
- There is a small double bottom pattern in play. Note the sharp rise in volume on the first bottom, and the dull trading on the second one.
- That’s classic double bottoming action!
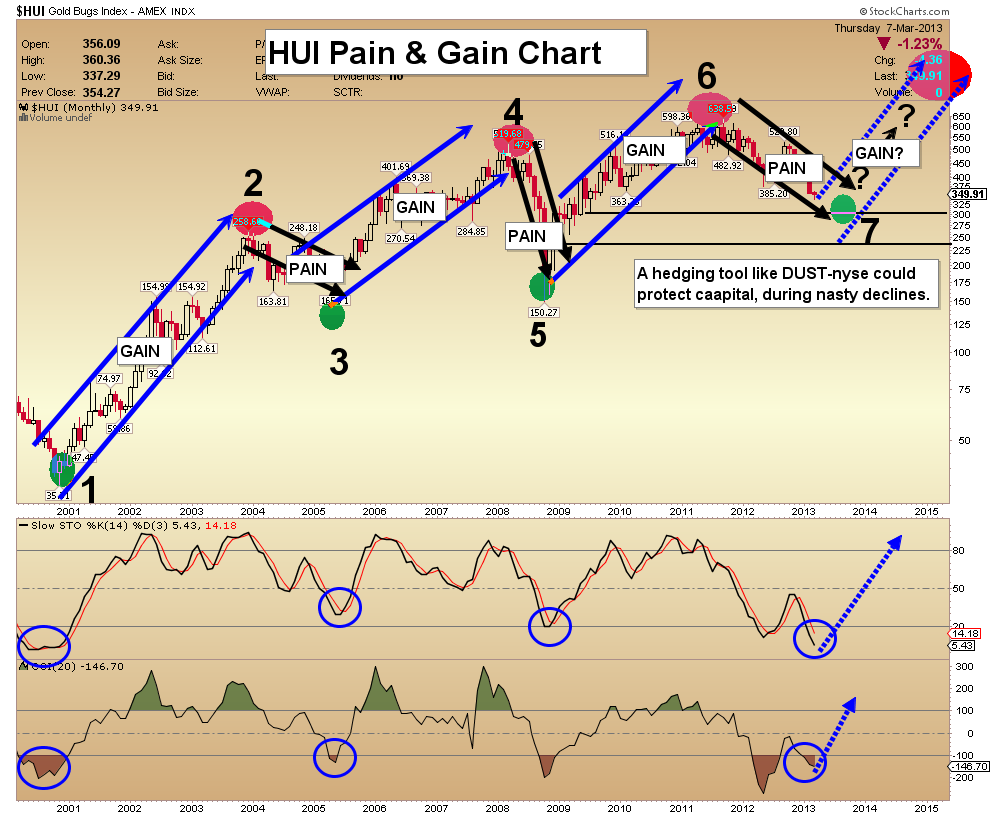
HUI Pain & Gain Chart - The gold stocks sector is under much more selling pressure than bullion is, due to what appears to be sizable hedge fund forced liquidation. Also, central banks buy bullion for their reserves, not gold stocks.
- A worst case scenario would probably put the HUI in the 250-300 area. Investors could use tools like DUST-nyse, to hedge up to 20% of their gold stock portfolios. That’s the position I’m carrying.
- If the sell-off continues, profits can be booked on the hedge position, and used to buy the highest quality mining shares. This long term chart also shows where gold stocks have the potential to trade in the next few years, which is substantially higher.
- The other thing that is necessary to survive and thrive in this market, is cash. For maximum comfort, I like to keep cash levels in my gold stocks portfolio near 20%.
- I believe that gold bullion is on the verge of moving higher, and that should eliminate most of the bearish technical set-ups that are currently on many gold stock charts!
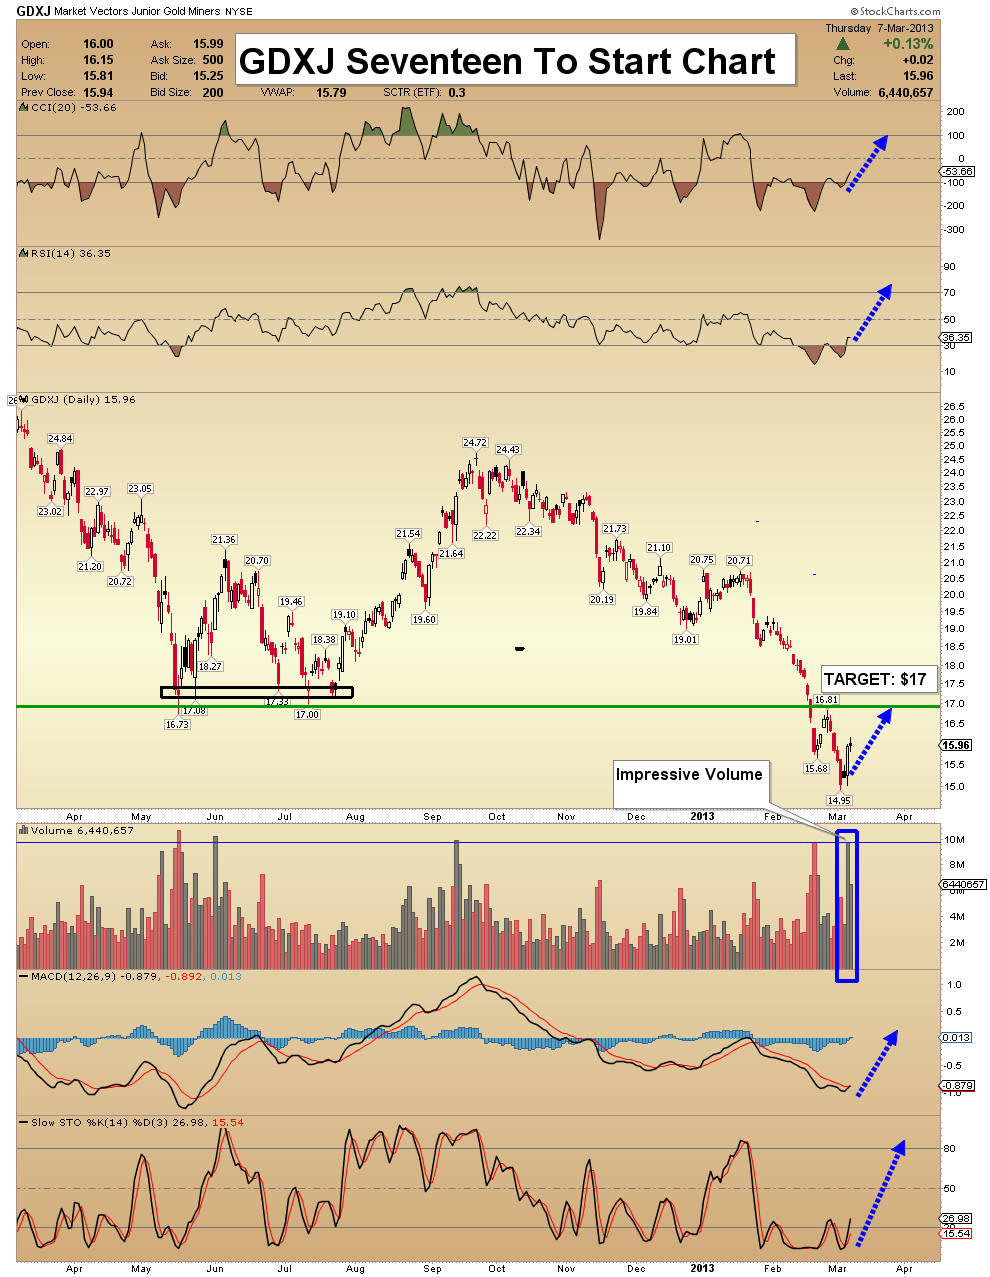
GDXJ Seventeen To Start Chart - On Wednesday, GDXJ just missed getting a “fuel cell” buy signal. Having said that, volume is constructive.
- Chart damage has been done on the price chart, but GDXJ looks poised to make a quick move towards resistance, in the $17 area.
- At these low prices, a small dollar price change can be a big percentage move for investors.
- It’s important to be able to buy even a small amount of your favourite junior stocks, when sentiment is this overdone on the downside.
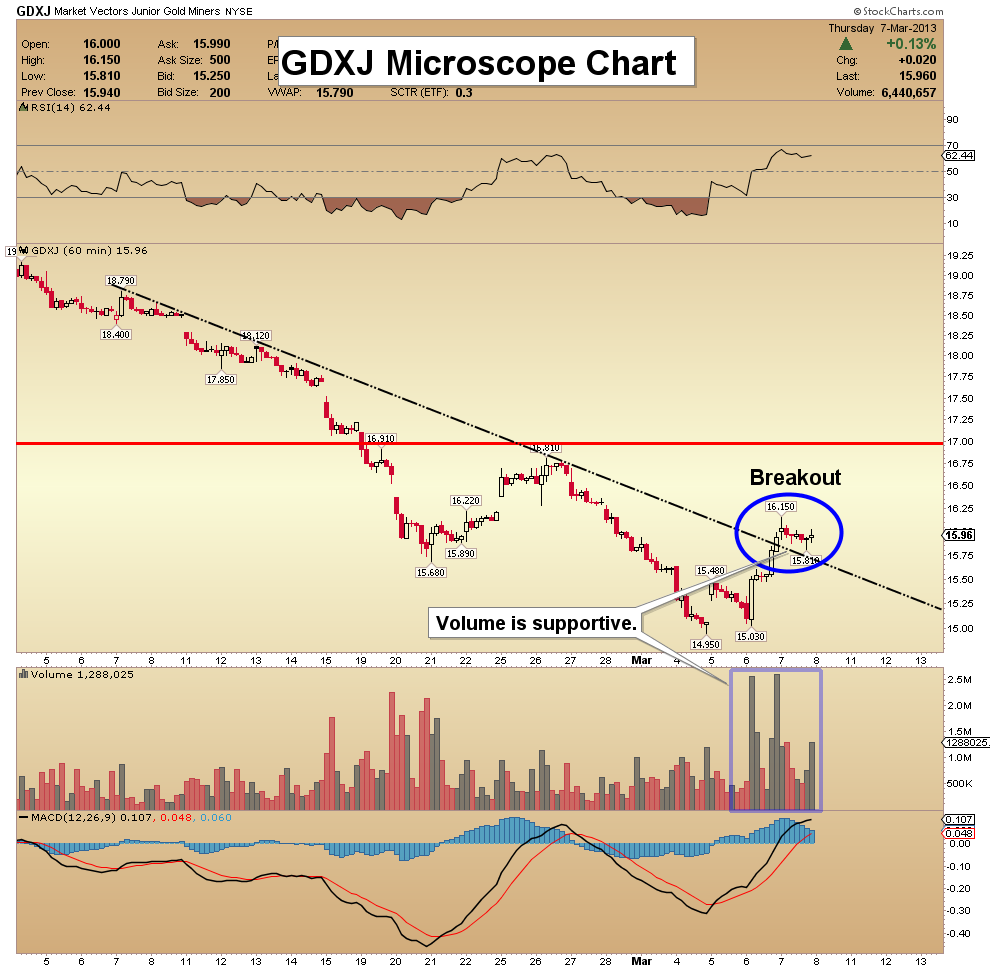
GDXJ Microscope Chart - This 60 minute chart provides a closer look at what GDXJ is doing right now. An upside breakout is in play, and volume is supportive of the breakout.
- It’s important that GDXJ stays above that black dotted trend line. Traders who like to gamble could place a stoploss under $14.95, but my recommendation is to take a smaller position, without using a stoploss.
- The world is going to need a lot more gold and silver, as Asia grows. It is the junior mining companies that will find it!
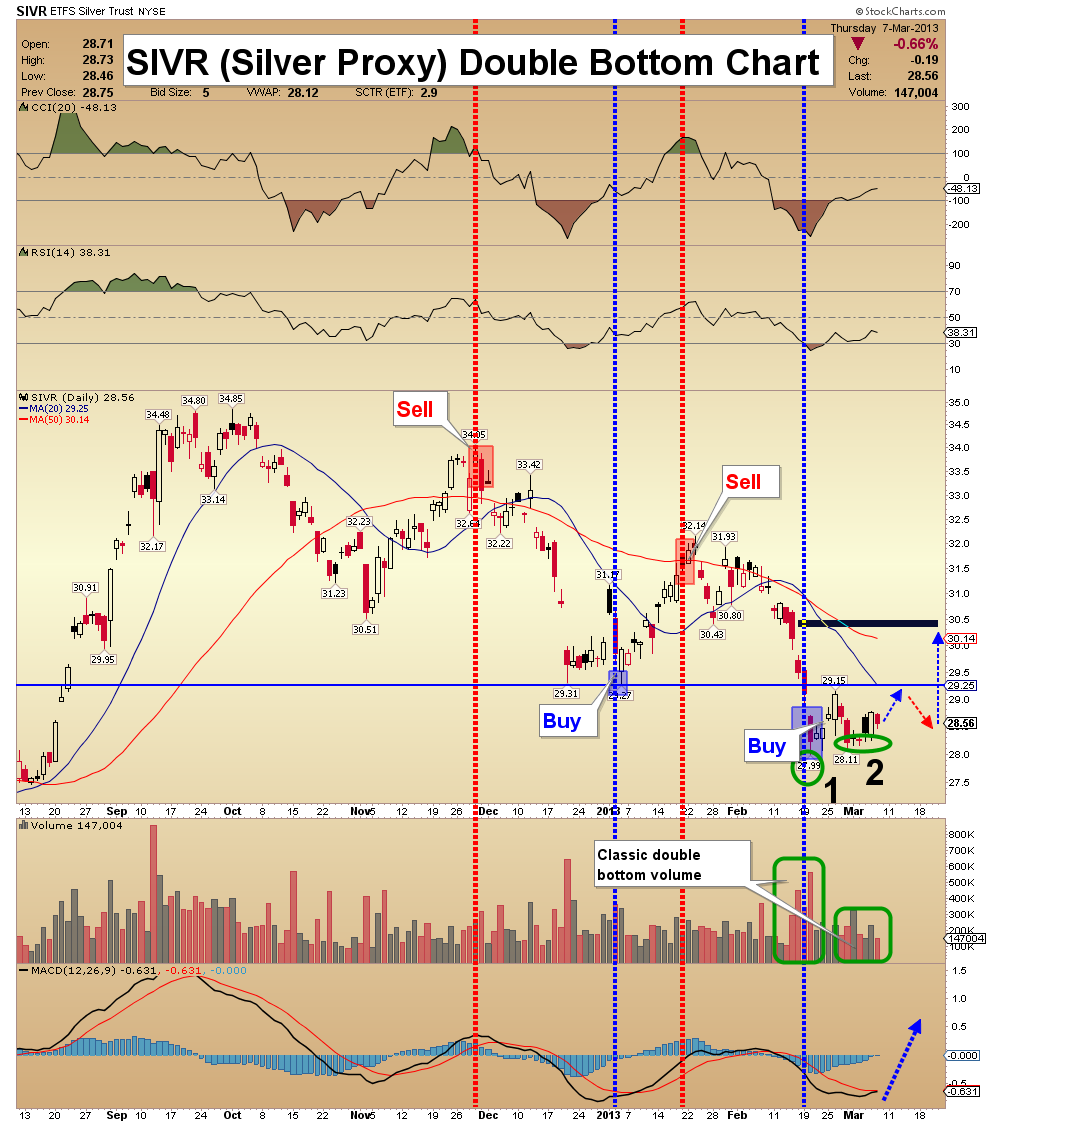
SIVR (Silver Proxy ETF) Double Bottom Chart - Silver is a great asset, especially for investors looking for a little more action than is available in the gold market. Gold is my largest holding, but silver is a big one, too.
- Note the trade signals on the chart. Silver has a double bottom pattern very similar to the one I showed you on the gold chart, and $29.15 is the neckline. A move over the neckline should produce a rise to $30.43, and begin a trending move to the $40 area!
Friday, Jun 19, 2026 Super Force Signals Unique Introduction For 321Gold Readers:
Send me an email to admin@supergoldsignals.com and I’ll send you my free “Inflation Thunder Now!” gold and silver stocks video report. I’ll also include 3 of my next Super Force Surge Signals free of charge, as I send them to paid subscribers. Thank you!
|
Stay alert for our Super Gold alerts, sent by email to subscribers,
for both the daily charts on Super Force Signals at www.supergoldsignals.com and for the 60 minute
charts at www.supergoldsignals.com
About Super
Gold Signals:
Our Surge Gold Signals are created thru our proprietary blend
of the highest quality technical analysis and many years of successful
business building. We are two business owners with excellent synergy.
We understand risk and reward. Our subscribers are generally successfully
business owners, people like yourself with speculative funds,
looking for serious management of your risk and reward in the
market.
Frank Johnson:
Executive Editor, Macro Risk Manager.
Morris Hubbartt: Chief Market Analyst, Trading Risk Specialist.
website: www.supergoldsignals.com
email:
admin@supergoldsignals.com
email: admin@supergold60.com
Mail:
1276 Lakeview Drive
Oakville, Ontario, L6H 2M8
Canada
### Mar 8, 2013
Morris Hubbartt
321gold Ltd
 |
