Super Force Signals - A Leading
Market Timing Service
We Take Every Trade Ourselves
Precious Metals Shoulder Jostling
Morris Hubbartt
Weekly Market Update Excerpt
posted Mar 2, 2012
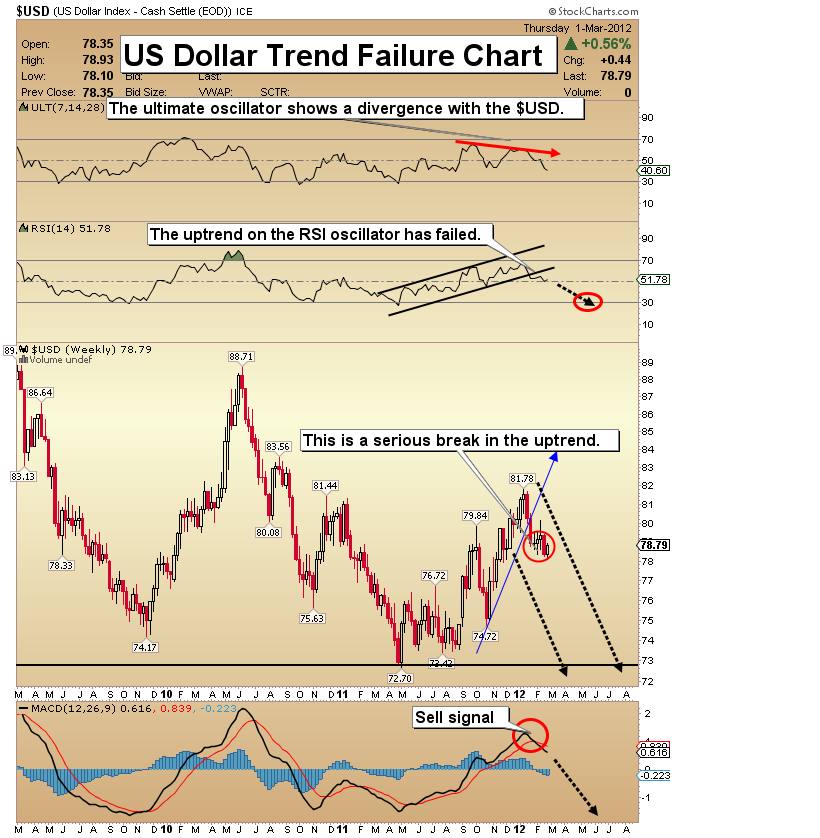
US Dollar Trend Failure Chart
- I’m an outspoken dollar bear and a gold bull. That said, I do not offer buy or sell signals on the dollar. I use strength in the dollar to accumulate gold and silver.
- One important story that is generally missed by investors and will likely continue to pressure the US dollar over the intermediate and longer term, is China’s growing ability to bypass the dollar with its own reserve currency holdings.
- This important trend started in November 2010, when China and Russia renounced the US dollar and resolved to increase the use of their own currencies for bilateral trade.
- In recent months China has set up currency swap agreements with more than ten countries. In the last several weeks China and the United Arab Emirates signed a multi-billion dollar currency swap deal. Two weeks ago China signed an agreement with Turkey. It is clear that the Chinese are pushing ahead with currency diversification.
- As this happens, fewer dollars are needed by those nations and more dollars will be sold, potentially putting some very substantial pressure on our US currency.
- The ultimate safe harbor currency for Americans is gold. It is particularly important to be able to buy some gold when it experiences downside price shocks, like the one we all experienced on Wednesday.
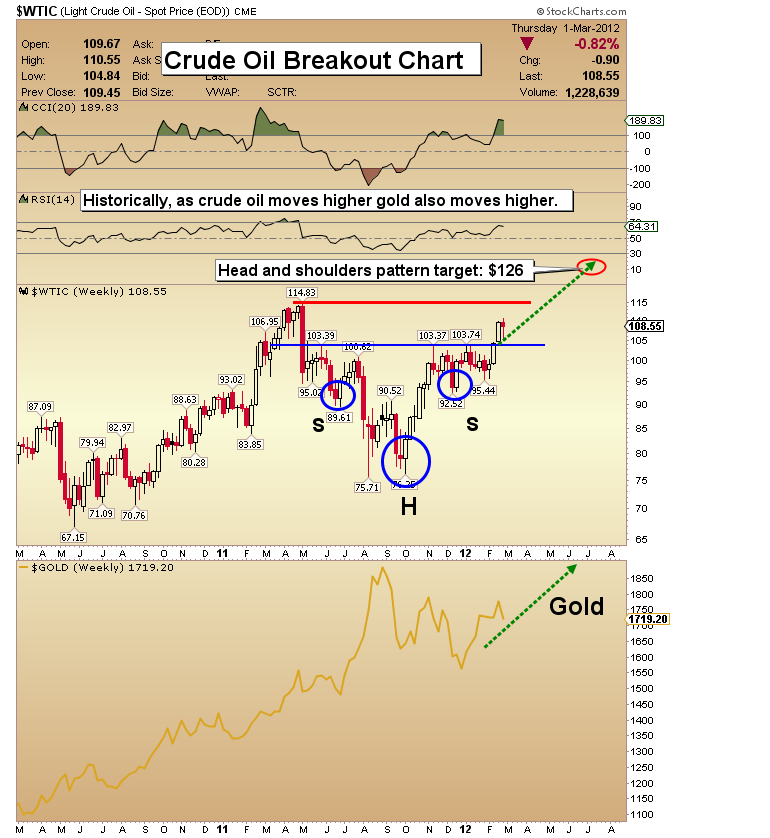
Crude Oil Breakout Chart
- The price action this week in crude confirms the weekly head and shoulders pattern breakout to the upside. I’m projecting substantially higher crude prices over the next several months. This is the strong season for crude oil, and yesterday’s attack on the Saudi oil pipeline could be a premonition of what a war with Iran could do to the price.
- Historically, higher crude oil prices have had a positive impact on the price of gold. This is not 2008. In 2008, the escalating price of oil helped to damage the economy and stock markets. This year I see the Fed continuing to print money, even in the face of higher crude prices. As the price of oil moves higher with easy money, inflation could move up substantially.
- There are several ways to take advantage of higher crude prices. You can buy crude oil futures, or crude oil funds as I have done. The other way to take advantage of this situation is to buy gold and silver. In a high inflation scenario, silver could outperform both gold and oil.
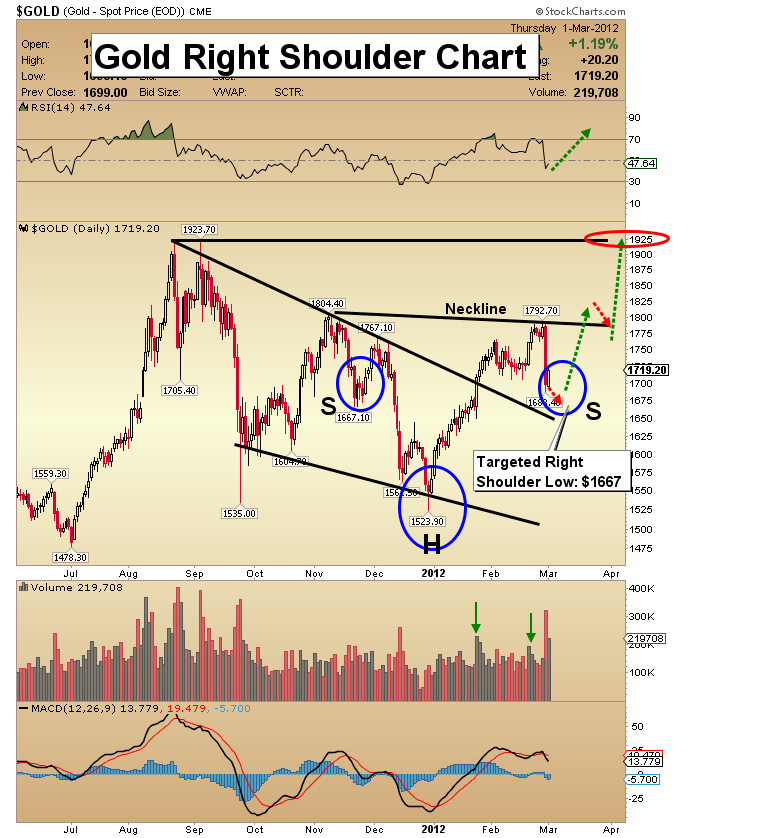
Gold Right Shoulder Chart
- The gold market got hit hard on Wednesday. Gold came very close to $1800, before succumbing to selling pressure. This corrective action is normal and healthy in a bull market.
- I have targeted the $1667 area as the potential right shoulder low of the current H&S pattern that is in play. Once the price rises over the neckline at about $1793, a rise to the old highs near $1925 is the next step for gold! From there, I expect a move to $2100.
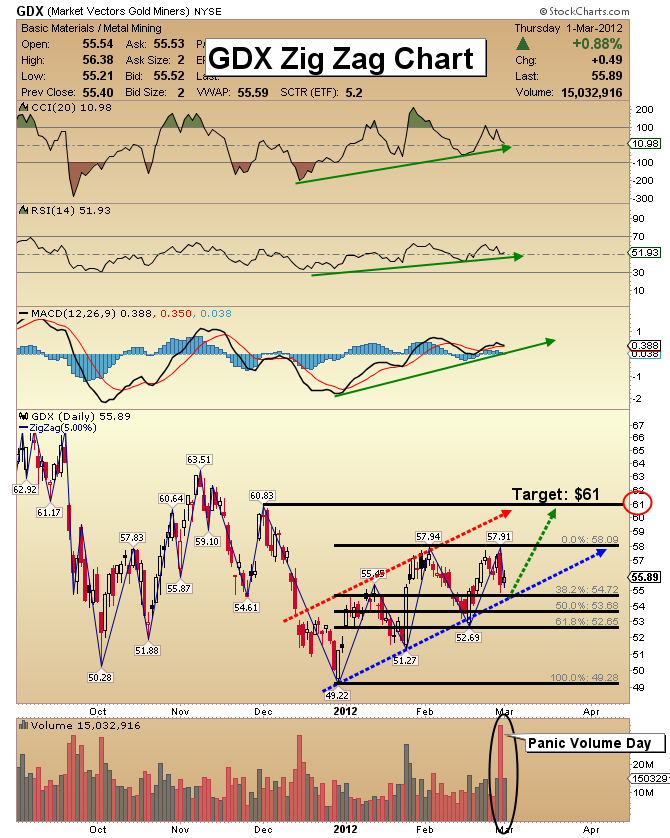
GDX Zig Zag Chart
- The technical action in gold stocks remains very bullish. Volume is in a sweet spot where it is neither too light nor too heavy with speculation. Technical indicator divergences with the GDX price are a signal that the market will continue to rise higher.
- The sentiment indicators are also very bullish. I use a number of tools to identify when sentiment extremes occur. Since late last year the gold stock sentiment indicators that I use continue to show that gold stock investors are generally somewhat nervous, with many showing outright fear. That is a very positive scenario for the price of gold stocks, and they are “zig zagging” their way up this wall of worry.
- Gold seniors have rallied about 16% from the recent lows in what appears to be the very early stages of a much larger move. My next target price for GDX is $61.
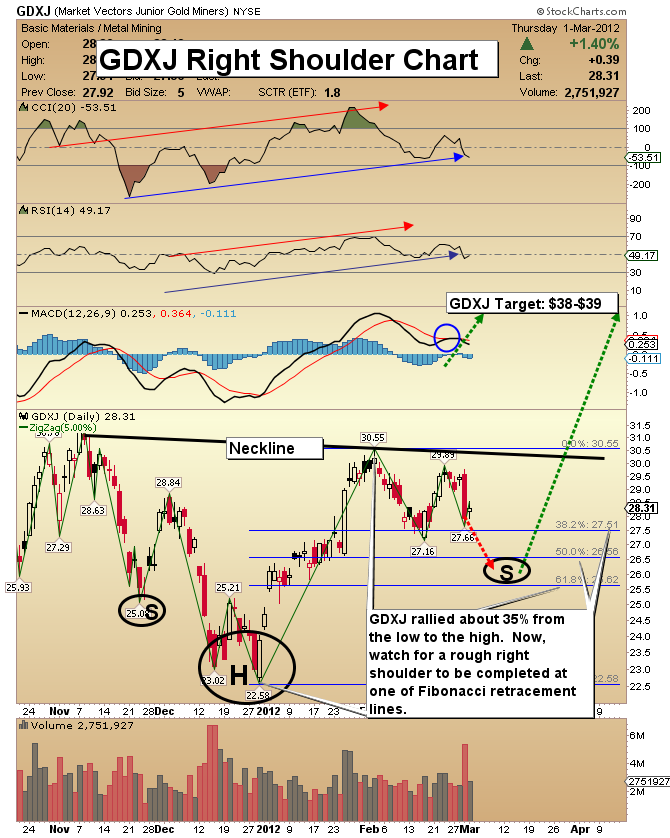
GDXJ Right Shoulder Chart
- There is a head and shoulders pattern in play here, like in many of the gold market sectors. I had hoped to see the right shoulder low in the vicinity of the 38.2% Fibonacci retracement line, but Wednesday’s sell-off increases the likelihood that it will occur at either the 50% point or the 61.8% point.
- Intensify your buying in the $25.50-$26.50 price area.
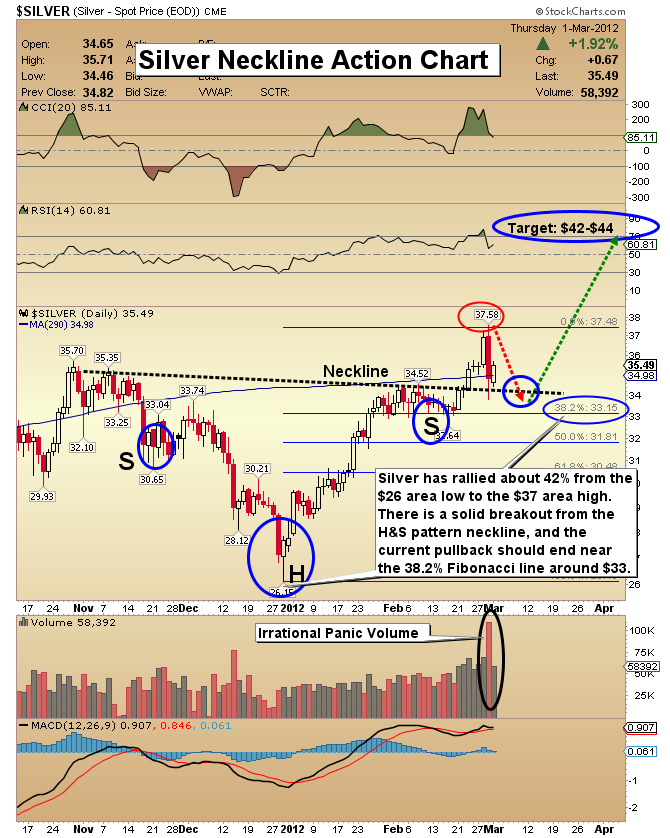
Silver Neckline Action Chart
- Silver is my largest “risk asset” at the present time. I own more gold than silver, but I consider gold more of a currency than a risk asset.
- I projected that silver would outperform gold this year. Silver has rallied about 42% off the late December low.
- The neckline sits around $34, and I believe the current pullback is classic “neckline pullback”. There is Fibonacci retracement line support near $33 and that could be the low point of this pullback.
- Regardless of where the pullback ends, I’m projecting a rise from there to $42-$44.
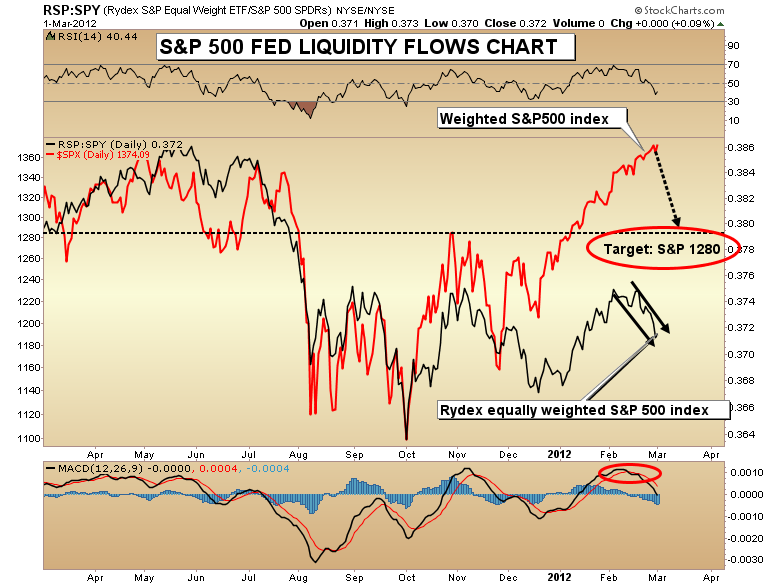
S&P 500 Fed Liquidity Flows Chart
- One way to gauge a market is to be able to look beyond the “cover page” of a stock market index. For example, the S&P is a weighted index. The larger companies have a much larger presence in the index than the smaller ones, and it is these larger companies that benefit most from the Fed’s policy of quantitative easing.
- My comparison of the equally-weighted Rydex S&P 500 index to the regular S&P 500 chart shows that a startling divergence is occurring right now.
- There is a dramatic underperformance of the equal weighted average. I see the current main S&P 500 market as technically overbought by about 5-7%. I don’t expect a crash, but I am projecting a modest decline, and that fits with my projections for right shoulder lows on the gold stocks.
- Buy S&P 500 put options if you are nervous about gold stocks, and use any profits you make on those options to buy gold stocks!
Friday, Jun 26, 2026 Super Force Signals Unique Introduction For 321Gold Readers:
Send me an email to admin@supergoldsignals.com and I’ll send you my free “Inflation Thunder Now!” gold and silver stocks video report. I’ll also include 3 of my next Super Force Surge Signals free of charge, as I send them to paid subscribers. Thank you!
|
Stay alert for our Super Gold alerts, sent by email to subscribers,
for both the daily charts on Super Force Signals at www.supergoldsignals.com and for the 60 minute
charts at www.supergoldsignals.com
About Super
Gold Signals:
Our Surge Gold Signals are created thru our proprietary blend
of the highest quality technical analysis and many years of successful
business building. We are two business owners with excellent synergy.
We understand risk and reward. Our subscribers are generally successfully
business owners, people like yourself with speculative funds,
looking for serious management of your risk and reward in the
market.
Frank Johnson:
Executive Editor, Macro Risk Manager.
Morris Hubbartt: Chief Market Analyst, Trading Risk Specialist.
website: www.supergoldsignals.com
email:
admin@supergoldsignals.com
email: admin@supergold60.com
Mail:
1276 Lakeview Drive
Oakville, Ontario, L6H 2M8
Canada
###
Mar 2, 2012
Morris Hubbartt
321gold
Ltd

|
