Super Force Signals - A Leading Market Timing Service
We Take Every Trade Ourselves
Gold Sentiment Twilight Zone Morris Hubbartt
Weekly Market Update Excerpt
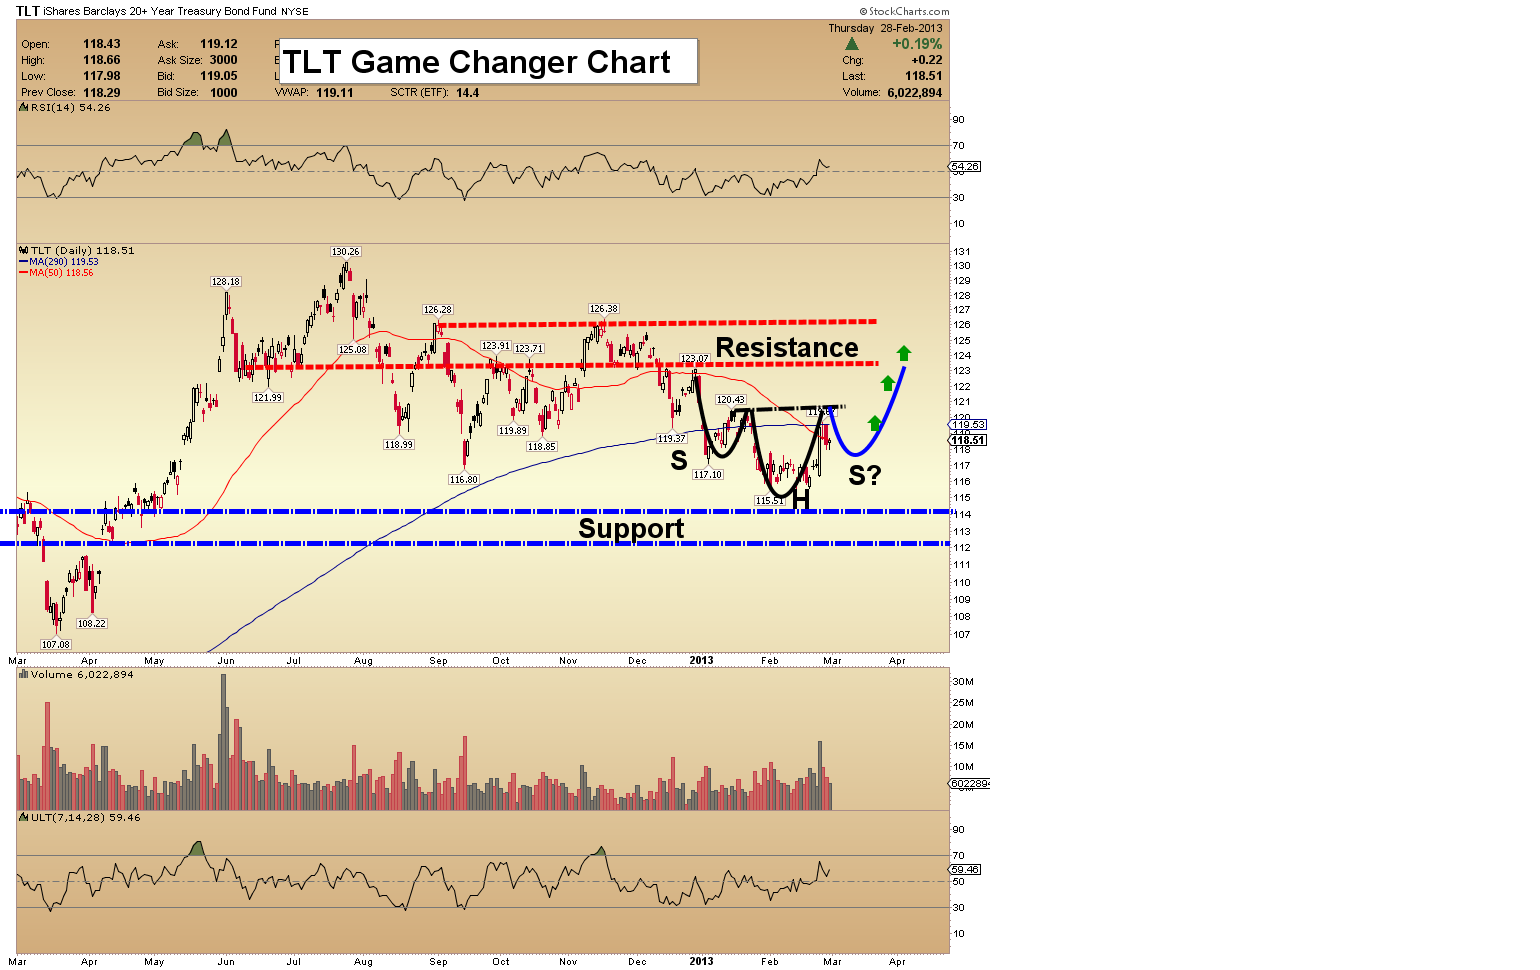
posted Mar 1, 2013 TLT (T-Bond Proxy) Game Changer Chart - A relief rally in the bond market is now underway, and a change of character has taken place. That change can be identified by looking at volume patterns. A “fuel cell” volume day occurred this week, and Ben Bernanke’s speech has opened the door, for a substantial rally.
- The “smart money” commercial traders have been buying the bond, and I have said for quite a while that the US government has a vested interest in keeping rates as low as possible.
- When Fed officials make comments that the end of QE is coming, it’s probably a verbal sleight of hand. A rally in the T-bond is what the gold market desperately needs!
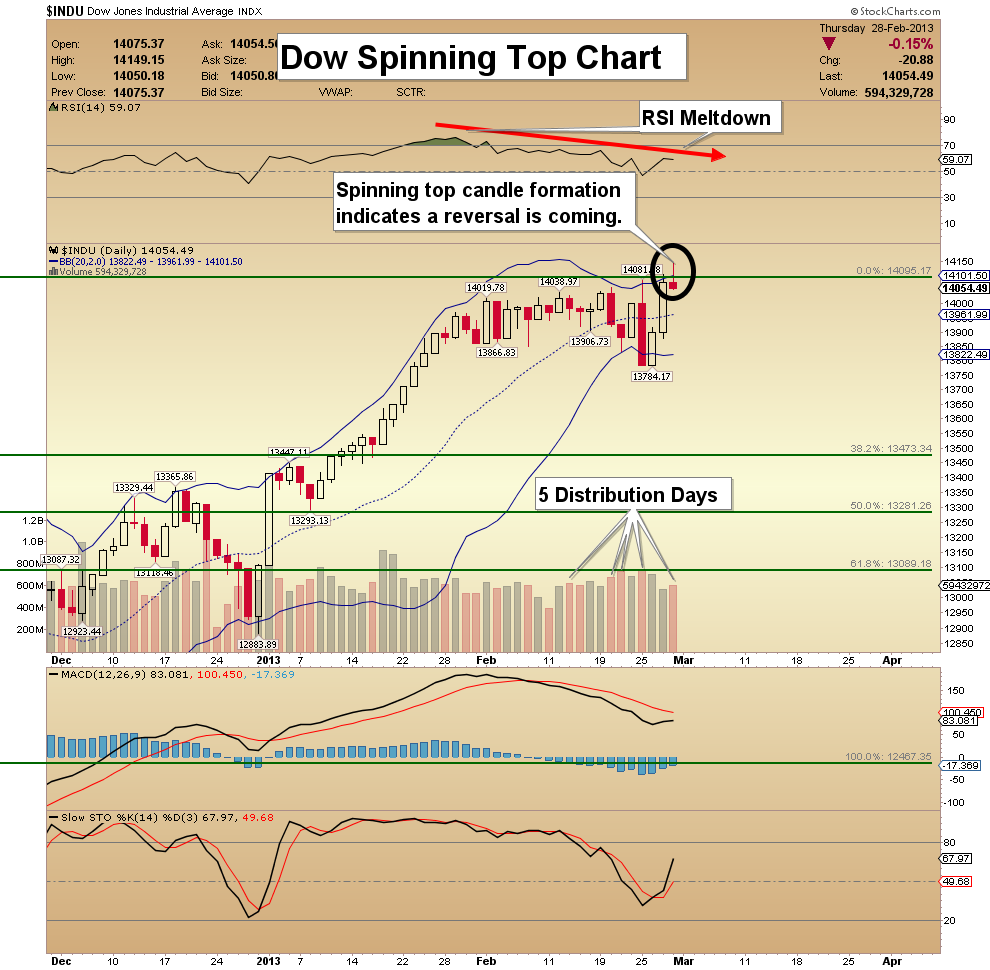
Dow Spinning Top Chart - In the last three weeks, the Dow has had 5 distribution days. Distribution days suggest sophisticated market participants are unloading their positions, in anticipation of a sizable decline.
- I am looking for serious downside action. My short term target is 13,400, and volume patterns are becoming very bearish. Lighten up on any further strength. In my stock market account, I’m now at 85% cash.
- The spinning top formation adds weight to the argument that a substantial topping process is in play.
Gold Public Opinion Chart - As the price has softened, the public has fled the gold market. The old saying is "if you can’t handle the heat, get out of the kitchen." Well, the public clearly cannot handle the heat. Look at the extreme sentiment reading on this chart, courtesy of sentimentrader.com. It looks like something from the twilight zone! I’ve never seen the sentiment for gold stocks this bearish, which probably means the potential upside reward has never been bigger!
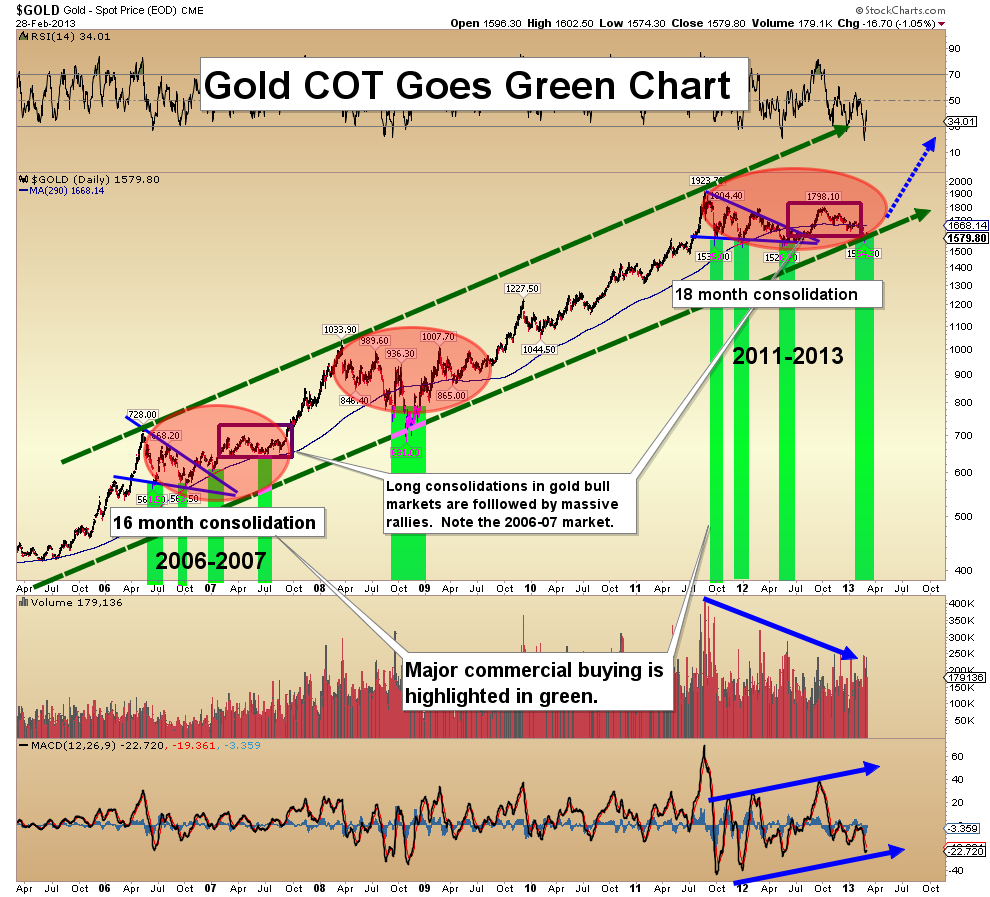
Gold COT Goes Green Chart - The base building process over the last 18 months has been frustrating. There is strong support under the market, coming from commercial traders. This is the “platform” that should propel gold to higher prices.
- Commercial traders are now holding positions comparable to the 2006-2007 timeframe. Gold gained over 70% after that, and it could happen again!
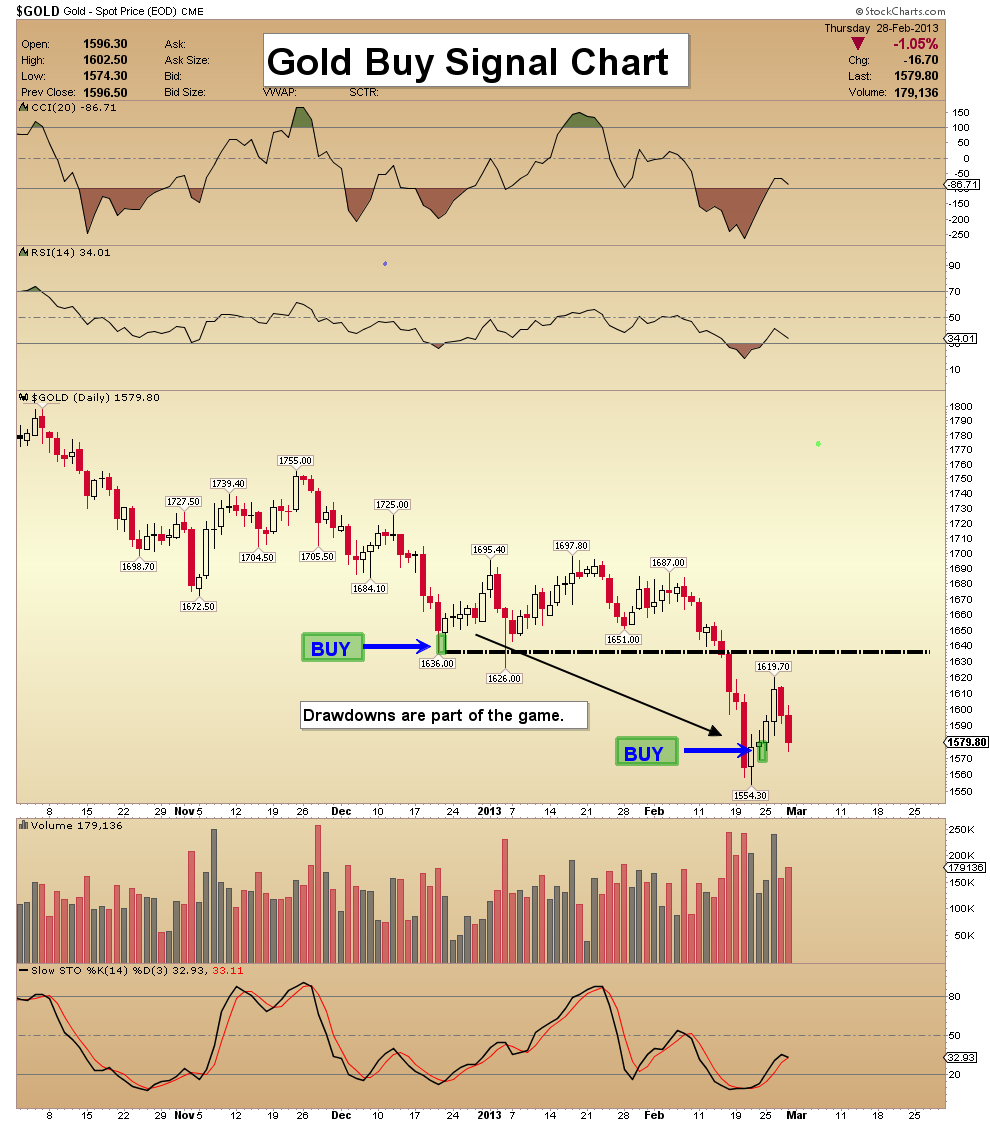
Gold Buy Signal Chart - I remain as bullish as I can be. That said, the most important thing for investors to do is to maintain a large core position, while doing some short term trading. My latest buy signal for gold is highlighted on this chart.
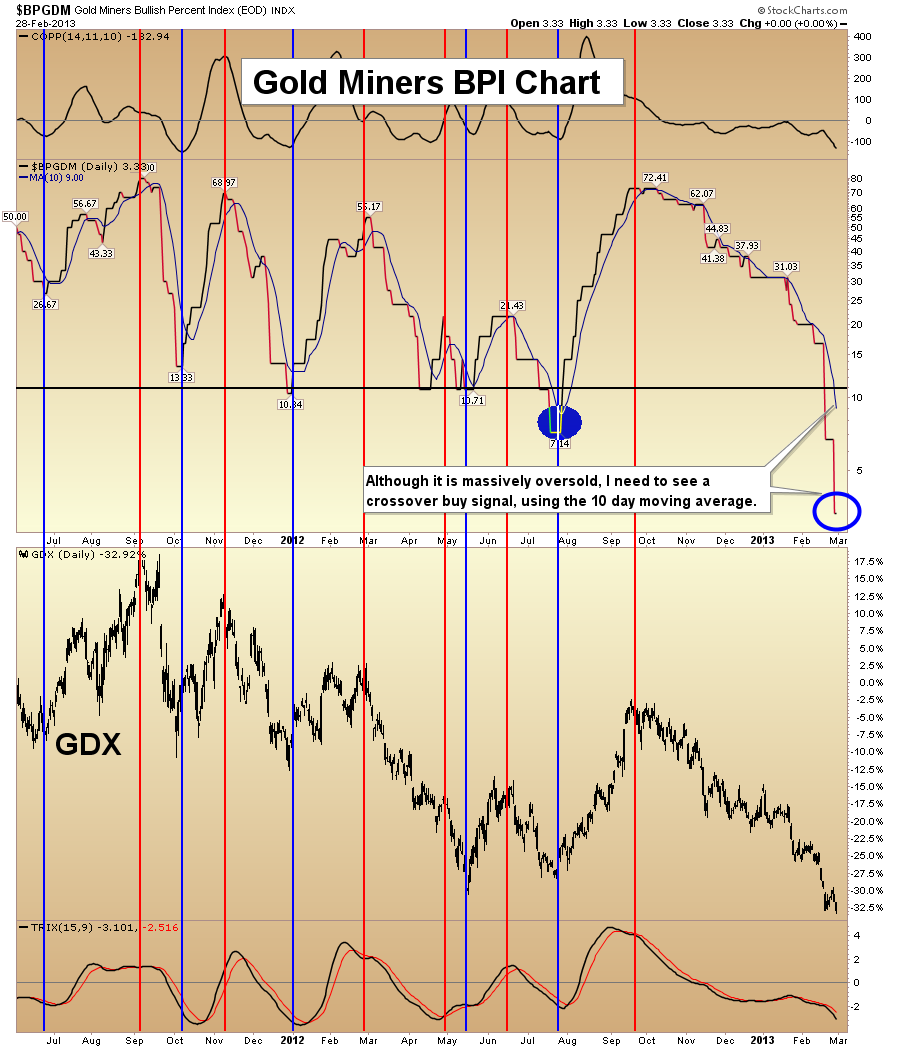
Gold Miners BPI Chart - The GMBPI (Gold Miners Bullish Percentage Index) chart has reached a massively oversold reading, as of this week. An enormous buy signal will be generated, when this key index crosses the 10 day moving average.
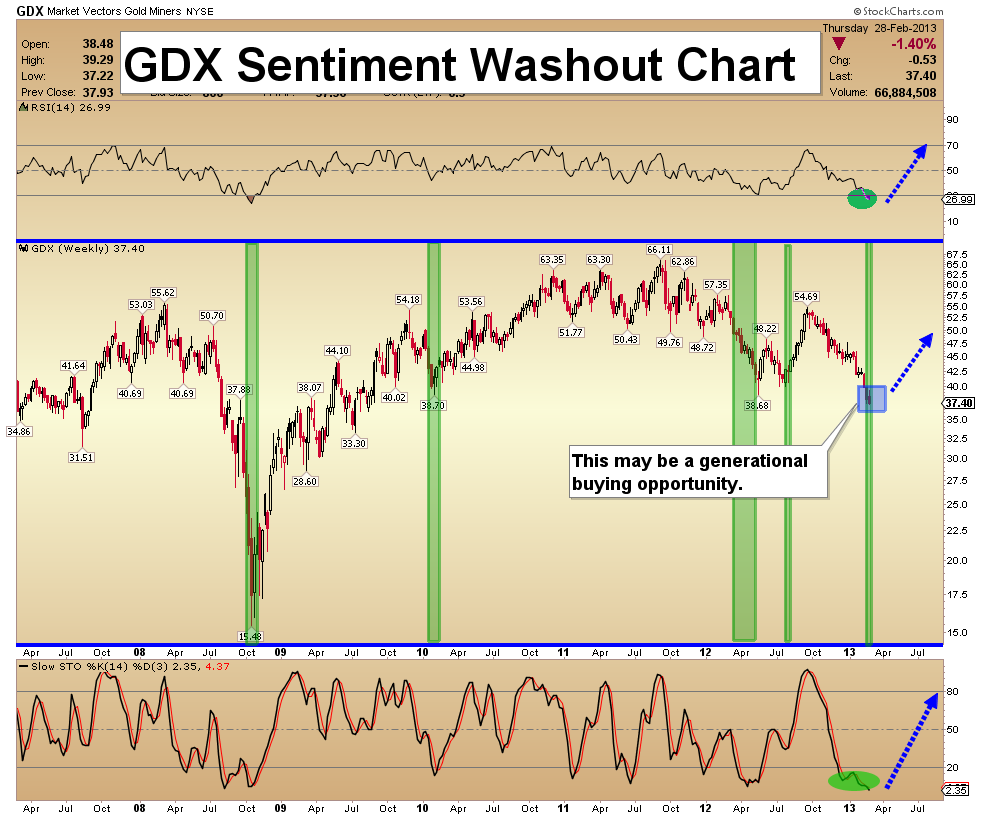
GDX Sentiment Washout Chart - The bottom line is when people become overly negative about gold stocks, massive rallies unfold. The reason for this is simple; when all the money is out, there is only one direction for money flows to go, and that is back in! Hold gold stocks, for long term capital gains.
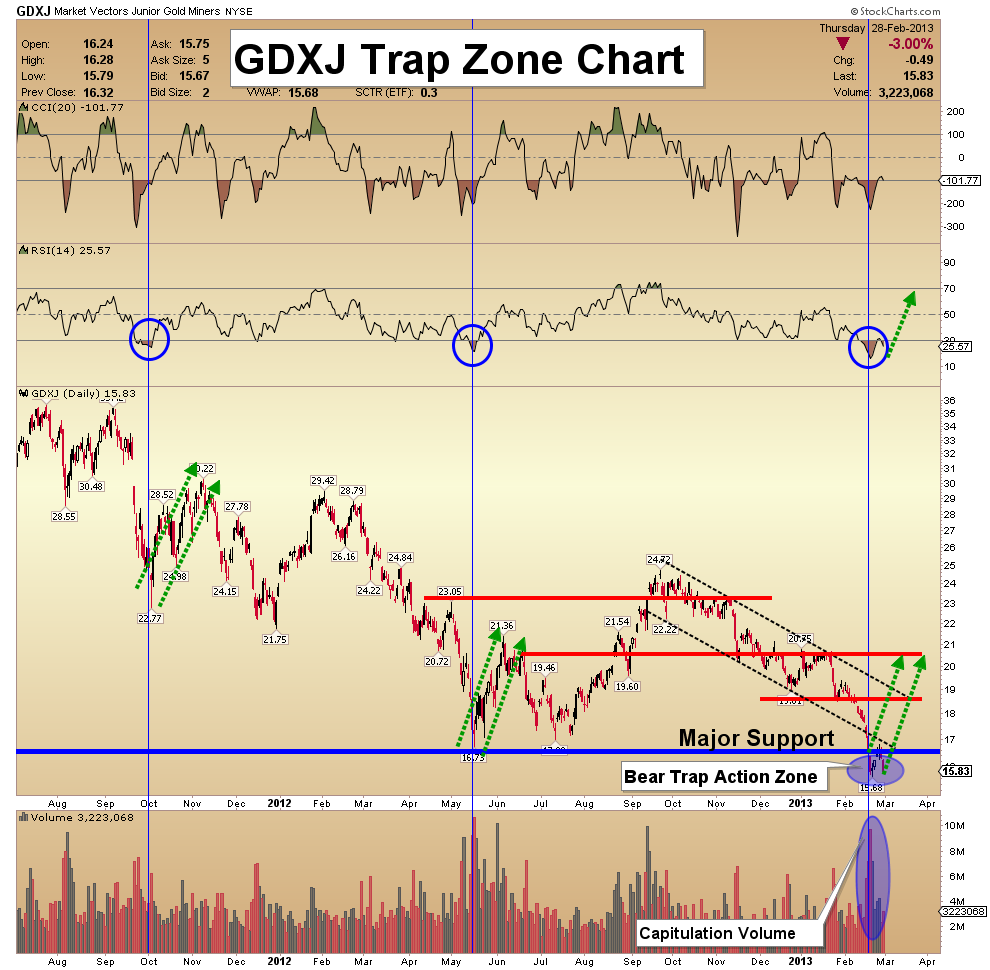
GDXJ Trap Zone Chart - Capitulation volume, a potential bear trap below major price support, and the superb position of most oscillators….suggests that a major bottom, or possibly a generational bottom, is forming in junior gold stocks.
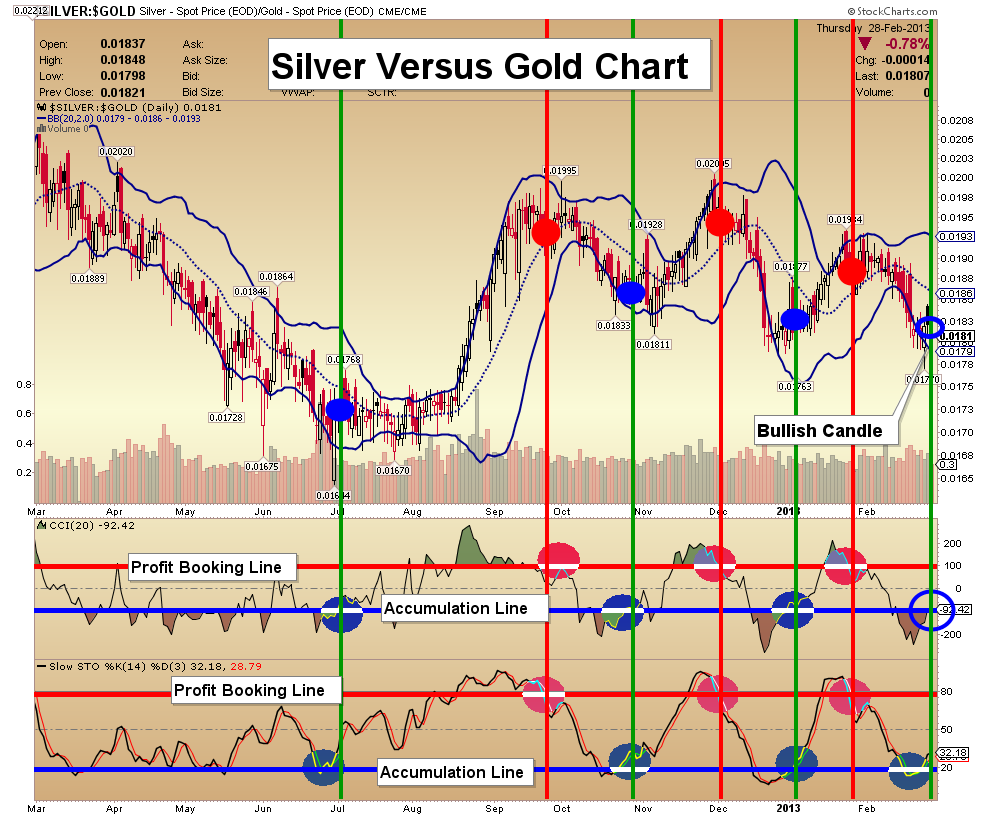
Silver Versus Gold Chart - I prefer to accumulate silver in times of weakness, for long term capital gains.
- To get a full buy signal, I need to see the CCI indicator rise above the -100 line. That will be the final confirmation of the buy signals given by my other technical indicators. My choice is physical silver, and this chart suggests that the time is almost here, to place your buy orders!
Friday, Jul 3, 2026 Super Force Signals Unique Introduction For 321Gold Readers:
Send me an email to admin@supergoldsignals.com and I’ll send you my free “Inflation Thunder Now!” gold and silver stocks video report. I’ll also include 3 of my next Super Force Surge Signals free of charge, as I send them to paid subscribers. Thank you!
|
Stay alert for our Super Gold alerts, sent by email to subscribers,
for both the daily charts on Super Force Signals at www.supergoldsignals.com and for the 60 minute
charts at www.supergoldsignals.com
About Super
Gold Signals:
Our Surge Gold Signals are created thru our proprietary blend
of the highest quality technical analysis and many years of successful
business building. We are two business owners with excellent synergy.
We understand risk and reward. Our subscribers are generally successfully
business owners, people like yourself with speculative funds,
looking for serious management of your risk and reward in the
market.
Frank Johnson:
Executive Editor, Macro Risk Manager.
Morris Hubbartt: Chief Market Analyst, Trading Risk Specialist.
website: www.supergoldsignals.com
email:
admin@supergoldsignals.com
email: admin@supergold60.com
Mail:
1276 Lakeview Drive
Oakville, Ontario, L6H 2M8
Canada
### Mar 1, 2013
Morris Hubbartt
321gold Ltd
 |
