Super Force Signals - A Leading
Market Timing Service
We Take Every Trade Ourselves
The Gold Transformers
Morris Hubbartt
Weekly Market Update Excerpt
posted Feb 24, 2012
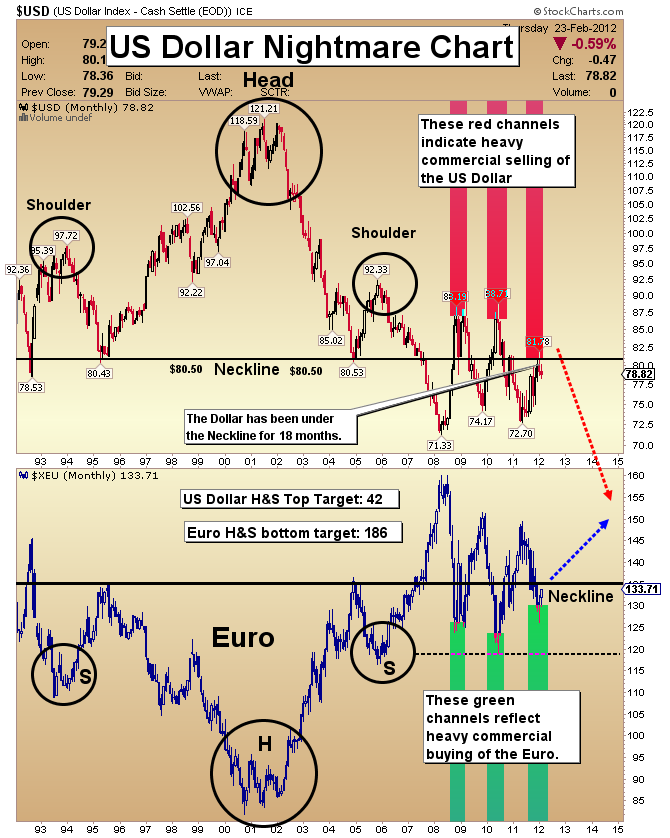
US Dollar Nightmare Chart
- The world has an excess of fiat currency, yet world bankers seem ready to prove that the creation of yet more money will stimulate our economy. The more likely outcome is devalued currencies and a much lower standard of living.
- The currency with the most to lose is the US dollar. This week I want you to take a look at this very long term chart, so you can see the precarious technical position of the dollar.
- One of the most dependable chart formations used in technical analysis is the head and shoulders pattern. There is a giant head and shoulders top pattern on this very long term dollar chart, and it indicates that the dollar is headed for an enormous decline, and will acquire a downside target of 42.
- The dollar has been trading under the neckline of this pattern for 18 months in a range trade. I think the range trade is now ending, and we are on the cusp of a huge new leg to the downside.
- US debt is up nearly 50% in four years. The debt will never be repaid in today’s money, because for every dollar that is collected in tax revenue, another dollar is borrowed.
- My price and volume analysis suggests that the target price of 42 could be acquired within 2-3 years. A move from about 120 on the dollar index to 80 caused gold to rocket fourfold. Gold went from about $250 to $1000.
- A 50% fall in the dollar, with the financial system in this precarious state, could see gold acquire price targets well above $6500.
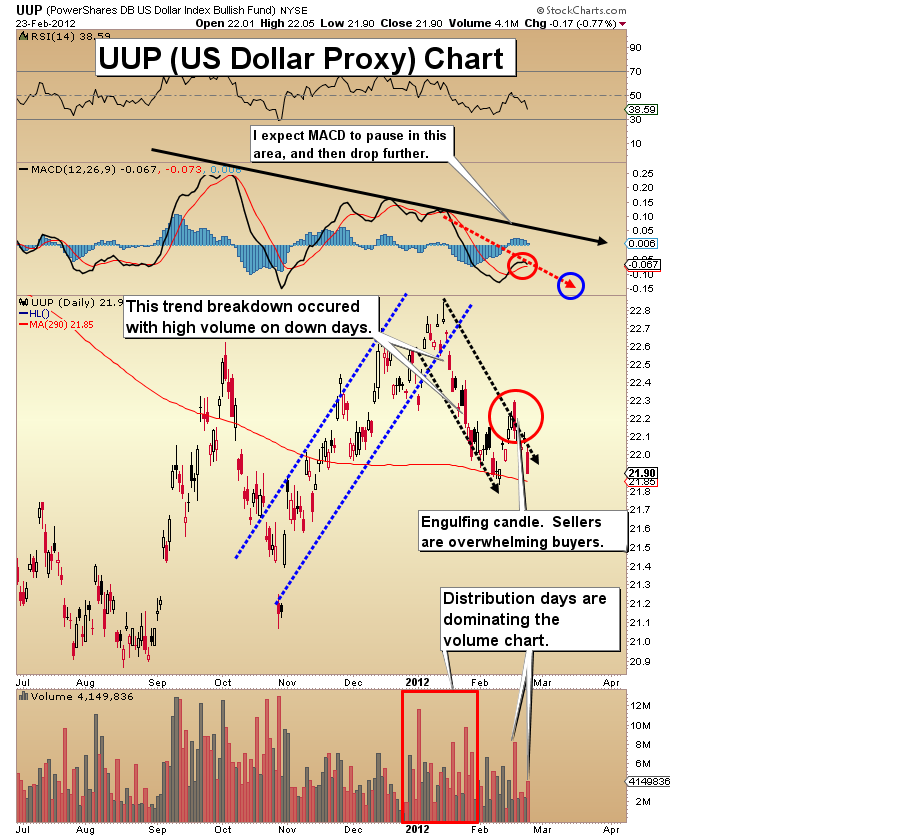
UUP (US Dollar Proxy) Chart
- The head and shoulders nightmare chart gives you the big picture of the US dollar. Unfortunately, the shorter term doesn’t look much better. On the above daily chart, you can see the large distribution volume trade and the engulfing candle.
- Volume patterns on the UUP chart started to ring my technical alarm bells in December. The move to “new highs” came to anemic volume, warning that the rally was long in the tooth.
- The engulfing candle indicates breakout failure. To many it looked like the dollar was prepared to resume trading higher, and then came the ominous engulfing candle on heavy volume.
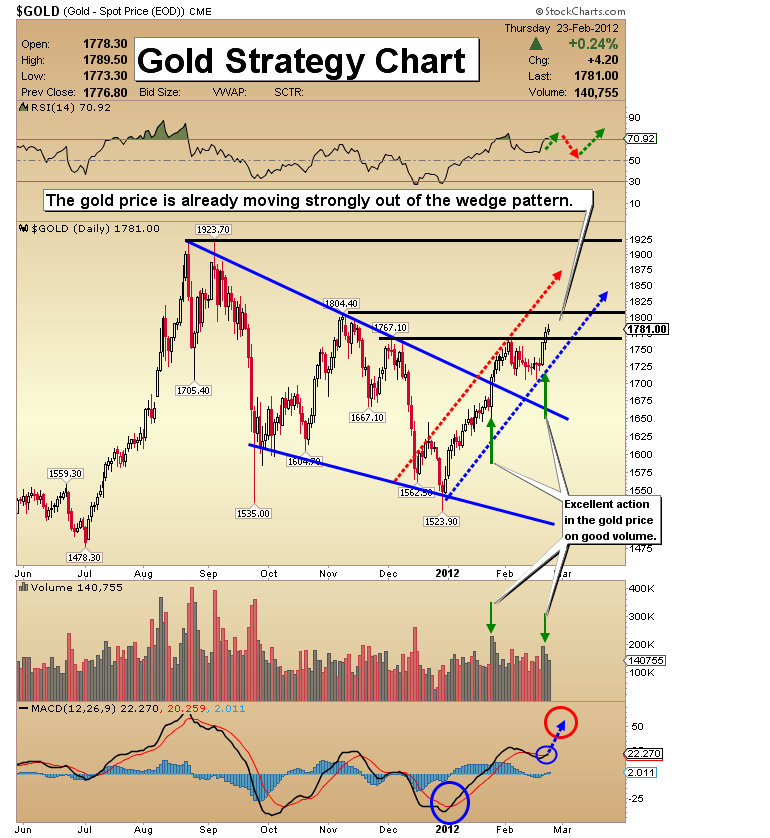
Gold Strategy Chart
- Gold is now making a solid move to the upside, following a textbook breakout. My immediate target zone is $1804 to $1820. Volume analysis is pointing to even higher prices.
- Once $1804 has been acquired, gold could move surprisingly quickly to $1900-$1920.
- I have been highly impressed with the soft volume that has accompanied each sell-off since the price blasted higher in late January.
- I am labeling this move “leg two” of the breakout move, and it is occurring on fuel cell volume. Overall, this gold rally gets an “A Grade” for both its price and volume action.
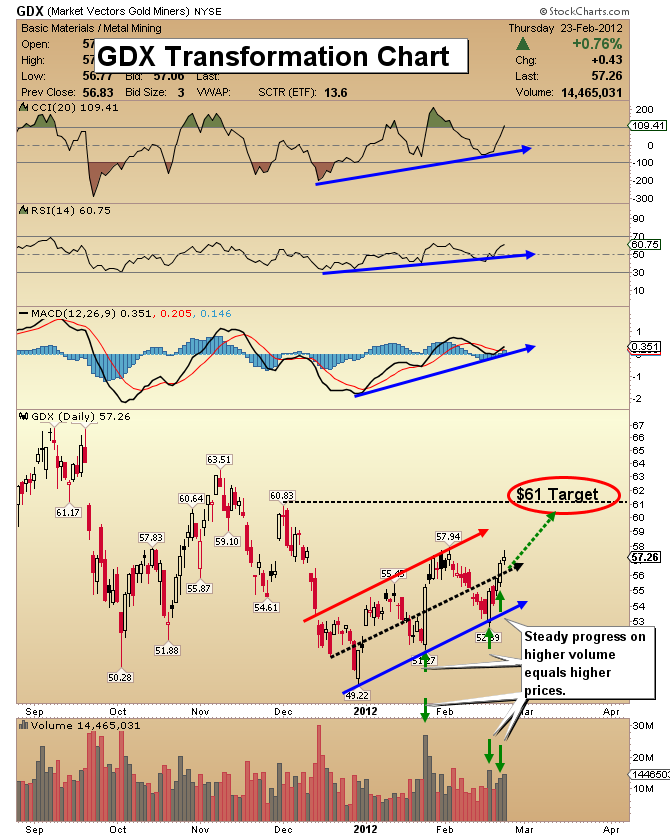
GDX Transformation Chart
- A new leg in the gold stock bull market is being born. As with gold bullion, the action this week in gold stocks is all about price performance on decent volume. This action is the foundation of bull markets.
- Sentiment has been so poor recently that only the strongest of all bulls are left. This is the kind of environment that breeds powerful new legs to the upside in bull markets.
- The breakout for GDX came on strong volume, on January 25th. Since that day, the entire precious metals sector has experienced a change of character.
- Up days are coming on sharply higher price moves and powerful volume. Down days exhibit drifting price and low volume.
- In a process that began on January 25, 2012, the GDX chart looks like a transformer toy being reshaped, from a villain into a hero!
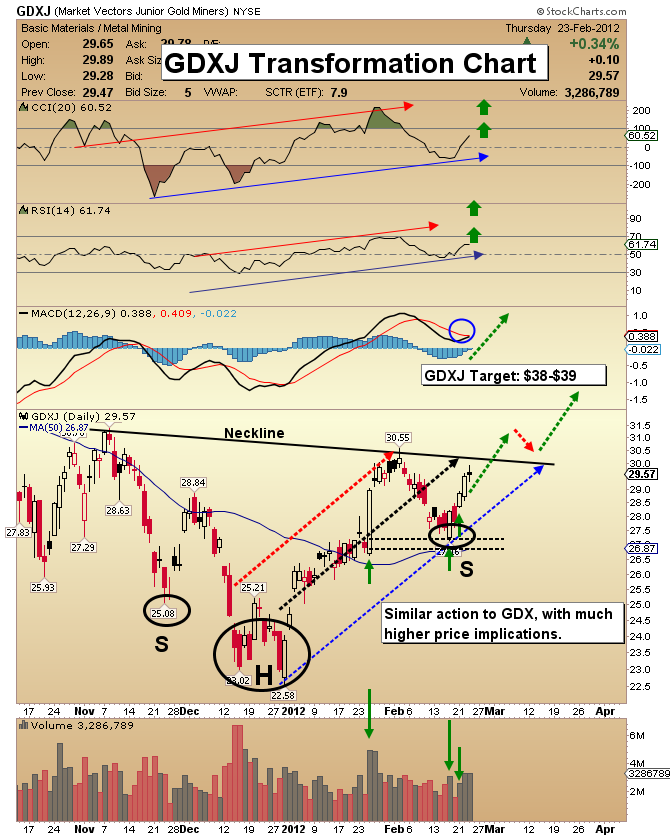
GDXJ Transformation Chart
- For this market the moment of truth also came on January 25th. From that point forward a renewed bull is being created on the price chart. My intermediate term target is $38-$39.
- Note the powerful head and shoulders pattern being carved out on the price chart. I expect all-time highs to be acquired before this year ends. The outstanding feature here is impressive volume.
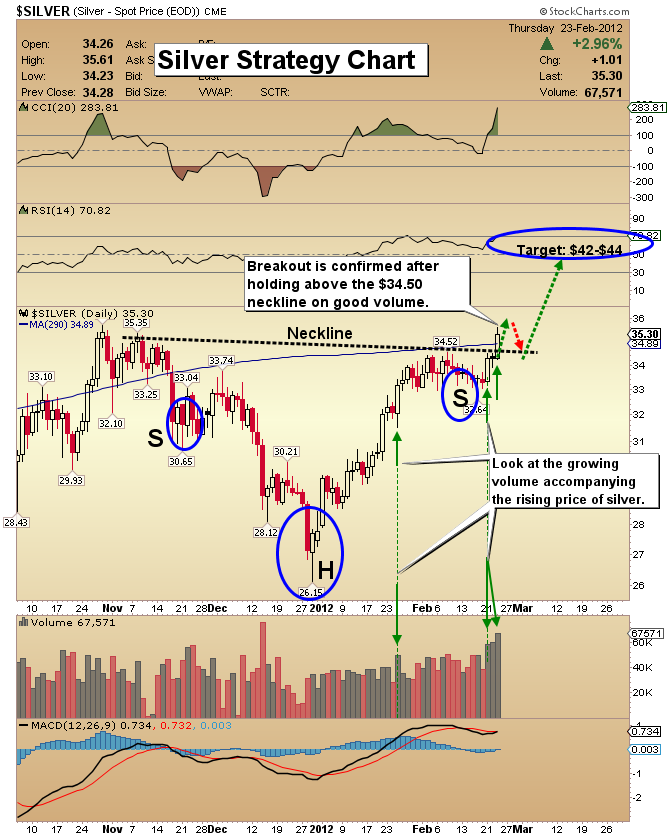
Silver Strategy Chart
- Silver’s price has been very healthy during this rally. Instead of correcting to the downside, the price has only traded slightly lower. The light declines have come on dropping volume. The up days this week came on excellent volume.
- I’m now looking for the $42-44 target area to be acquired, and the move to that price zone will be accompanied by even greater volume.
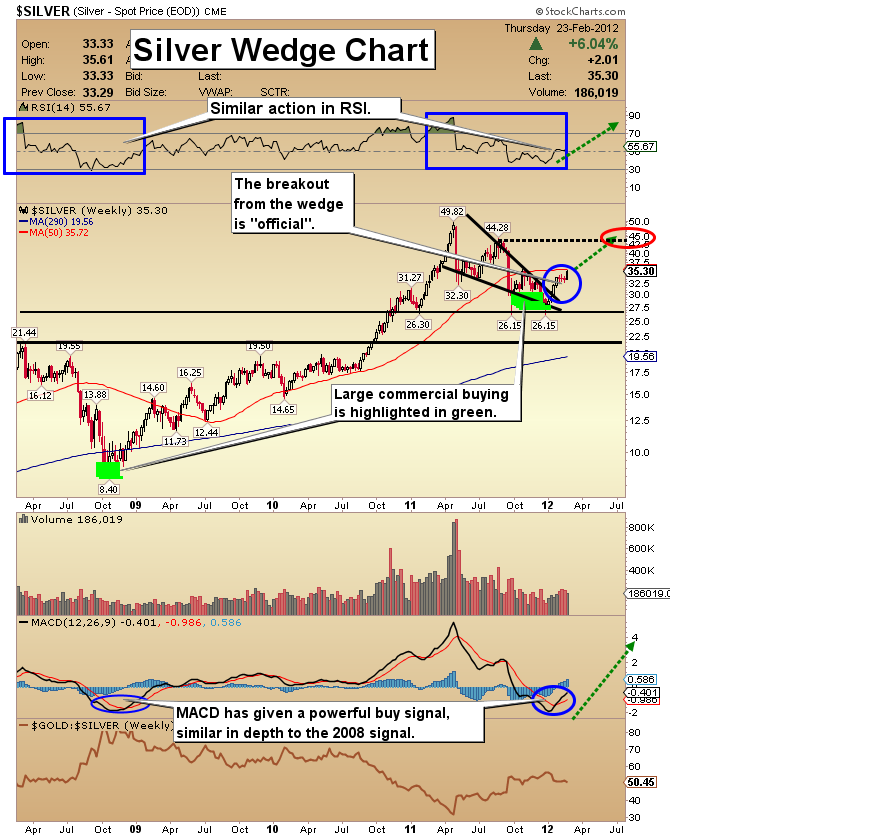
Silver Wedge Chart
- Some bullion dealers have been reporting for months that as much money is going into physical silver as into physical gold. With a current gold/silver ratio of 51, about 51 times more physical silver is being purchased than physical gold.
- Silver can be volatile, yet I continue to see silver as an outstanding long term investment. The wedge pattern suggests that silver will now make its way back to the highs near $50.
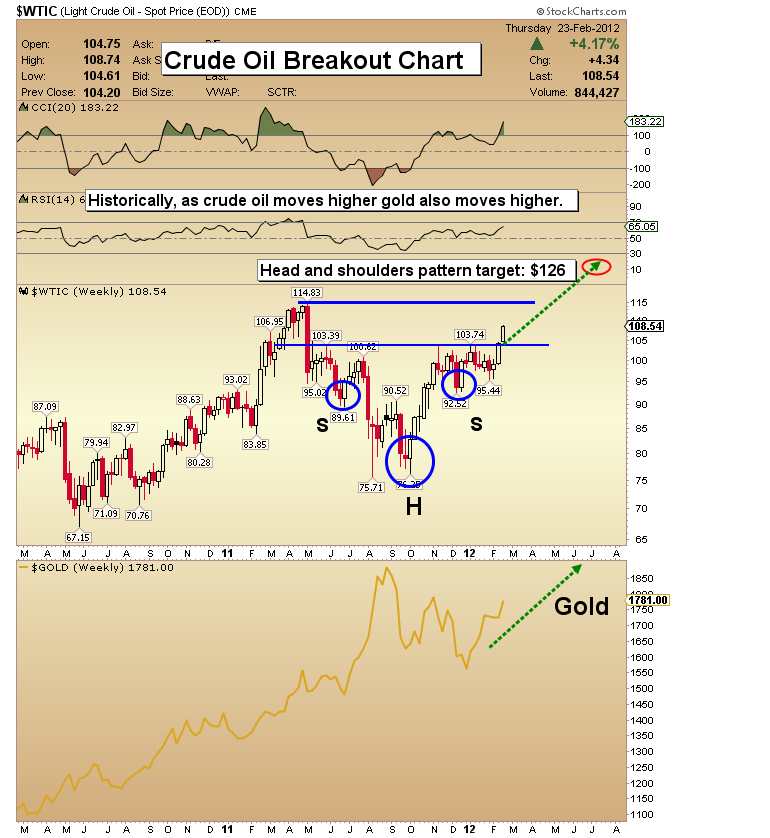
Crude Oil Breakout Chart
- Since December I have been highlighting the likelihood of a crude oil breakout. Assuming this market holds above the head and shoulders neckline for two weeks, I believe crude will acquire the $126 price target.
- From there, I expect a consolidation, and then a move to new highs that will be slightly above $150.
- If crude moves to the $125-$150 area, my historical gold/crude models suggest gold will rise to $2100-$2400!
Friday, Jul 3, 2026 Super Force Signals Unique Introduction For 321Gold Readers:
Send me an email to admin@supergoldsignals.com and I’ll send you my free “Inflation Thunder Now!” gold and silver stocks video report. I’ll also include 3 of my next Super Force Surge Signals free of charge, as I send them to paid subscribers. Thank you!
|
Stay alert for our Super Gold alerts, sent by email to subscribers,
for both the daily charts on Super Force Signals at www.supergoldsignals.com and for the 60 minute
charts at www.supergoldsignals.com
About Super
Gold Signals:
Our Surge Gold Signals are created thru our proprietary blend
of the highest quality technical analysis and many years of successful
business building. We are two business owners with excellent synergy.
We understand risk and reward. Our subscribers are generally successfully
business owners, people like yourself with speculative funds,
looking for serious management of your risk and reward in the
market.
Frank Johnson:
Executive Editor, Macro Risk Manager.
Morris Hubbartt: Chief Market Analyst, Trading Risk Specialist.
website: www.supergoldsignals.com
email:
admin@supergoldsignals.com
email: admin@supergold60.com
Mail:
1276 Lakeview Drive
Oakville, Ontario, L6H 2M8
Canada
###
Feb 24, 2012
Morris Hubbartt
321gold
Ltd

|
