Super Force Signals - A Leading Market Timing Service
We Take Every Trade Ourselves
Gold Bear Trap Is Sprung Morris Hubbartt
Weekly Market Update Excerpt
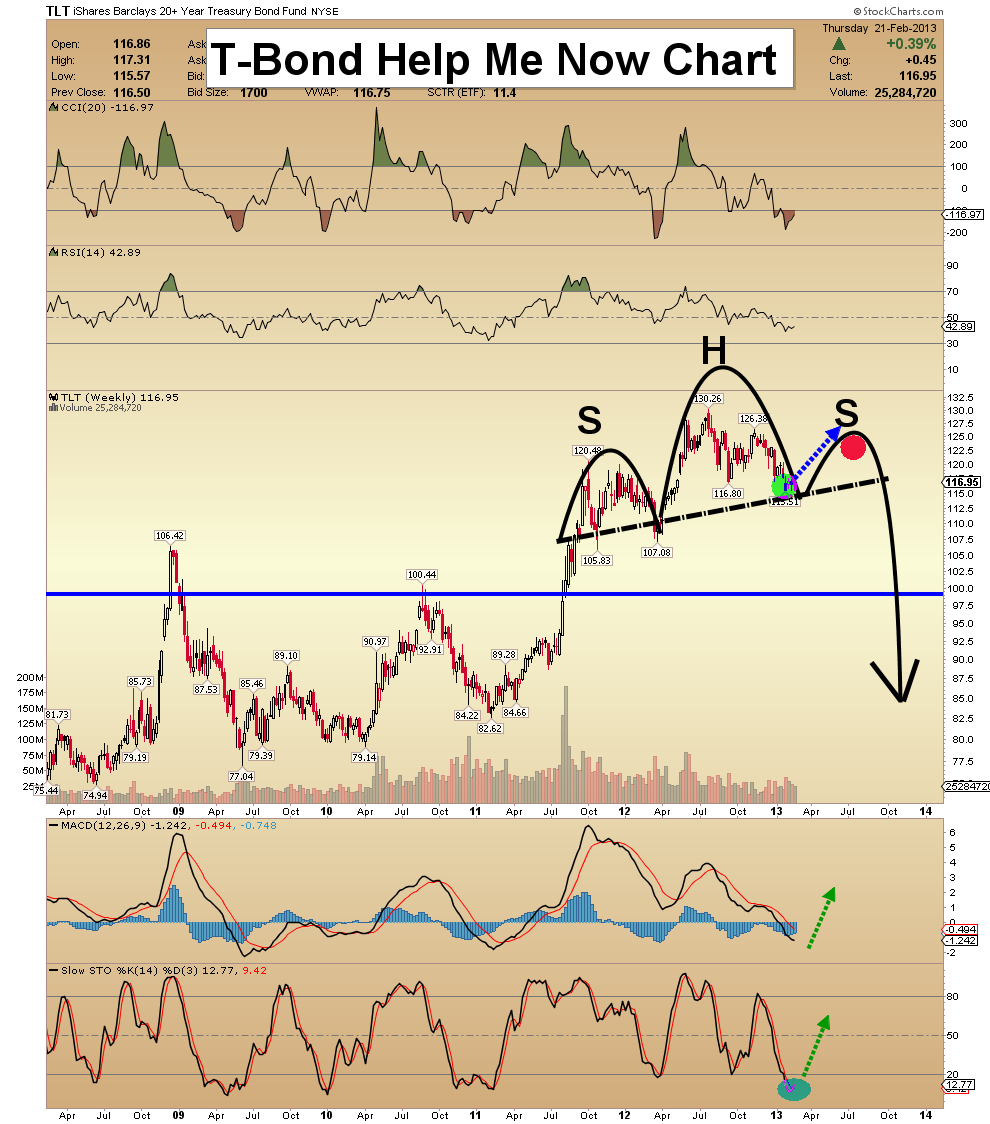
posted Feb 22, 2013 TLT (T-Bond Proxy ETF) Help Me Now Chart - The US Bond Market needs help, and it’s likely going to get it. The Federal Reserve is now engaged in buying over $1 trillion worth of US Bonds per year. Is that enough? Bond yields are rising (bond prices are declining). That is the last thing the US government wants to see right now, as it wallows in un-payable debt. The Fed seems prepared to do whatever it takes to keep rates low, even if the cost of doing so is a dollar that goes right off the trading board.
- This weekly chart shows that the bond market is substantially oversold. I expect TLT to rise towards the $120-$125 area. At that point, a right shoulder of a h&s top pattern would be in play. A huge crash could occur in the bond market, unless the Fed becomes even more aggressive with bond purchases, than it is now!
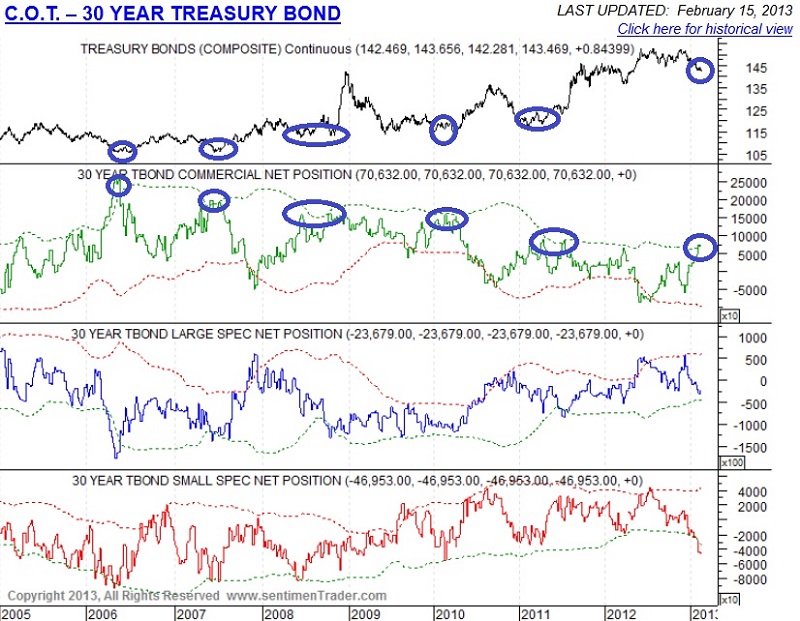
T-Bond COT Report Chart - This chart is from www.sentimentrader.com . It shows that commercial traders (“smart money”) are short-term bullish. Each time their net long position has touched the upper green dotted Bollinger band on this chart, a substantial bond rally has ensued. Gold has usually rallied as well, which is great news for gold investors.
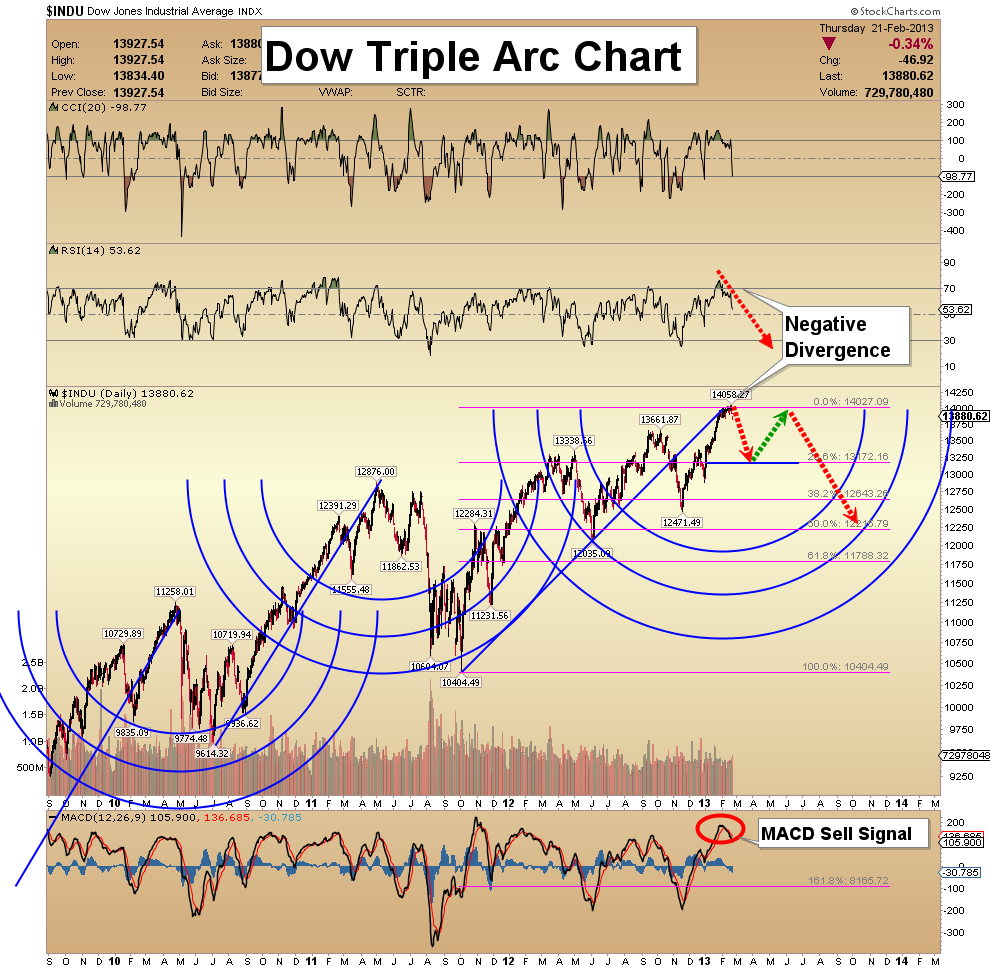
Dow Triple Arc Chart - Another event that could fuel a bond market rally, is a stock market correction. I don't see a deep correction in stocks, yet. I think this will initially play out as a modest pullback, with the Dow declining to my Fibonacci arc target of 13,400. From there, I’m forecasting a small rally, and then a much bigger sell-off, taking the Dow down to about 12,200. As the Dow falls, gold should have a great rally.
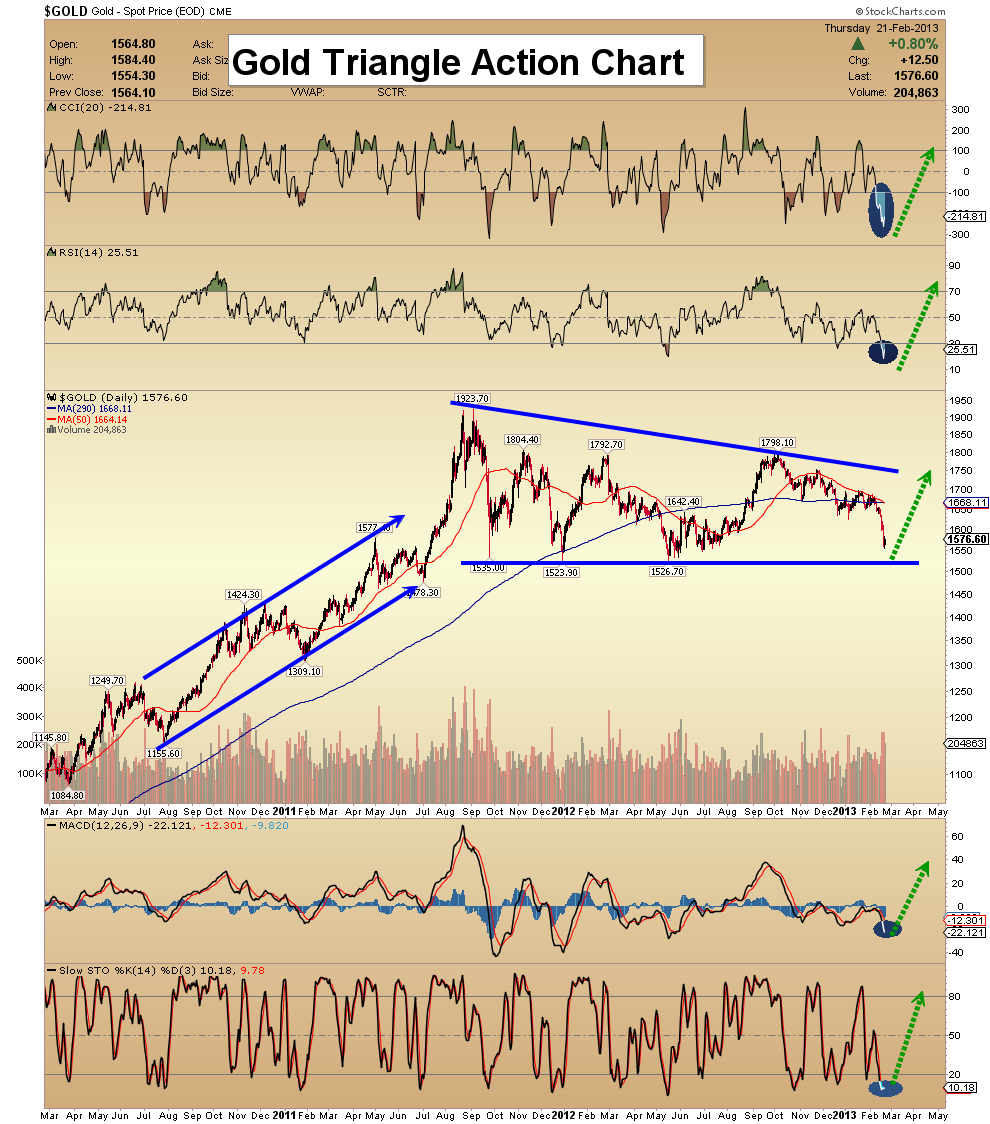
Gold Triangle Action Chart - This week, the bottom line of this symmetrical triangle was almost tested, but it held strong!
- Many technical indicators are now approaching oversold status. The RSI fell to under 20 at one point (now 25), and a CCI buy-signal spike is in play. Technically, gold looks superb, and is poised to rally.
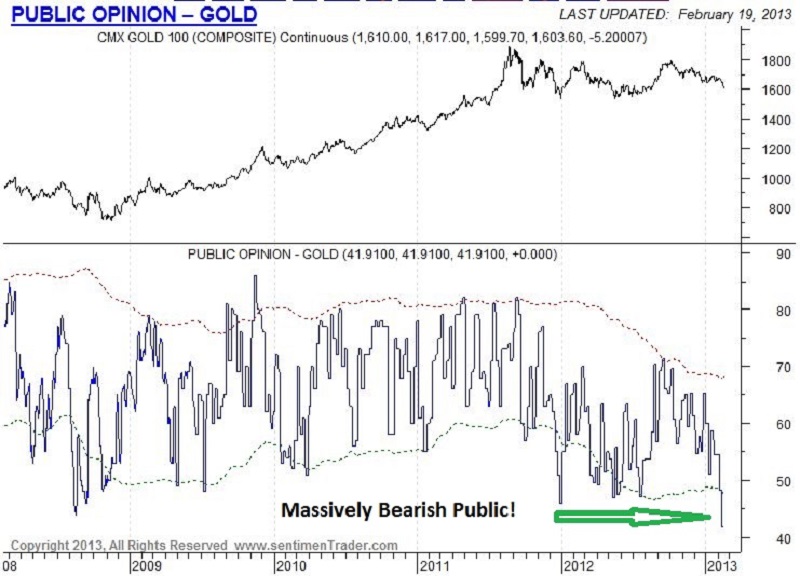
Gold Public Opinion Chart - The public’s level of ownership has declined to a level not seen since the lows of 2008. This indicates gold is probably making a major market bottom.
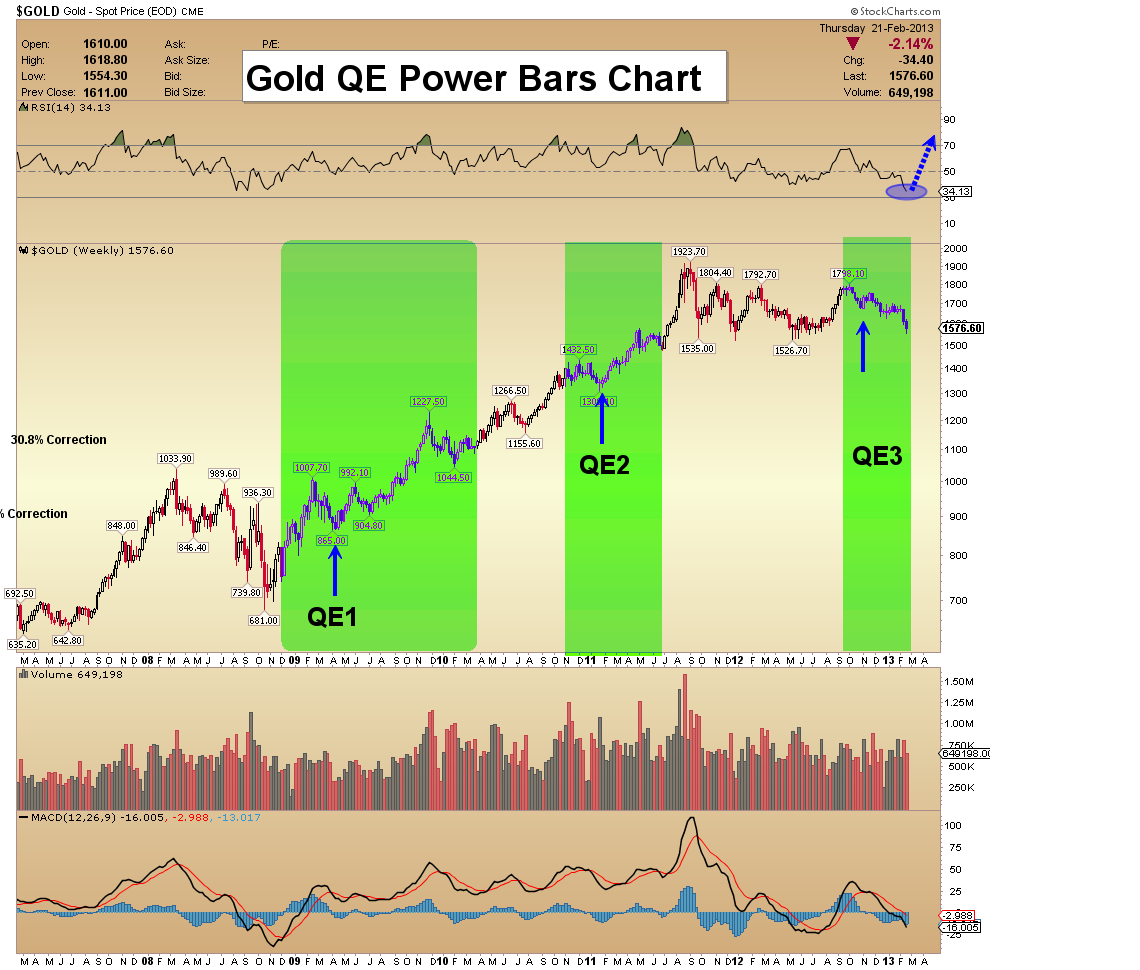
Gold QE Bars Chart - After the Fed unveiled QE1 & QE2, gold rallied strongly. This time, it has declined. It’s been a very frustrating time for gold investors, but I want to point out that many money managers have moved their focus away from gold, to the Dow and the S&P500.
- Business conditions have improved, but not dramatically. A sell-off in the general equity markets would bring the focus of money managers back to the gold market, and I think we’re on the cusp of such an event right now.
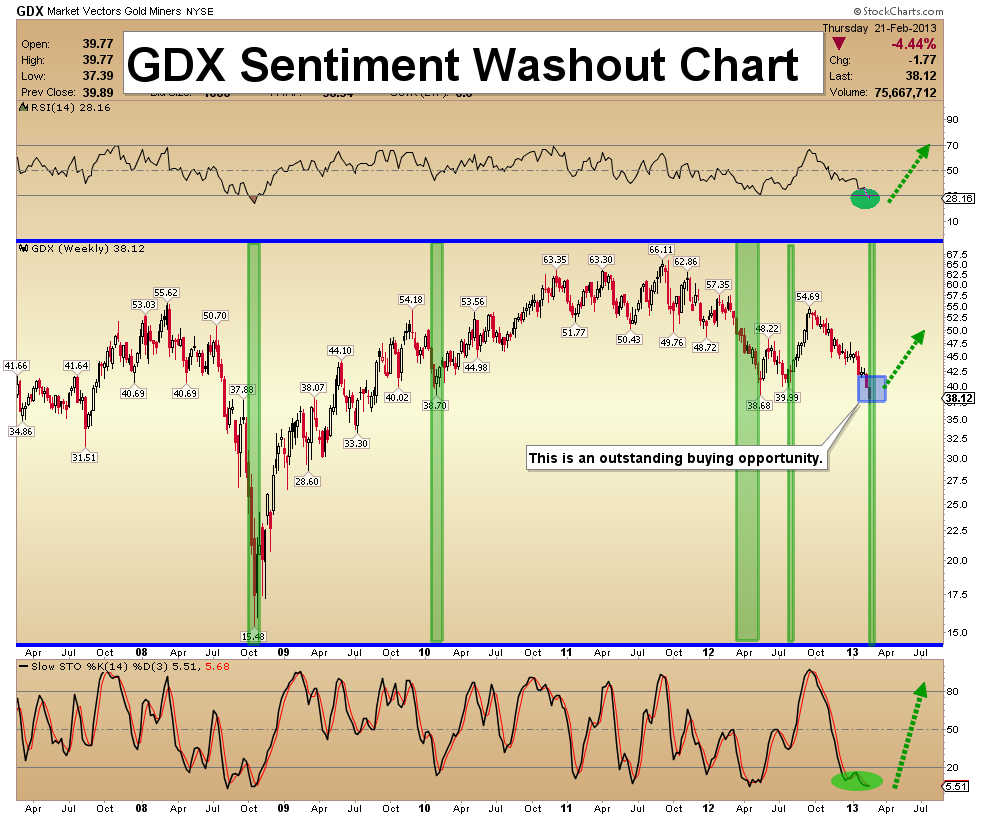
GDX Sentiment Washout Chart - Gold stocks are more hated than any other asset, according to all the sentiment data that I study. This chart highlights the gold price action, after a number of “sentiment washouts”.
- There could be a test of this week’s lows, but this sentiment chart suggests that a major bottom is here.
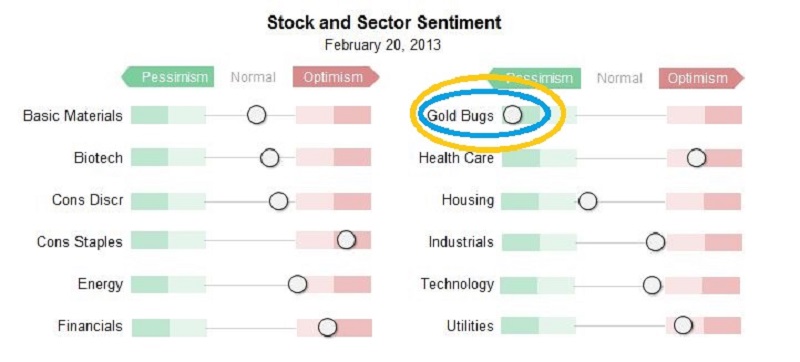
Market Sector Comparison Chart - This chart indicates what the average trader thinks of gold stocks. To take advantage of this negative sentiment, do the opposite of the crowd.
- When almost all the money flows out of a sector, like it has here, prices can only go in one direction, and that is… up!
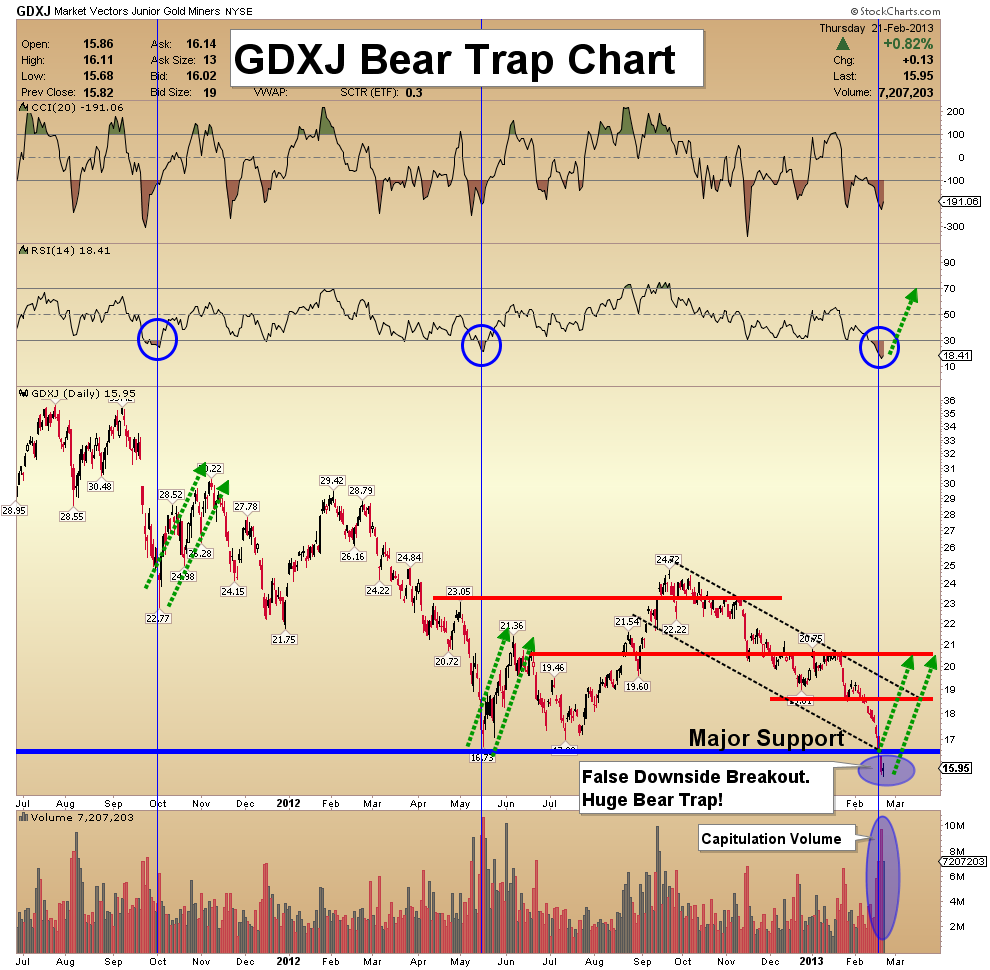
GDXJ Bear Trap Chart - GDXJ has moved lower, with gigantic volume. This type of selling has driven the key RSI indicator to historical lows. A rule of thumb is that once RSI goes below 25, buy orders can be placed.
- Bearish analysts think that GDXJ has broken down from major support, but I think this is a huge bear trap. Sentiment, climatic volume, and oscillator action suggest that junior gold stocks are about to reverse and surge higher, stunning the bears!
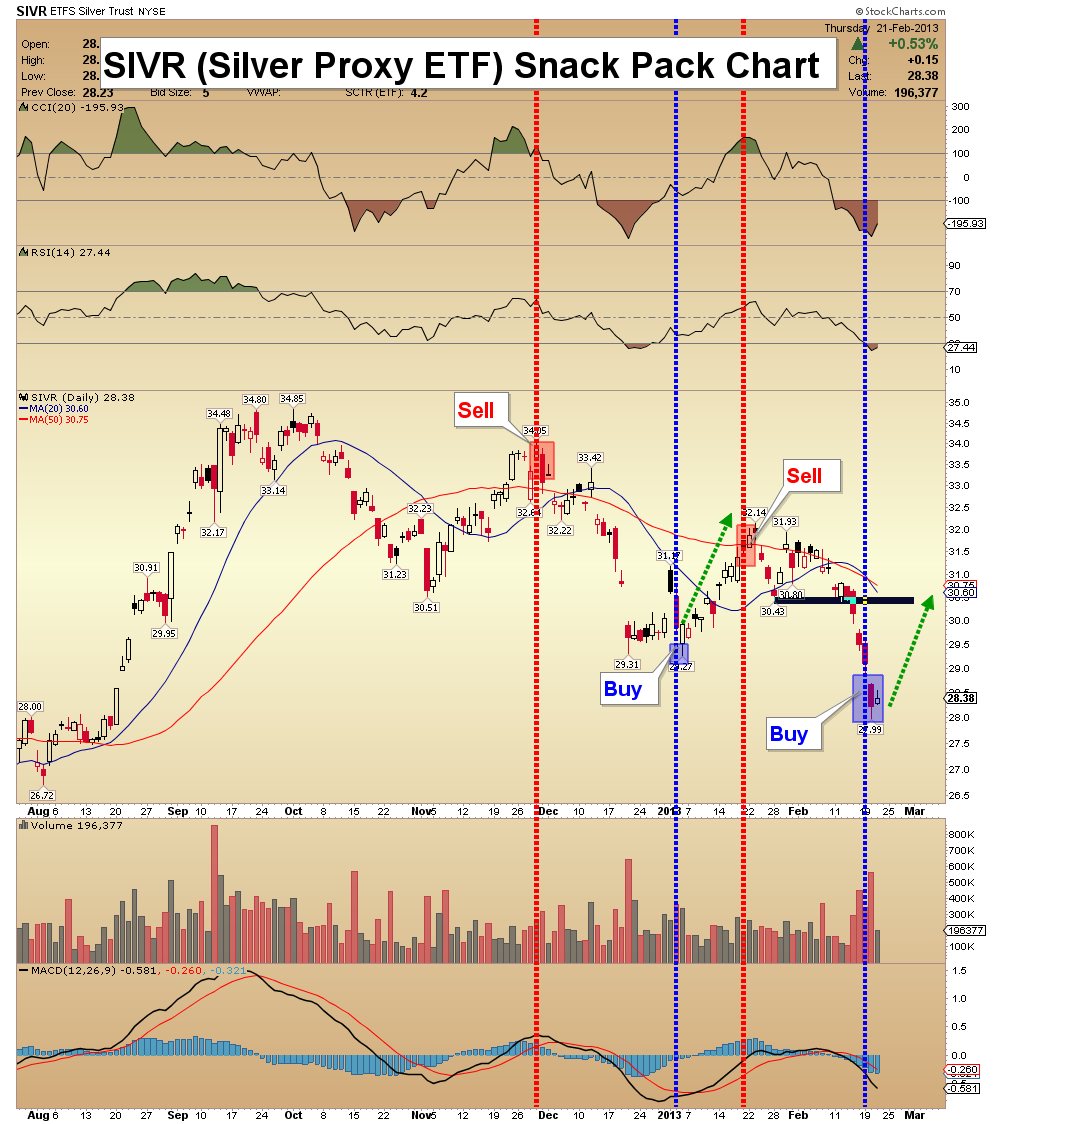
Silver Snack Pack Chart - Last week, silver was not on my immediate-buy list. It is now. Investors should buy modestly, and gamblers could be a little more aggressive, with the size of positions they take now.
- I call this the snack pack chart, because traders can enjoy modest “snack packs of profit”, by selling some positions for quick gains, while holding 70% of their position for banquet-sized profits.
- For silver investors, the bigger profits will come after inflation returns. That’s probably 2-4 years away, which is a long time to wait. So, I recommend that investors use 30% of silver positions, for short term trading!
Friday, Jul 3, 2026 Super Force Signals Unique Introduction For 321Gold Readers:
Send me an email to admin@supergoldsignals.com and I’ll send you my free “Inflation Thunder Now!” gold and silver stocks video report. I’ll also include 3 of my next Super Force Surge Signals free of charge, as I send them to paid subscribers. Thank you!
|
Stay alert for our Super Gold alerts, sent by email to subscribers,
for both the daily charts on Super Force Signals at www.supergoldsignals.com and for the 60 minute
charts at www.supergoldsignals.com
About Super
Gold Signals:
Our Surge Gold Signals are created thru our proprietary blend
of the highest quality technical analysis and many years of successful
business building. We are two business owners with excellent synergy.
We understand risk and reward. Our subscribers are generally successfully
business owners, people like yourself with speculative funds,
looking for serious management of your risk and reward in the
market.
Frank Johnson:
Executive Editor, Macro Risk Manager.
Morris Hubbartt: Chief Market Analyst, Trading Risk Specialist.
website: www.supergoldsignals.com
email:
admin@supergoldsignals.com
email: admin@supergold60.com
Mail:
1276 Lakeview Drive
Oakville, Ontario, L6H 2M8
Canada
### Feb 22, 2013
Morris Hubbartt
321gold Ltd
 |
