Super Force Signals - A Leading
Market Timing Service
We Take Every Trade Ourselves
Doctor Divergence In The Gold House
Morris Hubbartt
Weekly Market Update Excerpt
posted Feb 17, 2012
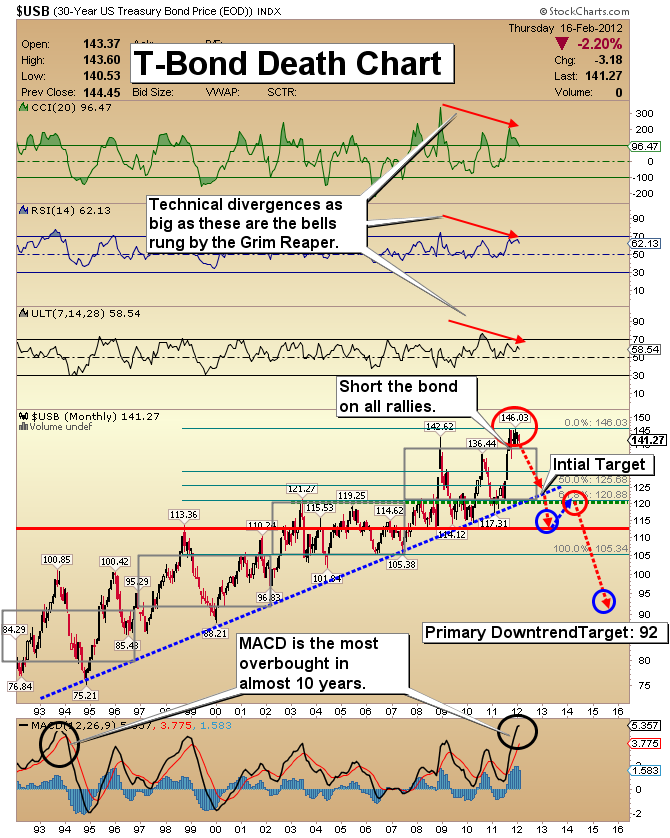
T-Bond Death Chart
- The largest bubble on the financial scene today is probably the US treasury market. For several weeks now, I have been arguing that a major bond market top is in place. Keep in mind that this is a slow process, and investors will be reluctant to believe it is all over.
- A common statement made by mainstream investors and financial advisors is that gold is a bad investment because it doesn’t pay any dividends. Yet these same managers tell investors to buy bonds that pay almost nothing.
- Soon these bonds may actually pay less than nothing. The Treasury Borrowing Advisory Committee brings together dealers and treasury officials. They recently met in a closed meeting at the Hays Adams Hotel.
- The committee members unanimously agreed that the Treasury should start permitting negative interest rate bids for T-bills. This is the kind of signpost that signifies the death of a 30 year bull market in bonds. Will financial advisors and money managers now promote negative yield investments to senior citizens?
- Keep in mind that every bar on the above chart is one month. This chart provides you with a long term view of the bond market. I have made reference in recent weeks to telling technical divergences on the daily bond chart. Now these divergences are appearing on to the monthly chart.
- Short all bond market rallies. My downside targets are 120, then 113, and then 92.
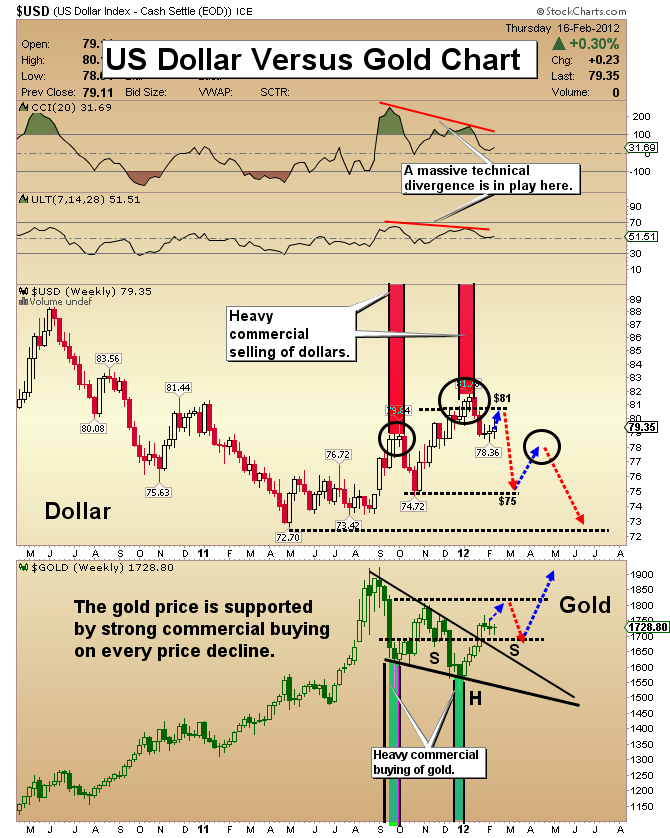
US Dollar Versus Gold Chart
- My work suggests the dollar could make a counter-trend move to the 81 area, but 75 is the next important target, and it is on the downside. The “smart money” sentiment indicators that I use continue to point to the growing risk of a serious dollar set-back.
- The counter trade to the dollar is gold. Note the gold price action on the lower portion of the above chart. I have been highlighting the substantial negative technical divergences on the dollar.
- The technical picture is just the opposite on the gold chart. One outstanding feature on both the dollar and gold charts is the activity of the commercial traders. On the dollar chart, rallies are met with heavy selling, while gold pullbacks are greeted with heavy buying. I expect this trend to continue, capping dollar rallies and supporting gold corrections.
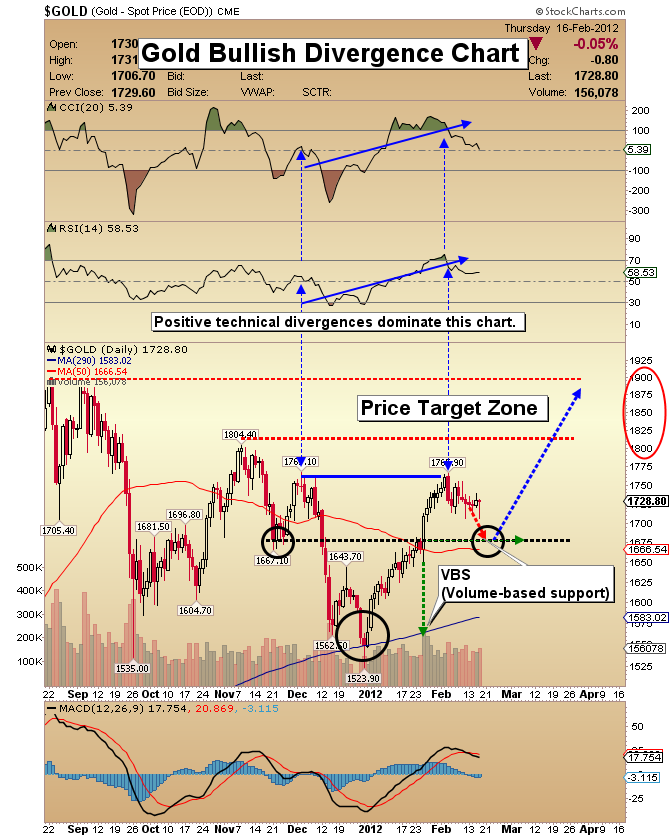
Gold Bullish Divergences Chart
- A subtle yet effective process for analyzing future moves in a market sector is looking for small but important technical divergences. This process is effective in determining where price is headed over the intermediate term.
- The dollar and the US Bond are both offering negative divergences, while gold, silver and gold stocks are all showing strong positives, indicating much higher prices are coming.
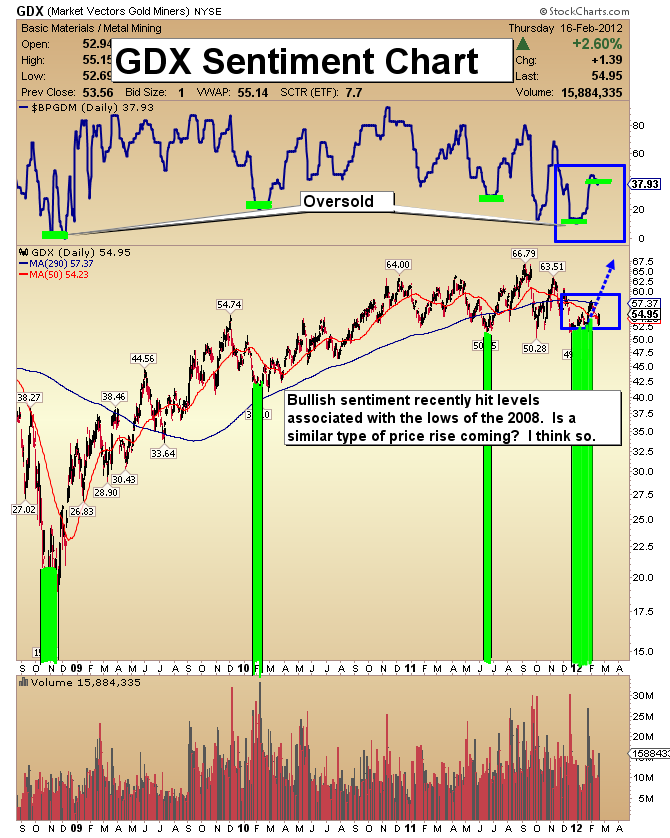
GDX Sentiment Chart
- My most effective tools for gauging a market are sentiment and volume analysis. Note the “fuel cell” volume identified on the above chart. This action is very healthy and points to higher prices on its own.
- Study the four key sentiment channels highlighted in green. The sentiment of the average investor towards gold stocks is almost as negative as it can be, and that is as bullish as it can be for the price of these stocks.
- I’m not just looking for a “trading pop” here. The negativity is now so great that once money starts to flow into the sector it could propel this market drastically higher. A short-covering rally is also possible, something that hasn’t occurred to any degree since 2008. I am projecting substantially higher prices for the next 12-18 months.
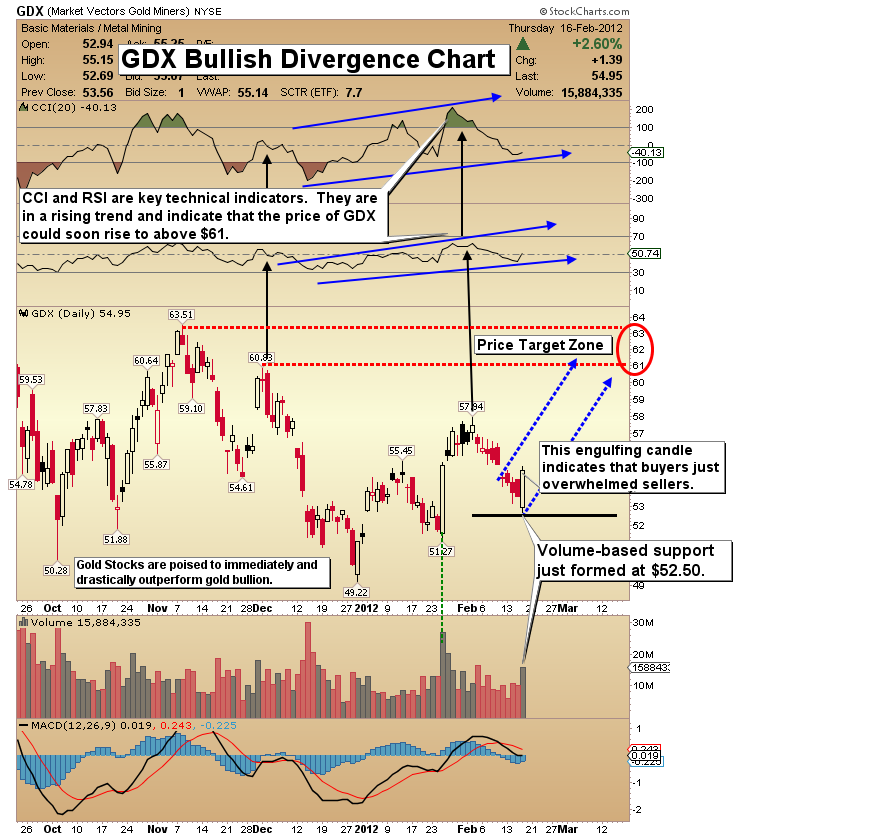
GDX Bullish Divergences Chart
- Gold stock bullish divergences are apparent and pointing to a substantially higher price. Another bullish feature of gold stocks is the very soft volume on the current pullback.
- A blast of volume came on the breakout move, and the price almost completed a flag pattern. The current pullback looks to be close to completion. I just issued trading buy signals for GDX. My first target is the $61-$63 price zone that I highlight on the above chart.
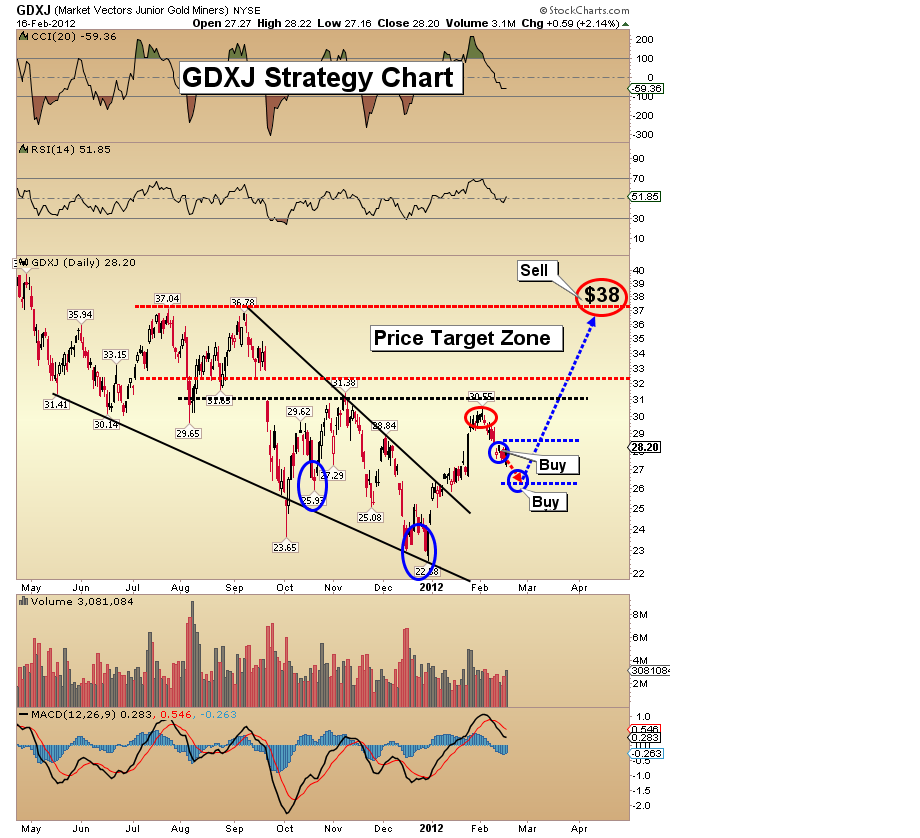
GDXJ Strategy Chart
- I see the current GDXJ trade unfolding in one of two ways. GDXJ could quickly drift down to the $26 area. Volume patterns are very constructive, and declined nicely with the price on this correction. This is exactly what the “bullish doctor” ordered for investors in the gold juniors house!
- The second possibility I see potentially happening, is a move straight up to the $31.50 area, followed by a move back down to $26. Regardless of the details, I see this current correction as probably the last opportunity to accumulate this quality asset at a price of under $30.
- When the GDXJ rally starts in earnest, I think it will surprise the hedge fund bears to the point they will have to cover their shorts and become buyers of the junior gold stocks asset class. GDXJ bought under $30 could produce enormous capital gains for value-oriented investors.
- You can see my target zone is the $32 to $38 price zone, which is perhaps better termed the “prize zone”! I think the $38 price will be exceeded before this intermediate term move ends.
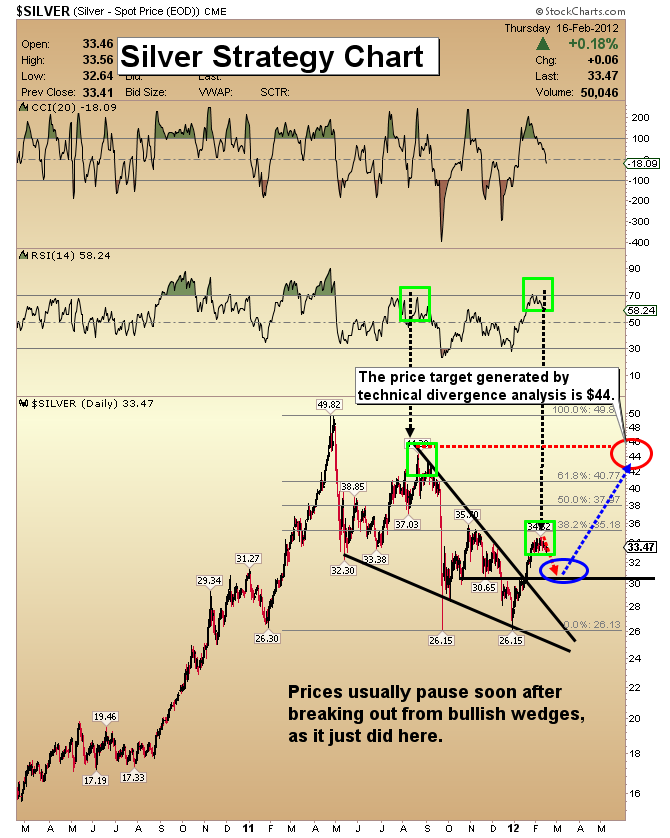
Silver Strategy Chart
- I’m highly impressed with the way silver is trading. Silver usually acts like gold stocks, falling hard on pullbacks. This time is different. Silver has mostly traded sideways after an enormous 35% rise. Silver is working off its technically overbought status with almost no correction in the price.
- I continue to like silver, yet at this point I would wait patiently for more substantial price weakness before you buy. The wedge on the chart is very positive, and so far it’s exactly what the doctor ordered. It is quite normal for this type of technical pattern breakout to be followed by a pause rather than an immediate blast higher.
- There is a substantial technical divergence in play. Technical indicators exceeded the highs they made at $44 with the price at a level of just $34. From the low point of about $26, a move to $44 represents a gain of almost 70%! I expect this target price will be acquired on this intermediate trend move to the upside.
Friday, Jul 3, 2026 Super Force Signals Unique Introduction For 321Gold Readers:
Send me an email to admin@supergoldsignals.com and I’ll send you my free “Inflation Thunder Now!” gold and silver stocks video report. I’ll also include 3 of my next Super Force Surge Signals free of charge, as I send them to paid subscribers. Thank you!
|
Stay alert for our Super Gold alerts, sent by email to subscribers,
for both the daily charts on Super Force Signals at www.supergoldsignals.com and for the 60 minute
charts at www.supergoldsignals.com
About Super
Gold Signals:
Our Surge Gold Signals are created thru our proprietary blend
of the highest quality technical analysis and many years of successful
business building. We are two business owners with excellent synergy.
We understand risk and reward. Our subscribers are generally successfully
business owners, people like yourself with speculative funds,
looking for serious management of your risk and reward in the
market.
Frank Johnson:
Executive Editor, Macro Risk Manager.
Morris Hubbartt: Chief Market Analyst, Trading Risk Specialist.
website: www.supergoldsignals.com
email:
admin@supergoldsignals.com
email: admin@supergold60.com
Mail:
1276 Lakeview Drive
Oakville, Ontario, L6H 2M8
Canada
###
Feb 17, 2012
Morris Hubbartt
321gold
Ltd

|
