Super Force Signals - A Leading Market Timing Service
We Take Every Trade Ourselves
Gold Triangle Action Update Morris Hubbartt
Weekly Market Update Excerpt
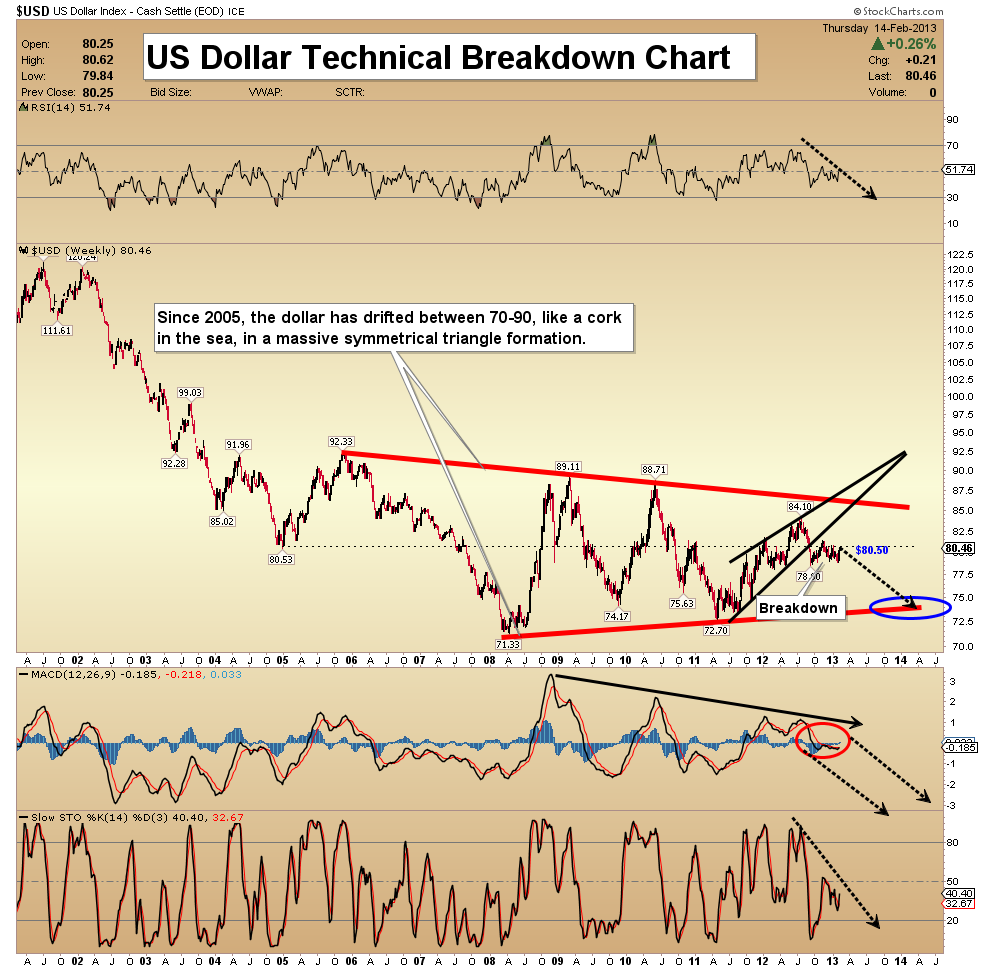
posted Feb 15, 2013 US Dollar Technical Breakdown Chart - Fundamentally, the US dollar is at great risk. Even if politicians make headway in spending cuts in the coming months, it won’t stop the debt from growing.
- According to CNS news, about 11,000 people sign up for the Supplemental Assistance Nutrition Program (food stamps) every day. As the United States heads back into recession, maintaining a social net will be priority number one.
- So, leaders can attempt to make progress, but the debt is now over $16.5 trillion. Unfunded liabilities are more than seven times that amount. A debased currency or much higher interest rates are the government’s ultimate choice.
- This weekly chart of the US dollar looks very weak. The struggle with the 80.50 area is ongoing.
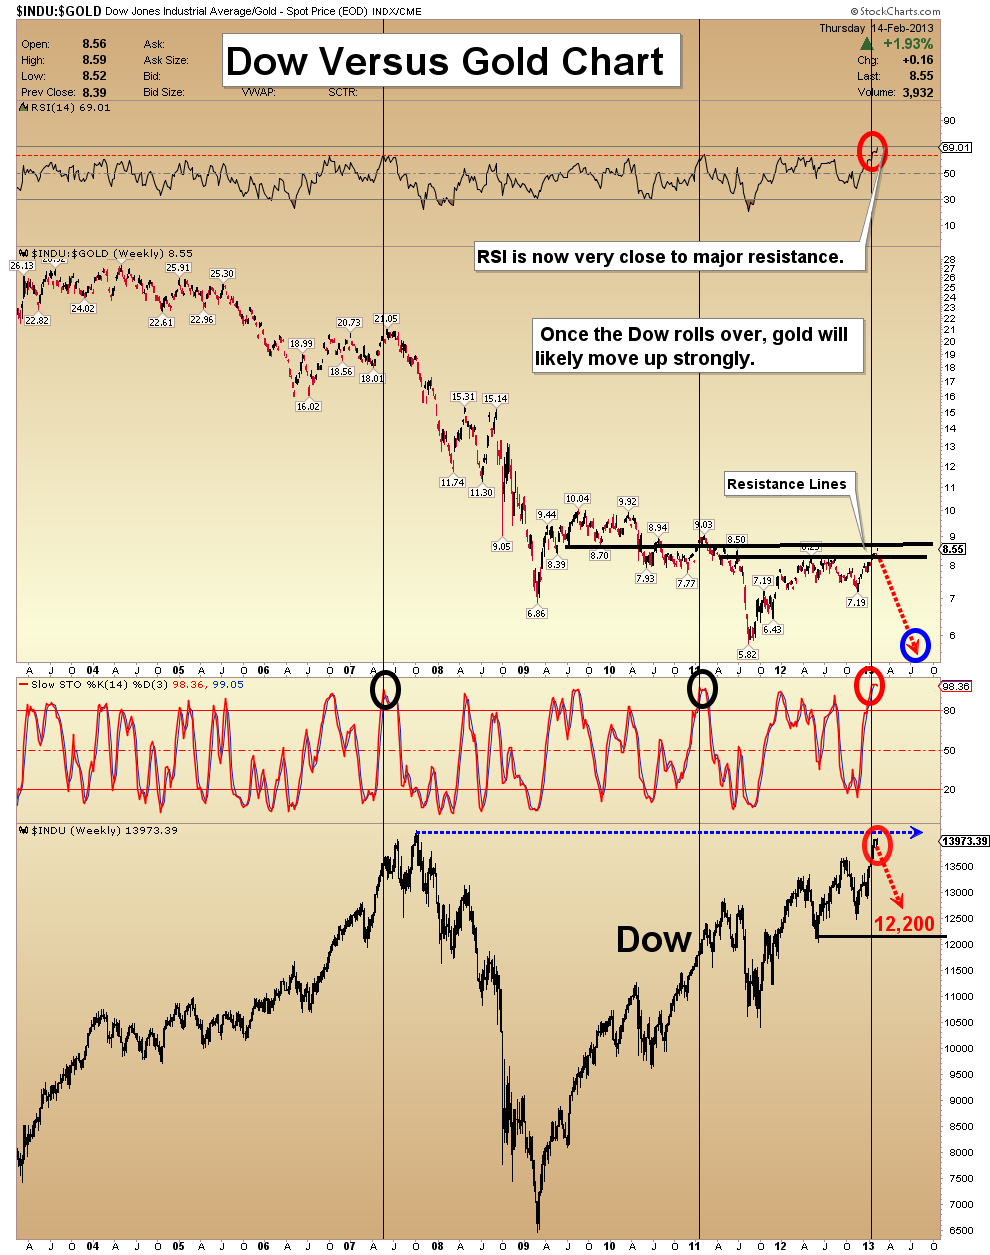
Dow Versus Gold Chart - On this key weekly chart, the RSI oscillator is now at the highest point in 10 years. Yet when looking at the price action of the Dow against gold, the Dow has barely bounced.
- This chart is a signpost for investors; once the stockmarket starts correcting, a major gold rally should occur across the entire precious metals sector. Compared to gold, the Dow is vastly overvalued.
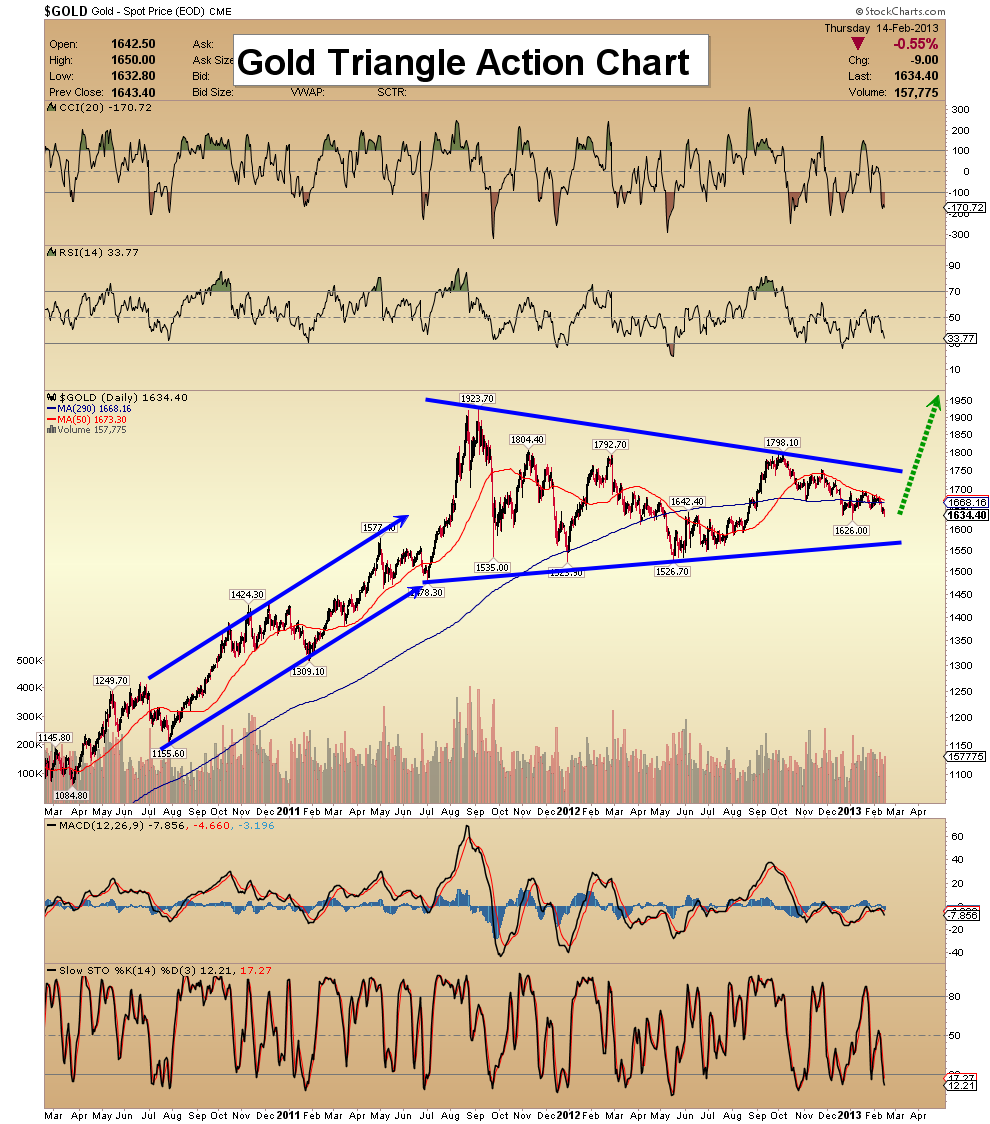
Gold Triangle Action Chart - The fundamental issues that are negative for the dollar are also very bullish for gold.
- With the long-term trend of gold being up, this enormous symmetrical triangle is likely to breakout to the upside.
- A symmetrical triangle is usually formed during a consolidation period. In the case of gold, the consolidation has gone on now for nearly a year and half. The larger the base, the greater the rise out of the bull market consolidation pattern.
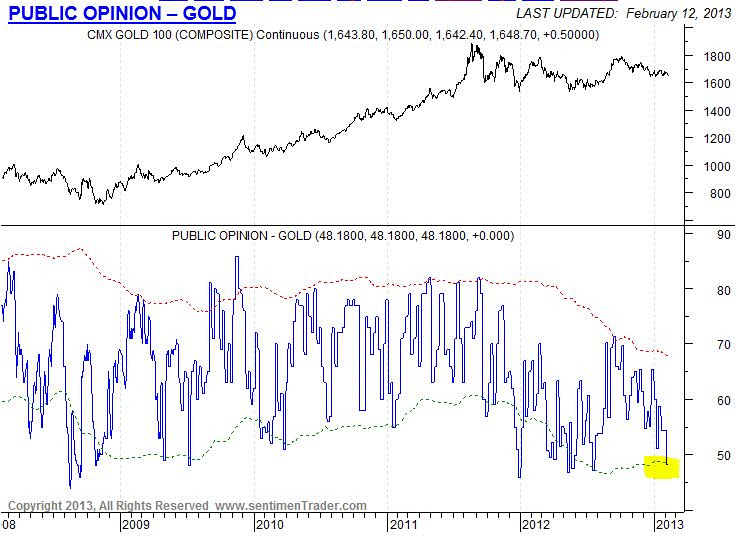
Gold Public Opinion Chart - Strong evidence indicating that the gold bull market is ready to start a new leg higher, is public opinion.
- I’ve highlighted the latest data from www.sentimentrader.com , released this week. The chart shows that public investors are carrying very few long positions. It adds weight to my view that a bullish breakout from the weekly chart triangle will occur.
- Commercial traders appear to be engaged in a substantial amount of gold accumulation. The key COT data is updated after Friday’s market close.
- The public’s action in the gold market is pretty much the exact opposite of commercial buyers, and that is good news for gold investors. I will do a free “COT Report Video Update” for 321gold readers on Friday evening, Feb 15, 2013. Send me an email to trading@superforcesignals.com , and I’ll send it to you.
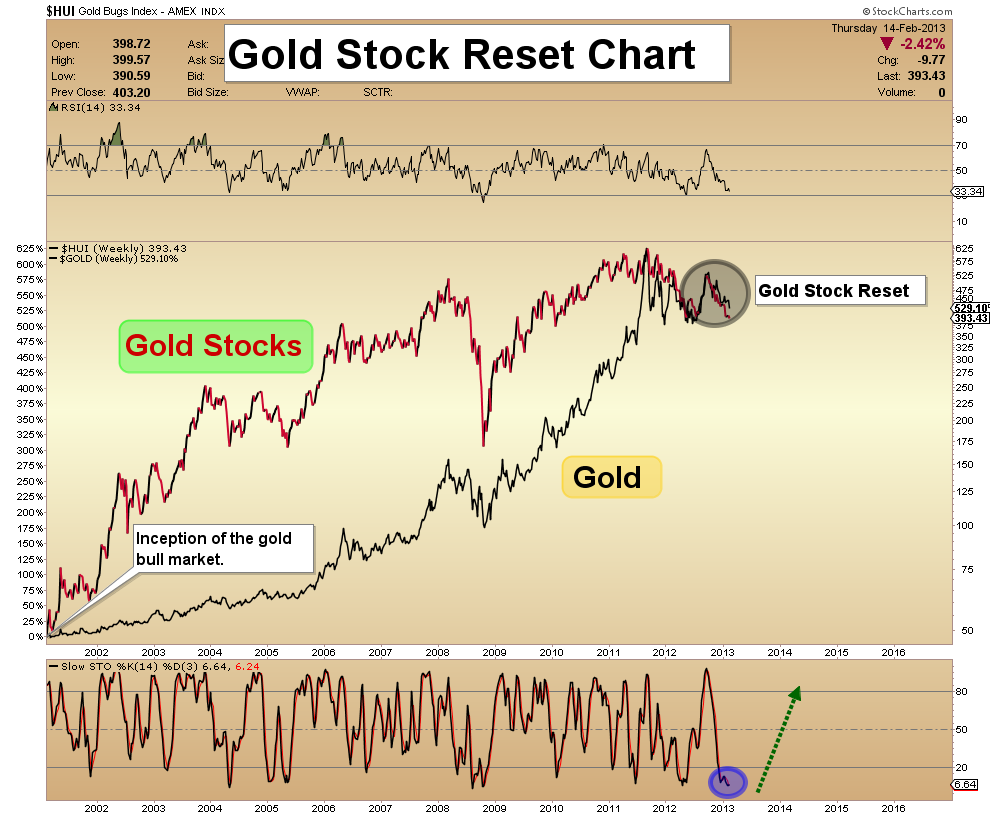
Gold Stocks (GDX) Reset Chart - Compared to gold, gold stocks are now nearly at break-even, over the life of the bull market. The latest sell-off has literally put most gold stocks back at “ground zero”.
- As the bull resumes I believe gold stocks will lead all world markets higher. That may be hard to believe, but the “reset” in this asset class puts gold stocks in a position to be a strong performer for years to come, even stronger than gold itself.
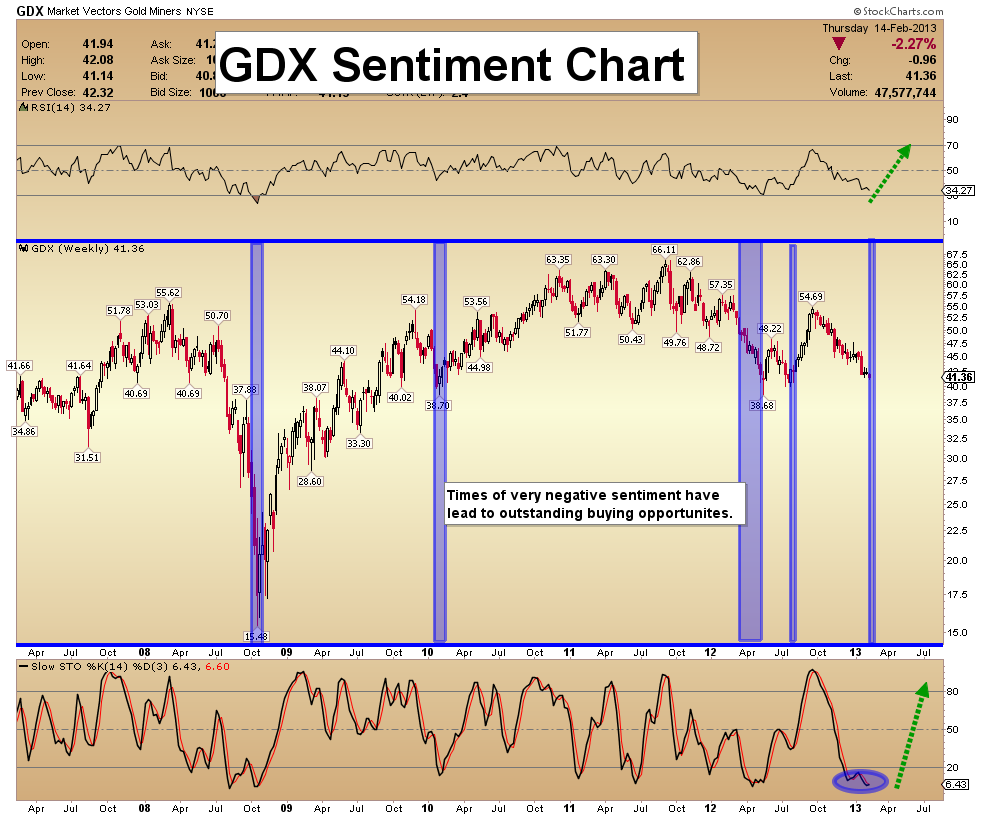
GDX Sentiment Chart - In the chart below I have highlighted five times in recent market history, dating back to 2007, when sentiment was very negative, including the current market.
- Without exception, if investors held positions and bought more, their returns were quite impressive. I am adding longs now, preparing for higher prices. When everyone else is out of a market that is the time to be in it.
- Note the position of the slow stokes oscillator at the bottom of the chart. It’s dramatically oversold, like it was at the other points of “sentiment capitulation”.
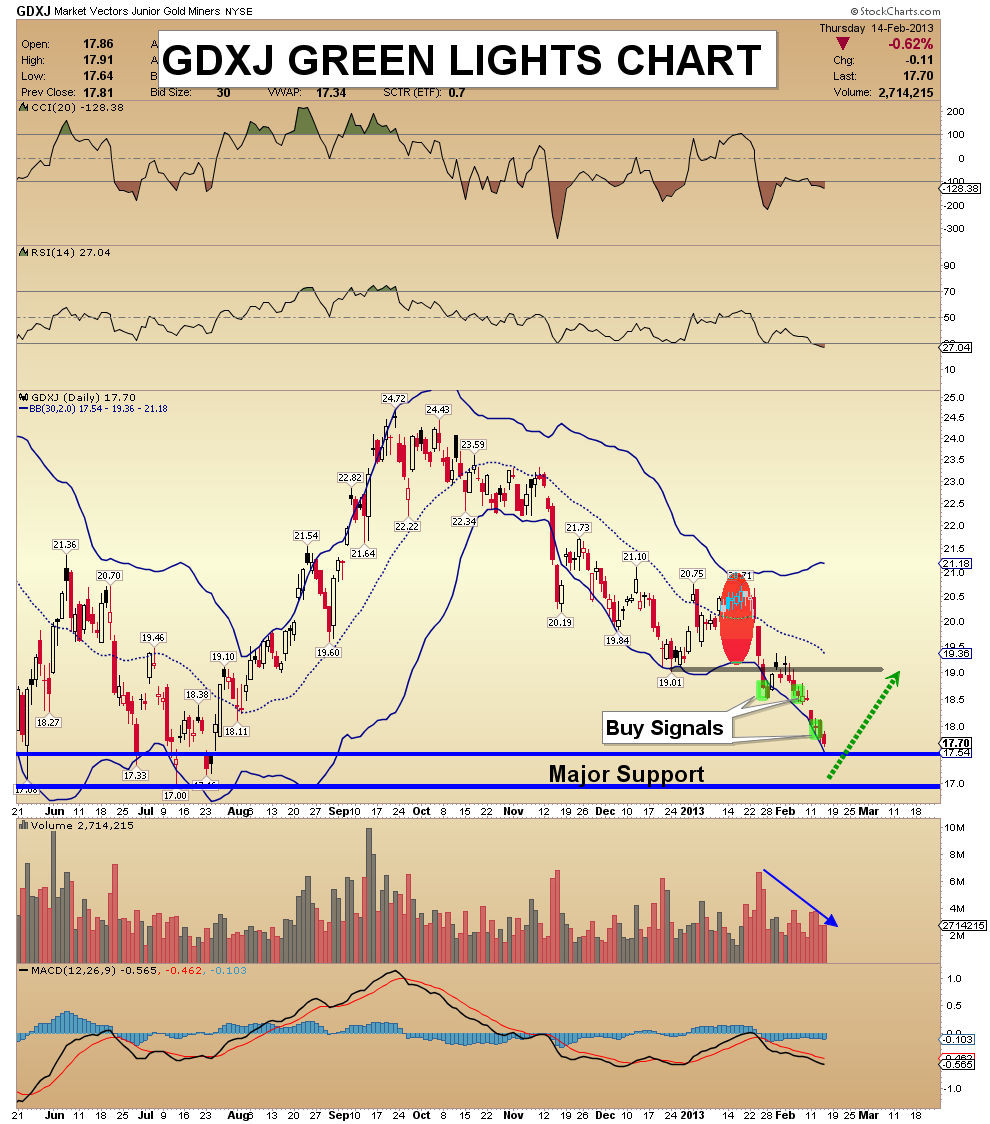
GDXJ Green Lights Chart - GDXJ is now approaching major support. Volume patterns continue to soften, as price moves lower. The bottom Bollinger band is not broken. The narrowing bands highlighted in red did warn of the current downside volatility.
- Don't go “all in”, but some buying makes sense at these levels. Note the 3 buy signals highlighted in green.
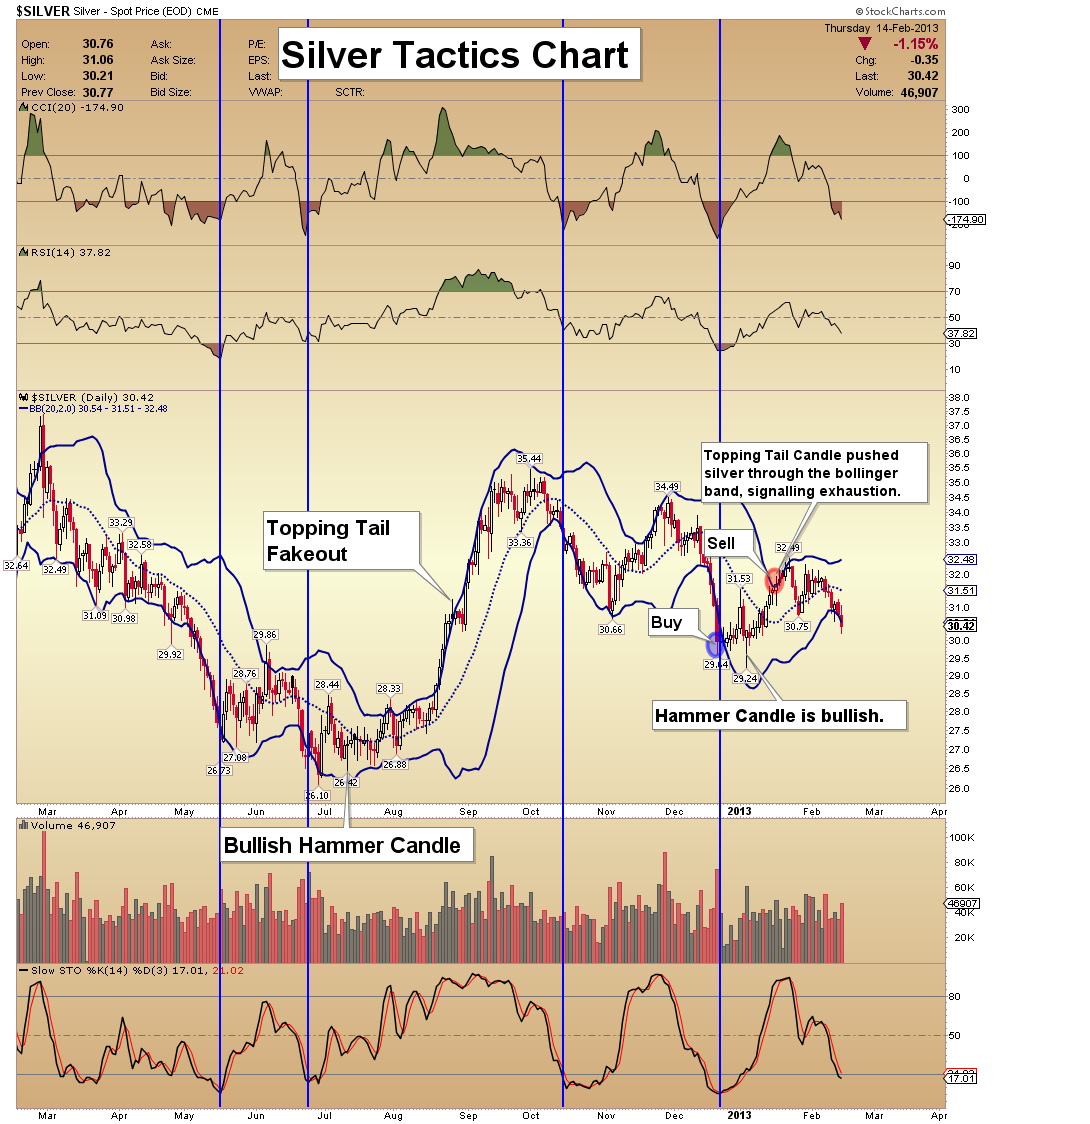
Silver Tactics Chart - Technically, I’d like you to make note of the 2 topping tail candles formation on this chart. The first one was overwhelmed by momentum buyers. The second one came during a trading market, rather than a trending one, so it carried more “technical weight”.
- Also, please note the bullish hammer candles. When they occur, substantial price advances tend to follow, but there is a substantial lag period before the move gets underway. That’s the situation in play now.
- Silver is the only metal that has been on my sell list recently. Prices are coming down, and I may issue a fresh buy signal for traders today!
Friday, Jul 3, 2026 Super Force Signals Unique Introduction For 321Gold Readers:
Send me an email to admin@supergoldsignals.com and I’ll send you my free “Inflation Thunder Now!” gold and silver stocks video report. I’ll also include 3 of my next Super Force Surge Signals free of charge, as I send them to paid subscribers. Thank you!
|
Stay alert for our Super Gold alerts, sent by email to subscribers,
for both the daily charts on Super Force Signals at www.supergoldsignals.com and for the 60 minute
charts at www.supergoldsignals.com
About Super
Gold Signals:
Our Surge Gold Signals are created thru our proprietary blend
of the highest quality technical analysis and many years of successful
business building. We are two business owners with excellent synergy.
We understand risk and reward. Our subscribers are generally successfully
business owners, people like yourself with speculative funds,
looking for serious management of your risk and reward in the
market.
Frank Johnson:
Executive Editor, Macro Risk Manager.
Morris Hubbartt: Chief Market Analyst, Trading Risk Specialist.
website: www.supergoldsignals.com
email:
admin@supergoldsignals.com
email: admin@supergold60.com
Mail:
1276 Lakeview Drive
Oakville, Ontario, L6H 2M8
Canada
### Feb 15, 2013
Morris Hubbartt
321gold Ltd
 |
