Super Force Signals - A Leading
Market Timing Service
We Take Every Trade Ourselves
To Bond, Or Not To Bond?
Morris Hubbartt
Weekly Market Update Excerpt
posted Feb 10, 2012
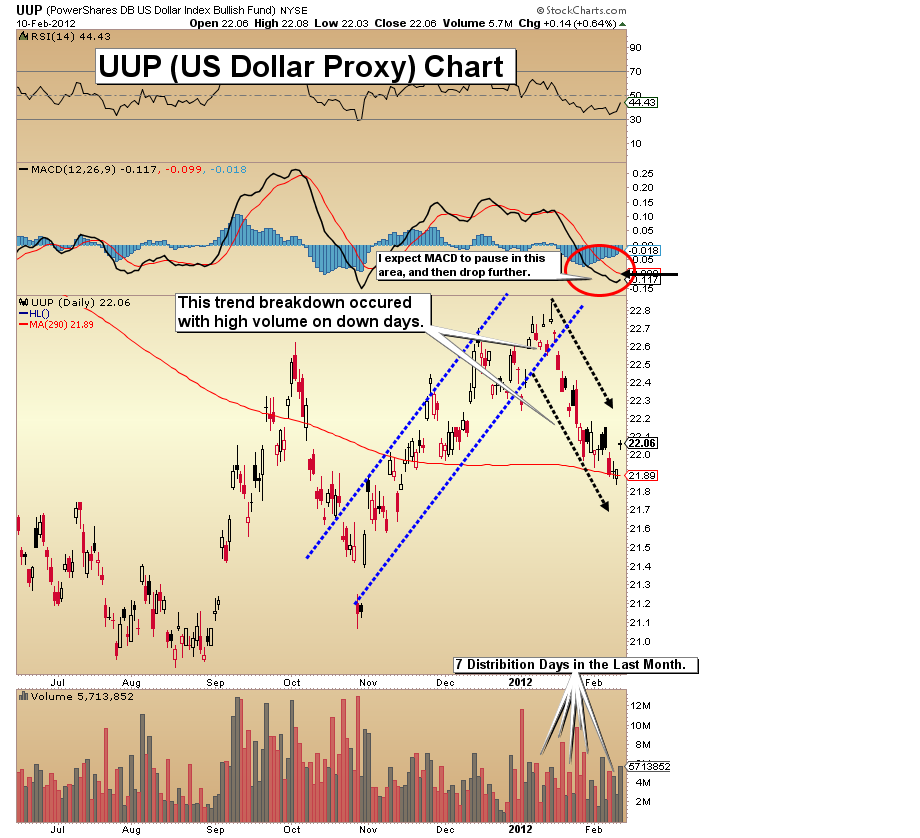
UUP (US Dollar Proxy) Chart
- Human behavior is predictable, because humans are a herd, although we are reluctant to admit it. Ever since the 2008 Lehman moment, the US Treasury bond and the US dollar have been perceived to be above reproach. Traders from around the world herd into these two markets each time other markets get into trouble.
- An event unforeseen by the herd could stun most investors. If they then concluded that it is the dollar and the bond that are the most fundamentally flawed markets, a truly terrifying panic could occur.
- The bond chart is of particular concern to me. The chart looks like a time bomb, and one that is close to detonating.
- I advocate using these turbulent markets as opportunities. Use times of turbulence to transfer paper investments into physical gold and silver rather than into bonds and dollars.
- We had a number of these opportunities late last year and those of you who took advantage of them have made money.
- The US dollar continues to display heavy distribution volume on the UUP proxy chart. The MACD indicator on the daily chart shows a steep decline, but rather than reversing, I believe it is now entering an area where a much sharper decline could occur.
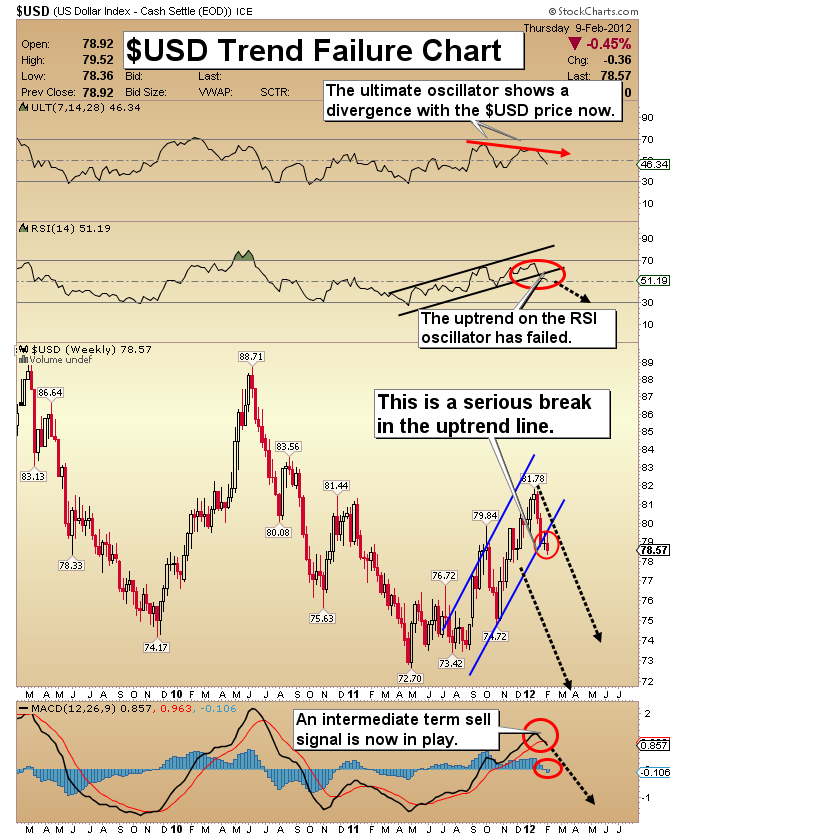
$USD Trend Failure Chart
- The positioning of the MACD indicator on the weekly chart paints a particularly disturbing picture for the US dollar. I have set a target of 72 on the downside, and it could be acquired by the fall of 2012. A trend line break is also evident. When considering the weight of the technical evidence, a large new leg down seems imminent.
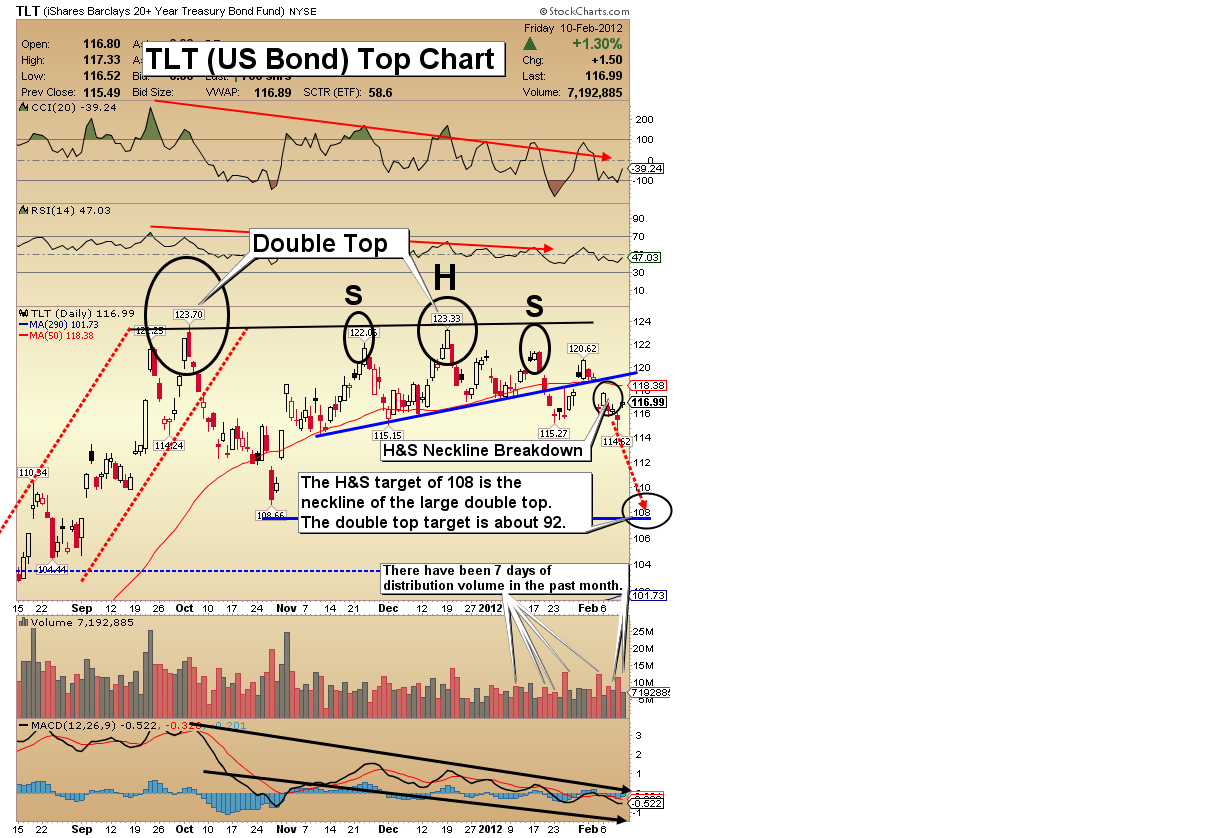
TLT (US T-Bond Proxy) Chart
- The bond market has become a terrible place for savers who rely on interest payments to live. Most savers don’t own T-bonds, so they haven’t benefited from the price appreciation of those bonds, but the yields on their payouts have been crushed.
- The average saver is invested in shorter term bonds or guaranteed investment “certificates” with tiny yields. After inflation is considered, most savers are probably receiving a negative rate of return. This fact makes bonds more risky than the average investor realizes.
- Like the dollar, US bonds are plagued with distribution volume, and the price chart is starting to creak under this “sell weight”. My indicators project 108 is the short term target for TLT, and 92 is the technical target projected by the larger double top pattern.
- US bonds are carving out a major long term top on the price chart. Investors should either avoid US bonds or short them on rallies.
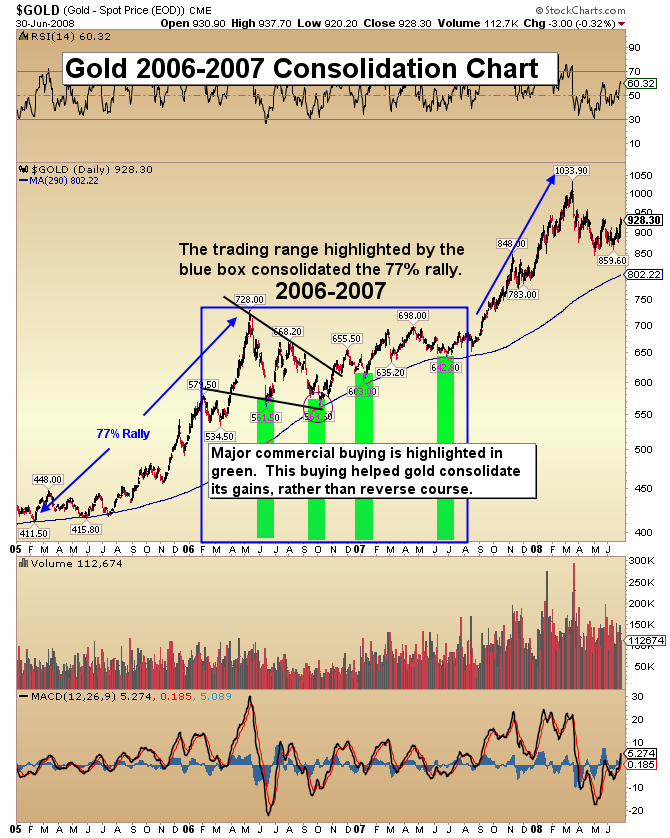
Gold 2006-2007 Price Consolidation Chart
- This market is very similar to 2006-2007 market, where every large pullback then was greeted by substantial commercial buying.
- Gold appears to be in the early stages of a powerful cycle that could target $2100, $2500, and finally $2800 by March of 2013. On this historic 2006-2007 consolidation chart I have highlighted key characteristics of that time frame to show you how it compares to the current consolidation.
- Two periods of commercial buying in this correction have already occurred, and I am projecting that two more are still to come.
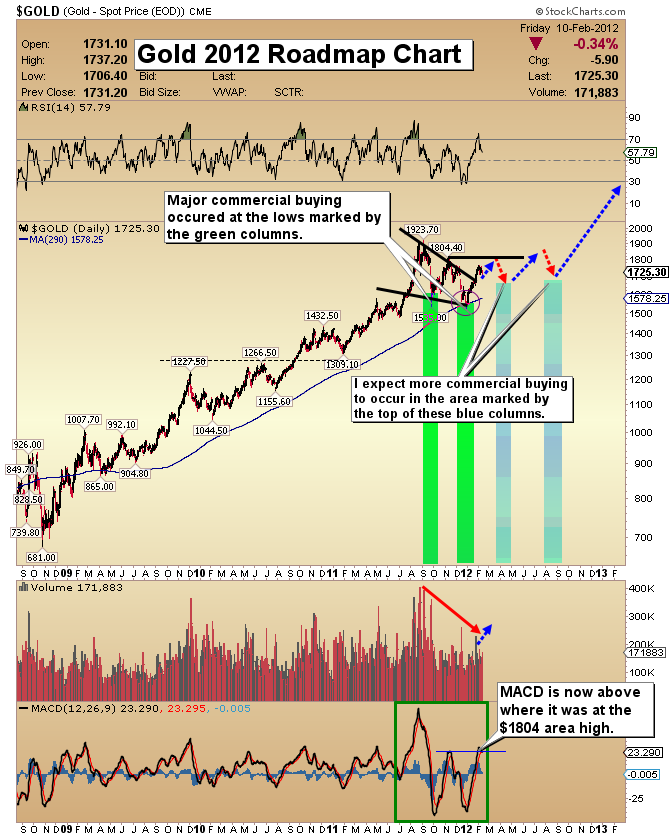
Gold 2012 Roadmap Chart
- You have witnessed a rally of almost $250 in gold. The rally was fueled in part by strong speculation about higher prices in an election year. This rise in price is now being greeted by modest commercial selling, which is perfectly normal.
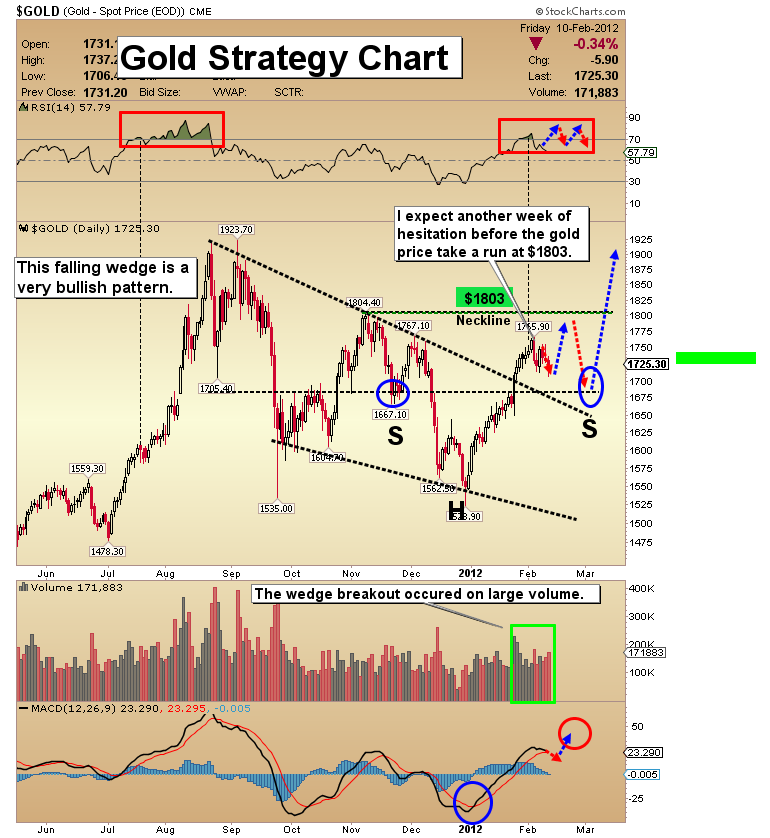
Gold Strategy Chart
- The next upside target is the $1803 price area. Once that target is acquired, I see a sharp pullback to about $1675, much sharper than the action this week.
- A substantial inverse head and shoulders appears to be forming now. From $1675, an enormous rally is possible, and could carry gold to about $2100.
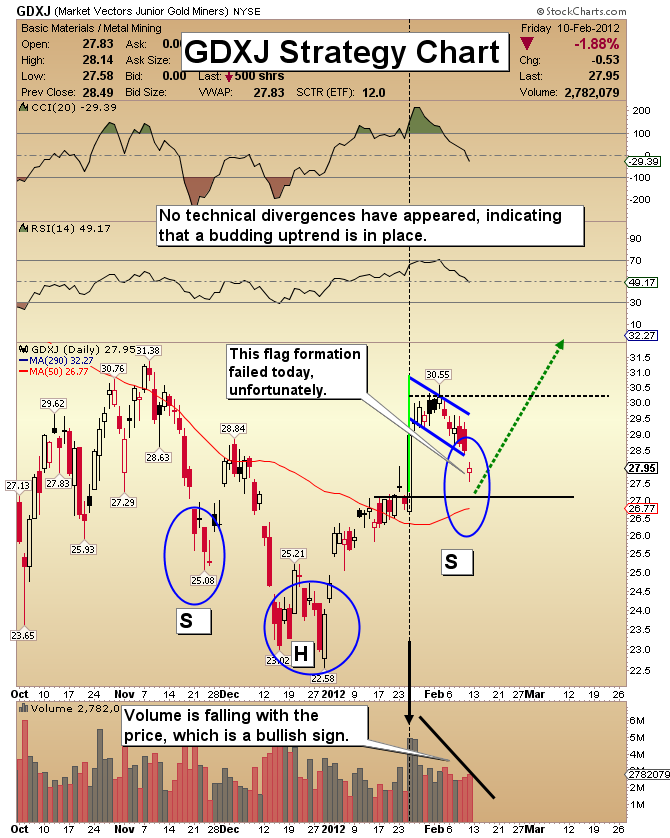
GDXJ Strategy Chart
- A bull flag formed after a sharp and strong-volume rally. The flag featured several days of sideways to lower price action on much weaker volume. The attempted rally out of the flag failed, but in doing so has created what is likely a much bigger and more bullish head and shoulder formation.
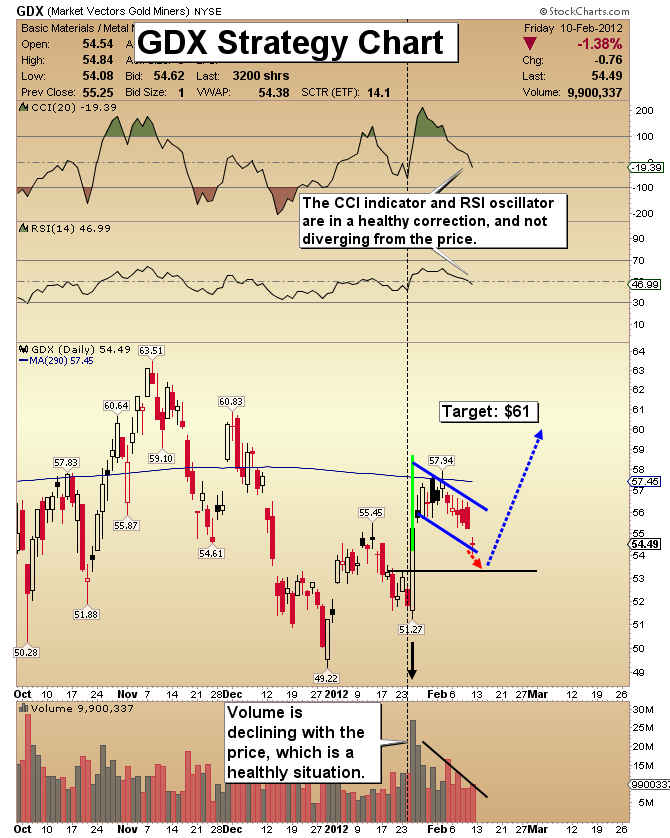
GDX Strategy Chart
- The current volume patterns for GDX are very healthy, and normal for a bull flag price pattern. My next upside target for GDX is $61.00.
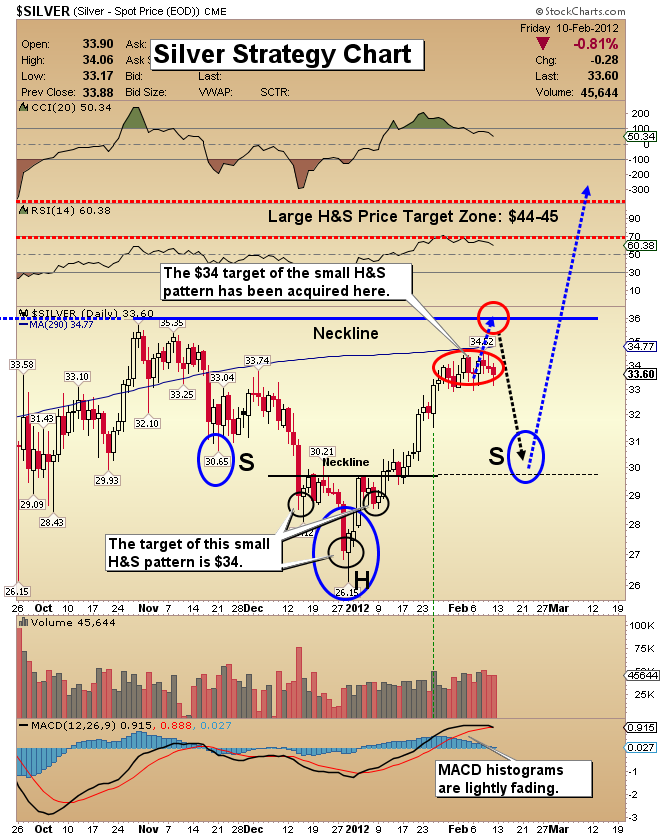
Silver Strategy Chart
- I have strongly asserted that silver was my asset of choice, particularly when it was trading under $30. Since then silver has rallied, and gained about 30% since late December. I continue to like silver. Because this debt crisis is intensifying rather than waning, it is prudent to move some silver into gold as the gold/silver ratio declines.
- I’ve highlighted a small head and shoulders pattern on the silver chart. The target of $34 was just acquired over the past week or so. MACD histograms are beginning to show a loss of momentum, but I’m projecting that the silver price could rise to about $36 before embarking on a bit of a nasty fall towards the $30 area.
- From $30, I expect a budding h&s pattern to be completed, creating a powerful rally that could carry the price to the $44-$45 price area!
Friday, Jul 24, 2026 Super Force Signals Unique Introduction For 321Gold Readers:
Send me an email to admin@supergoldsignals.com and I’ll send you my free “Inflation Thunder Now!” gold and silver stocks video report. I’ll also include 3 of my next Super Force Surge Signals free of charge, as I send them to paid subscribers. Thank you!
|
Stay alert for our Super Gold alerts, sent by email to subscribers,
for both the daily charts on Super Force Signals at www.supergoldsignals.com and for the 60 minute
charts at www.supergoldsignals.com
About Super
Gold Signals:
Our Surge Gold Signals are created thru our proprietary blend
of the highest quality technical analysis and many years of successful
business building. We are two business owners with excellent synergy.
We understand risk and reward. Our subscribers are generally successfully
business owners, people like yourself with speculative funds,
looking for serious management of your risk and reward in the
market.
Frank Johnson:
Executive Editor, Macro Risk Manager.
Morris Hubbartt: Chief Market Analyst, Trading Risk Specialist.
website: www.supergoldsignals.com
email:
admin@supergoldsignals.com
email: admin@supergold60.com
Mail:
1276 Lakeview Drive
Oakville, Ontario, L6H 2M8
Canada
###
Feb 10, 2012
Morris Hubbartt
321gold
Ltd

|
