Super Force Signals - A Leading Market Timing Service
We Take Every Trade Ourselves
Dow Horror & GDXJ Green Light Morris Hubbartt
Weekly Market Update Excerpt
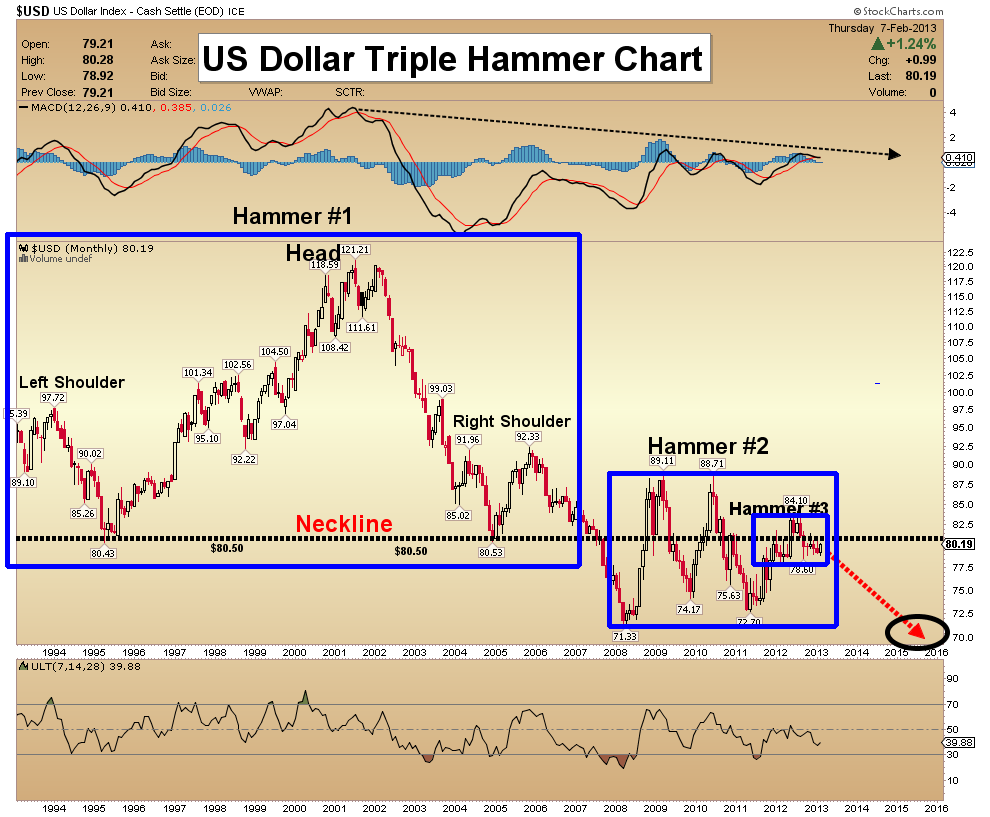
posted Feb 8, 2013 US Dollar Triple Hammer Chart - Other than during times of panic, the dollar can’t seem to trade above 80.50. That’s a key level to study, on this monthly chart.
- The price action over the past several years indicates that the bulls are failing more often, in their effort to move the dollar above this resistance level. This 80.50 resistance zone was created by the dollar’s monthly chart lows of 1995 and 2005. Even the 2008 crisis failed to rally the dollar very far into the 80.50 “wall of stone”.
- If the implosion of Lehman could only get the dollar to 89.11, is there really any hope for the bulls now? I don’t think there is. I’ve labeled this chart the “Triple Hammer Chart”, because I see 3 powerful chart patterns, and all of them are very bearish for the dollar. As big as it is, the 3rd hammer looks tiny, compared to even the 2nd one, let alone compared to hammer #1.
- Hammer #3 is the head & shoulders top pattern that many chartists are following on their daily charts. The target is the 72 area.
- Hammer #2 is the trading range between 71.33 and 89.11, and the target is the 53 area.
- Hammer #1 is the largest hammer of all. It’s defined by the price range of 80.43-121.21, and the target is about 40 for the dollar.
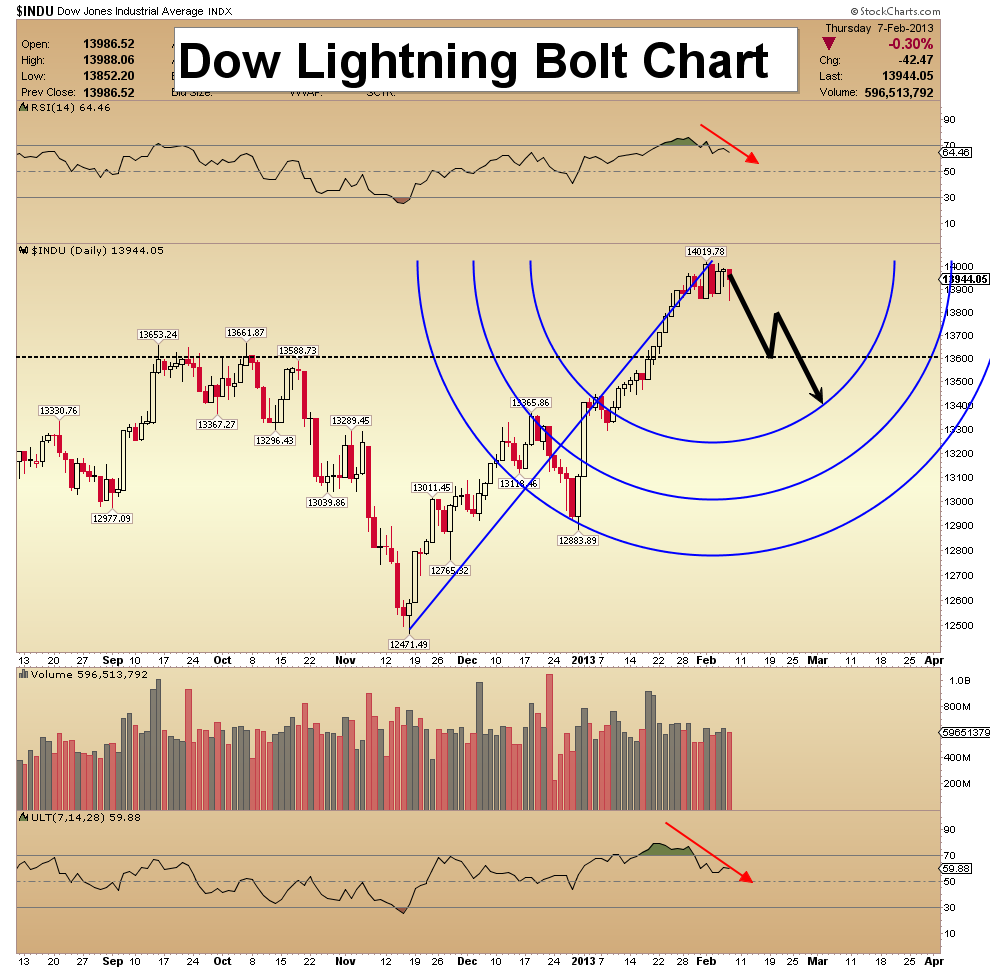
Dow Lightning Bolt Chart - Over the past week, I have done some in-depth video analysis of the US stock market for my subscribers. My 14,000 target has been acquired. A key Fibonacci arc pattern is in play now. Whether the Dow sells off from here, or displays a “blow-off top” in the 14,500 area, the trend is changing, from up to down.
- Before this year ends, the Dow may trade down to 11,200. My suggestion is to begin buying in the 12,200 area, but save your biggest buys for the 11,200 zone.
- On Thursday, gold traded in the opposite direction that the Dow did, and that’s good news. I expect gold to rally strongly, as the Dow careens down to 13,400, like it was hit by a bolt of lightning.
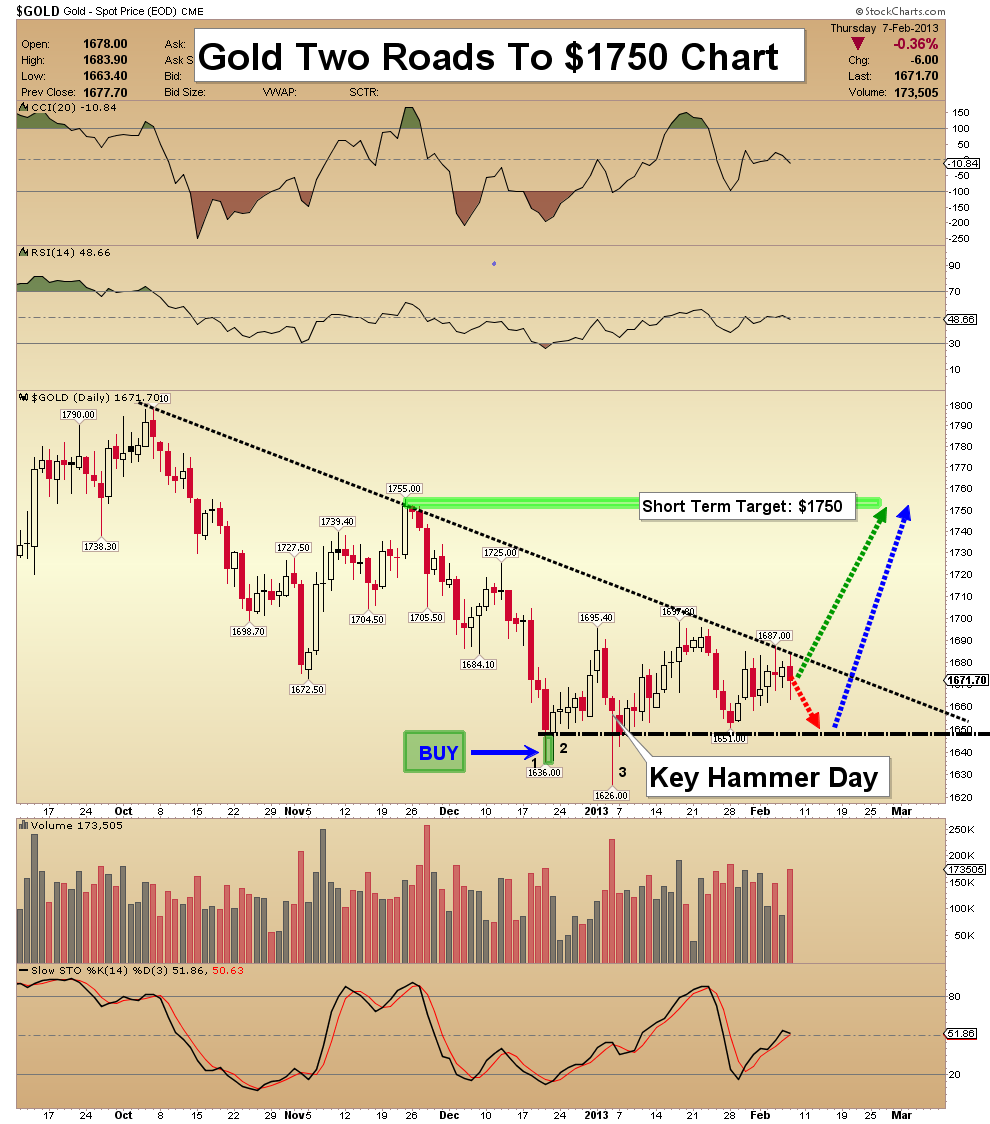
Gold Two Roads To $1750 Chart - Since the fall of 2011, gold has been locked in a stubborn trading range. As frustrating as this is, an enormous base is required to facilitate the kind of bullish action we all want to see. If gold just rises up quickly like a 1970s flagpole, it will crash and burn.
- Some analysts might be able to get you out at the top of such a flagpole, but that’s a pretty risky way to handle your family’s money. A permanently higher gold price is what all gold stock investors need, rather than a “one trick pony ride”.
- Strong hands and central banks are buyers of gold in this price range. Note where I got my latest buy signal, on Dec 20th. The entry was in the $1640 area.
- From here, I have two short term scenarios. The first involves a quick pullback to $1648, and then a price surge to $1750. The 2nd scenario sees gold just charge right to $1750. The action of the Dow is going to be a key factor in determining how gold gets to $1750.
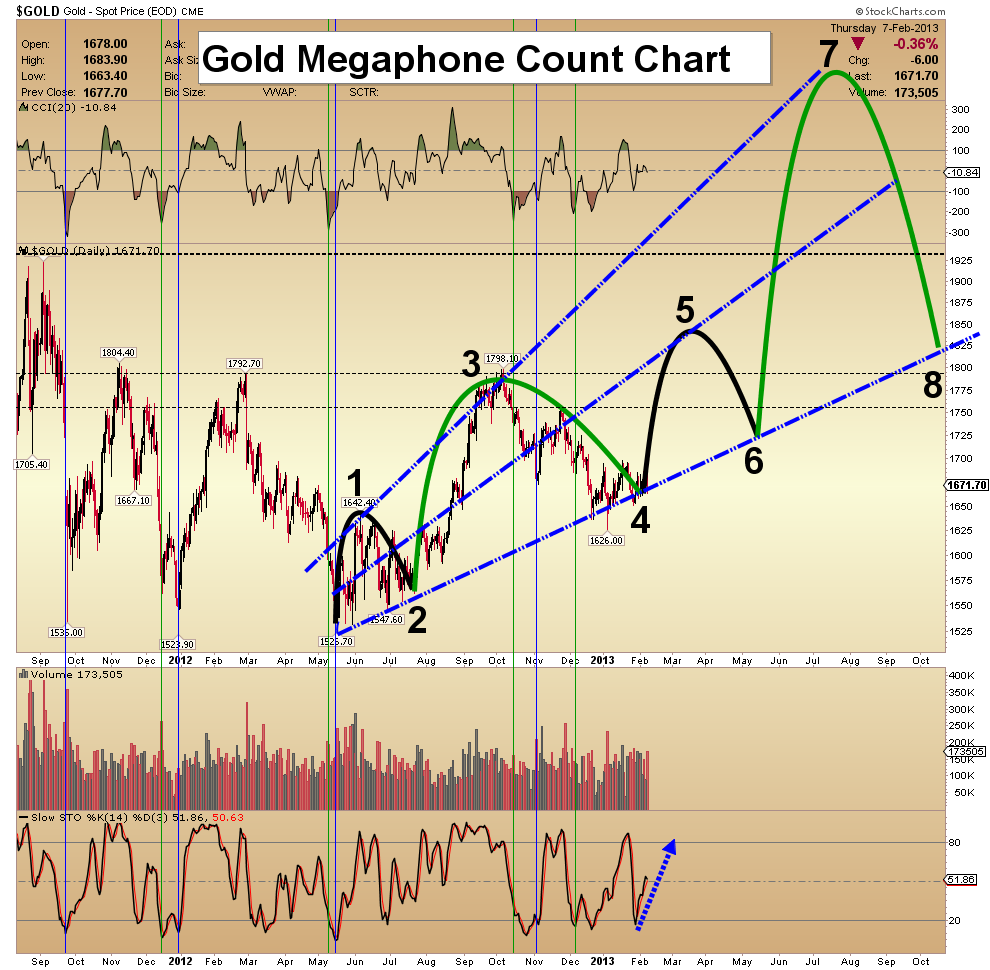
Gold Megaphone Count Chart - This bull market in gold has caught analysts & investors off guard, many times. I think it will continue to do so. For example, most investors believe that once gold goes above $1800, the wind will be at our backs, and gold investors will live “happily ever after”.
- Instead, my charts show gold rising to $2300, but getting there could be a very bumpy road. Gold could rally to $1850 now, but from there I see a very painful correction taking place. It could drive gold back down to $1725.
- Investors should definitely consider selling some positions in gold, in the $1850 area.
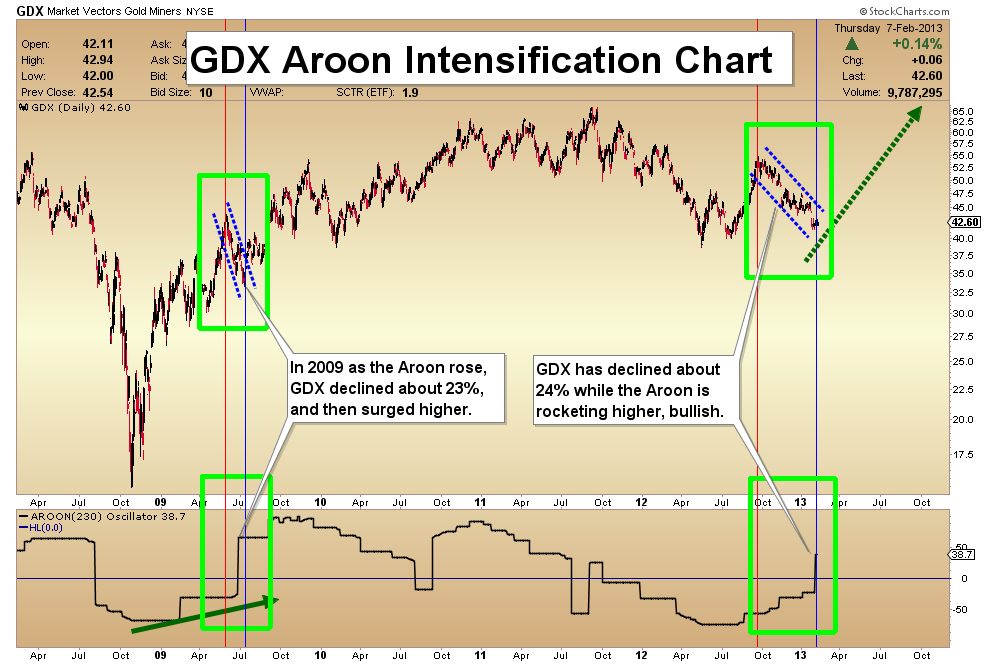
GDX Aroon Intensification Chart - The Aroon indicator, which means “early dawn” in Sanskrit, jumped significantly this week. It has been trending higher since early September, but as on Monday, it moved aggressively.
- What is encouraging is that the last time this indicator came out of the hole in 2009, GDX nearly doubled over the next couple of years. Note the comparison to 2009 on this chart.
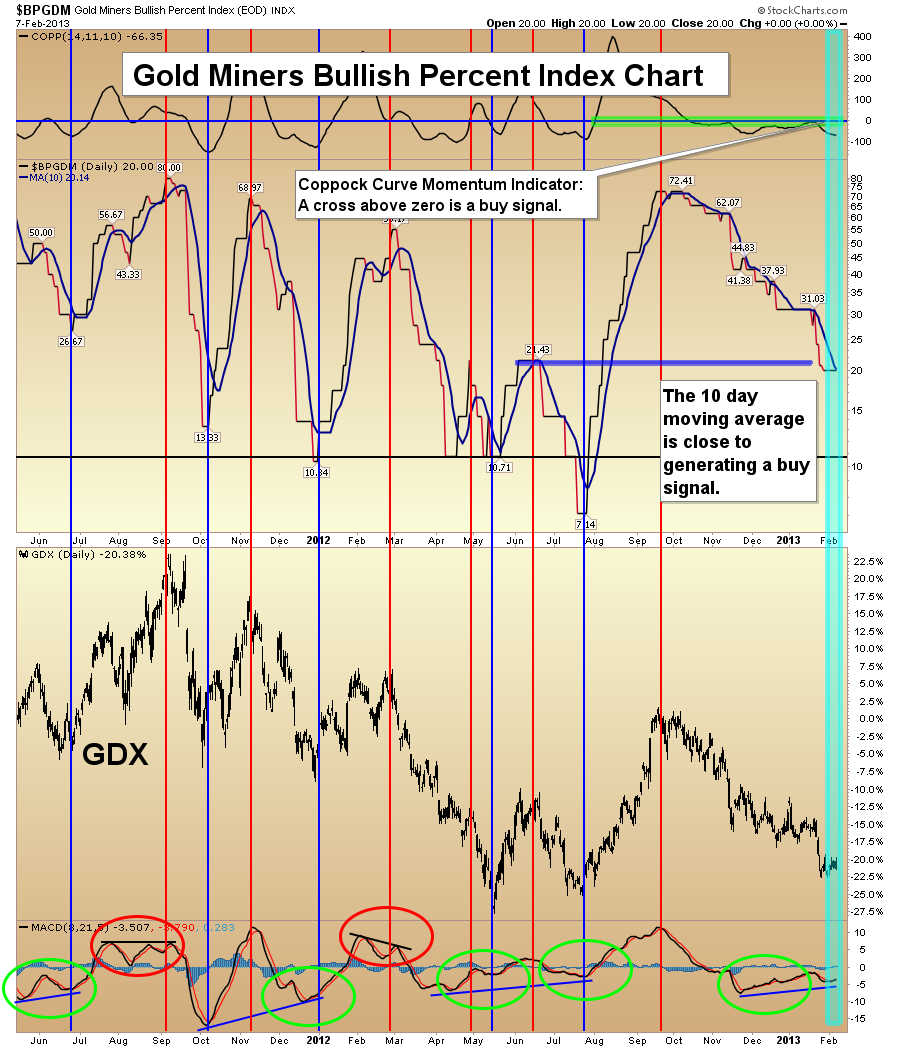
Gold Miners Bullish Percent Index Chart - The BPGDM chart can be used to pinpoint not just a blip, but a real trend change. I want to see the index cross over the 10 day moving average. Also, note the blue support line.
- Another key sign of a bullish turn is positive divergences seen on this chart. The green circles on the MACD Indicator point to other times when the same phenomenon occurred.
- The action of the Coppock momentum indicator is also interesting. A move above the zero line should provide confirmation that gold stocks are beginning a sustained rise higher.
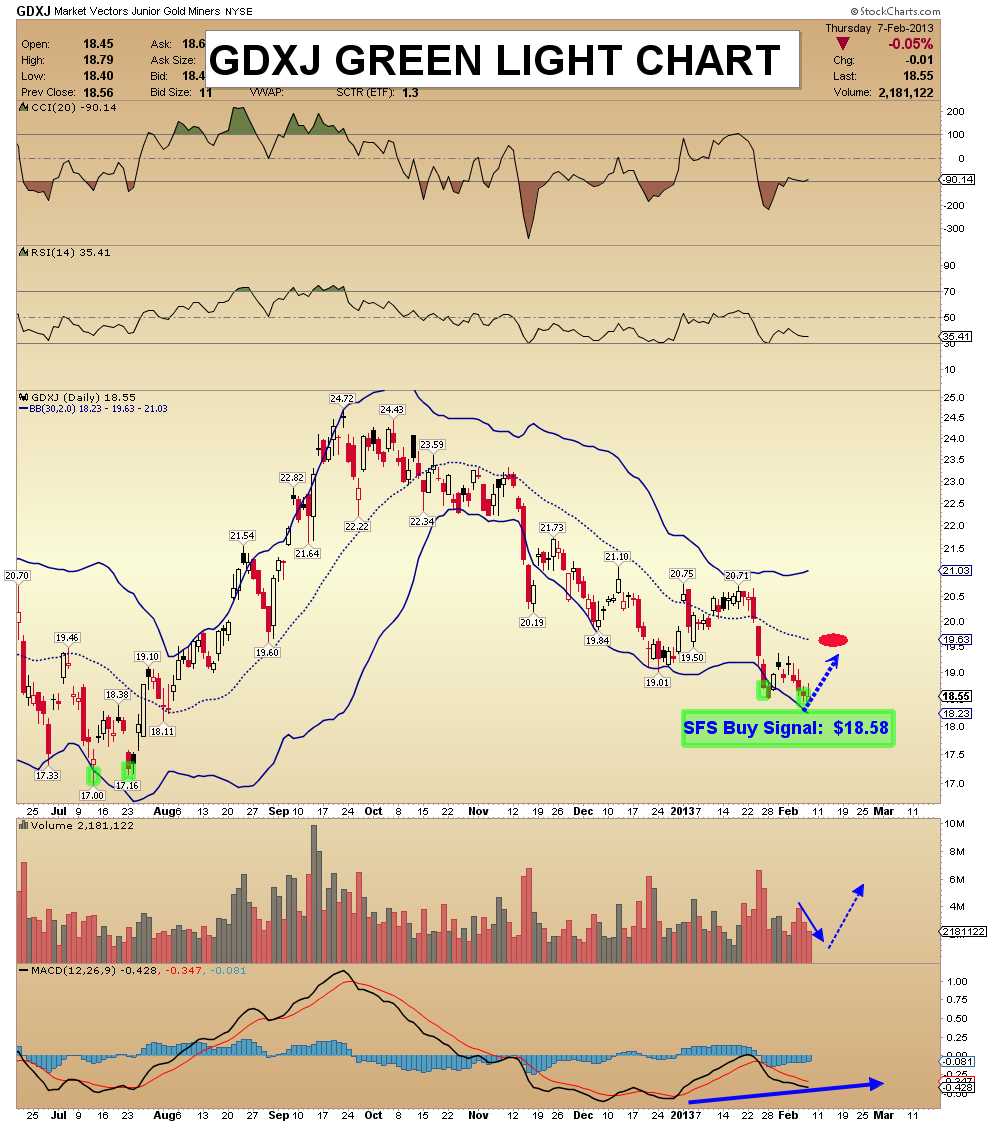
GDXJ Green Light Chart - A week ago, I stated that a buy signal for GDXJ was “near, but note quite here”, due to volume concerns. It’s here now. This week, GDXJ dipped lower. Volume dropped, which is a bullish signpost for junior gold stock investors.
- There was no violation of the Bollinger band, so I issued the buy signal, at $18.58.
- The immediate target zone is the dotted Bollinger band.
- Remember that this buy signal is not an attempt to call the exact price of the GDXJ low, but a place to enter the market on the long side, with professional money management tools in place.
- The market should rally from these levels, but that’s not a guarantee. Use a 10% stoploss on all my signals, or invest very small amounts of money each time, as I do. If you do that, I think you’ll find the GDXJ traffic light just turned green!
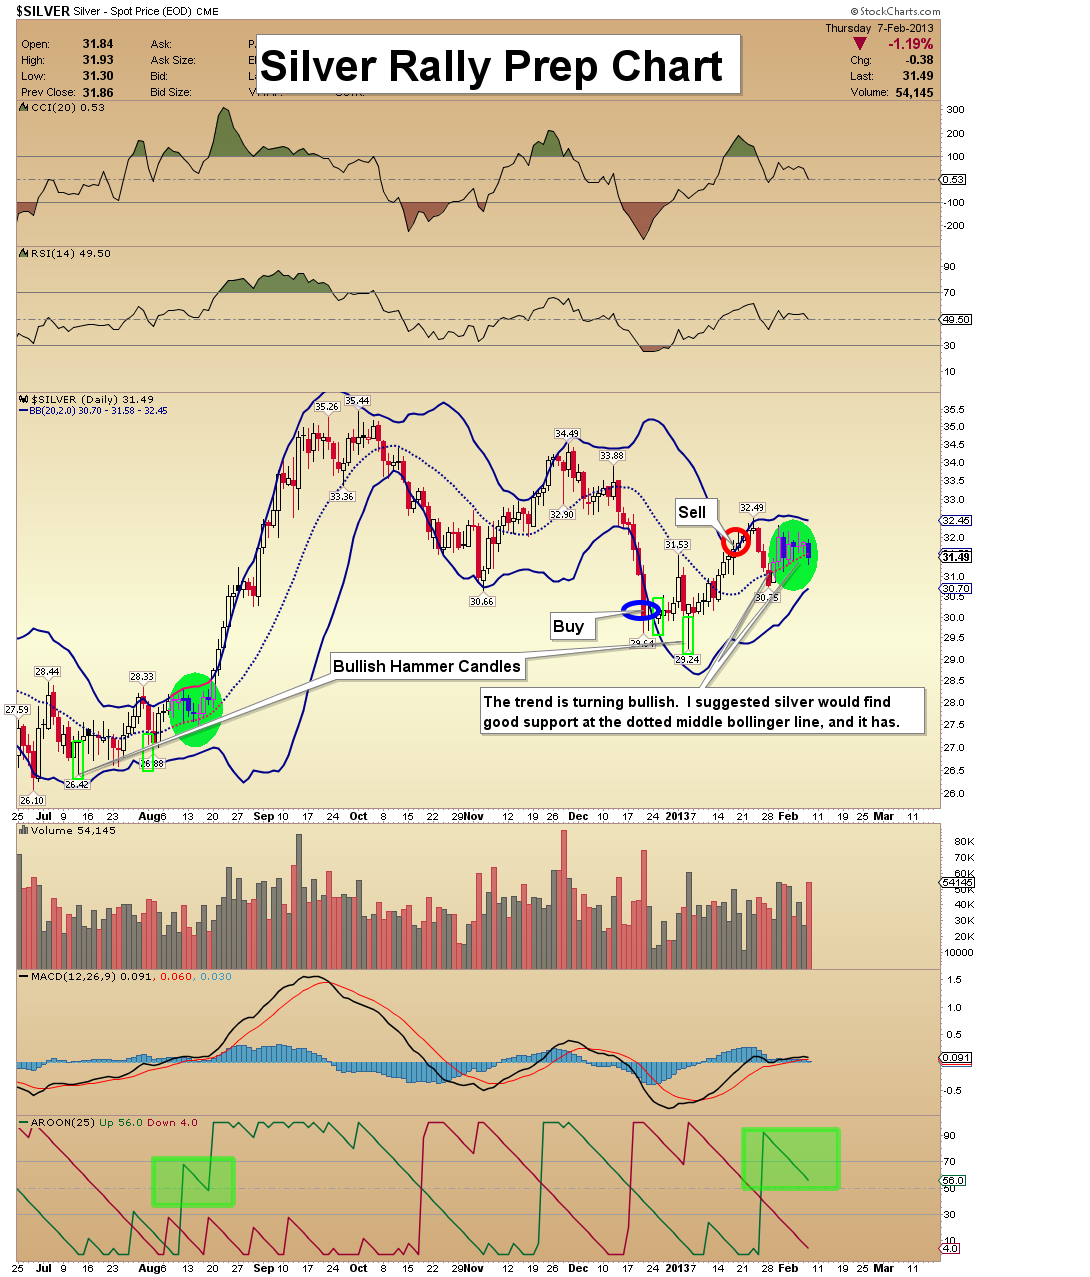
Silver Rally Prep Chart - Silver is setting itself up for a nice rally. The set-up is very similar to last fall. At the bottom of the chart, note the bullish breakout of the Aroon indicator.
- Silver is my favorite asset in the precious metals group, for adding fresh risk capital. The Bollinger bands are tightening, and that is usually followed by an explosive move.
- Note the trading position sell signal on the chart. Even though silver looks fantastic here, partial profits need to be taken regularly, like pruning a stately garden tree!
Friday, Jun 26, 2026 Super Force Signals Unique Introduction For 321Gold Readers:
Send me an email to admin@supergoldsignals.com and I’ll send you my free “Inflation Thunder Now!” gold and silver stocks video report. I’ll also include 3 of my next Super Force Surge Signals free of charge, as I send them to paid subscribers. Thank you!
|
Stay alert for our Super Gold alerts, sent by email to subscribers,
for both the daily charts on Super Force Signals at www.supergoldsignals.com and for the 60 minute
charts at www.supergoldsignals.com
About Super
Gold Signals:
Our Surge Gold Signals are created thru our proprietary blend
of the highest quality technical analysis and many years of successful
business building. We are two business owners with excellent synergy.
We understand risk and reward. Our subscribers are generally successfully
business owners, people like yourself with speculative funds,
looking for serious management of your risk and reward in the
market.
Frank Johnson:
Executive Editor, Macro Risk Manager.
Morris Hubbartt: Chief Market Analyst, Trading Risk Specialist.
website: www.supergoldsignals.com
email:
admin@supergoldsignals.com
email: admin@supergold60.com
Mail:
1276 Lakeview Drive
Oakville, Ontario, L6H 2M8
Canada
### Feb 8, 2013
Morris Hubbartt
321gold Ltd
 |
