Super Force Signals - A Leading
Market Timing Service
We Take Every Trade Ourselves
Gold Profits In The Correction
Morris Hubbartt
Weekly Market Update Excerpt
posted Feb 4, 2011
Gold and Precious Metals
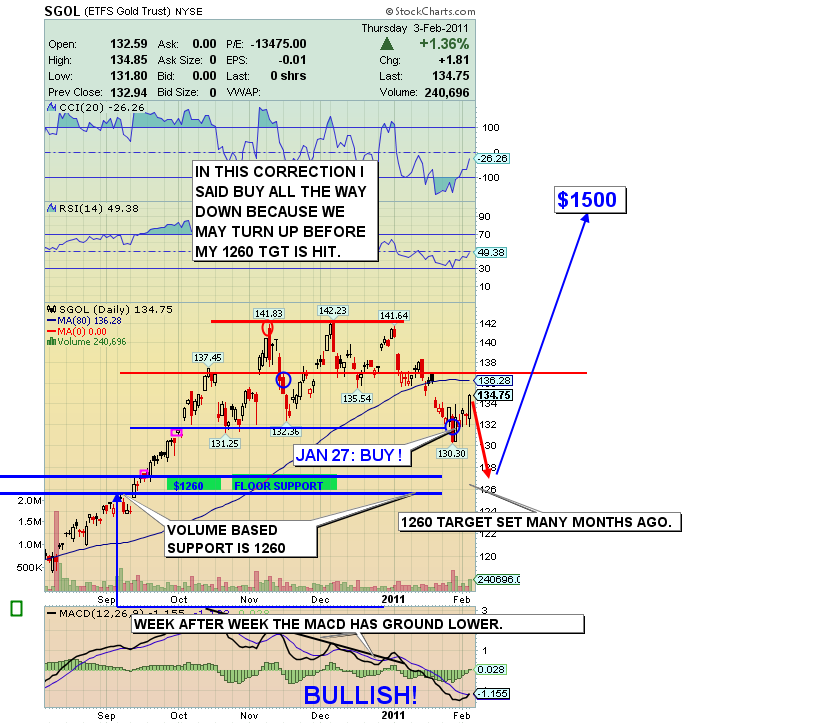
SGOL 6 Mth (Gold Bullion Proxy) Chart
-
I issued a Super Force buy signal for SGOL on Jan 27. Yesterday’s action puts that trade in a huge profit position.
-
For the last few weeks you have lived through a classic Bull Market correction, and the correction has proceeded almost exactly as I have predicted. I want to talk a bit about the whole debt issue, which is why you are in Gold, and why this is only a correction. It is easy to forget all the fundamentals when the news is bearish and the price is falling.
-
You have seen the metals crowd go from wildly bullish to liquidation mode, and the drawing of bearish chart wedges by technicians has become almost “the thing to do”. In contrast, the COT report has been making it clear that the smartest money has been buying this weakness for several weeks from the panicking crowd. The good news is that this action is typical for a Bull Market.
-
In recent weeks many have stated that Gold is a bubble, but Gold has a lot more room on the upside than downside. The financial media discusses the “great news” of the Dow hitting 12,000, while we learn that Social Security will run a deficit this year of 45 billion dollars, and that’s just the beginning for this new member of our wonderful Government’s “debt portfolio”.
-
The deficit of 45 billion is way ahead of “schedule”, if you call preparing to go into debt a “schedule”. These new debts are just starting, caused in part by the retirement of the first few years of the Baby Boomers.
-
In other “exciting debt growth news”, Standard and Poors just downgraded Japan. The media hardly touched the story, because this is a serious situation, so they feel a need to play it down as minor while hoping it just goes away through growth.
-
The crisis is spreading, not ending. Japan is the second largest economy in the world. Along with the Japan debt news, you just saw the Davos World Economic Forum Annual Meeting 2011 calls for a fresh 100 trillion in more worldwide debt. They call it credit, but it is $100 trillion of more debt. That is a mind-numbing number. It will all come from money printing, and this is happening while you are told Gold is in a bubble, so you should sell all your Gold.
-
We are entering a phase of this crisis when enormous destructive forces are being turned loose on societies around the world. Food prices are exploding, sending poor societies into violent turmoil. This is one of the real “benefits” of uncontrolled spending caused by Quantitative Easing, and the situation just beginning.
-
Massive debt accumulation rather than debt reduction is what has been happening worldwide. When you throw gas on a person who is burning, you are either an idiot or a criminal. Our government has a well diversified portfolio of both these “assets”.
- Consider the actions of the largest debtor nation in the world, America, and in particular the new Obama economic policies. These actions are almost ground work by design, for an economic collapse in the future. The $1.5 trillion budget deficits make the wild spending of the Bush Administration look tiny. “Change you can believe in” is here. Mr. President, we believe it!
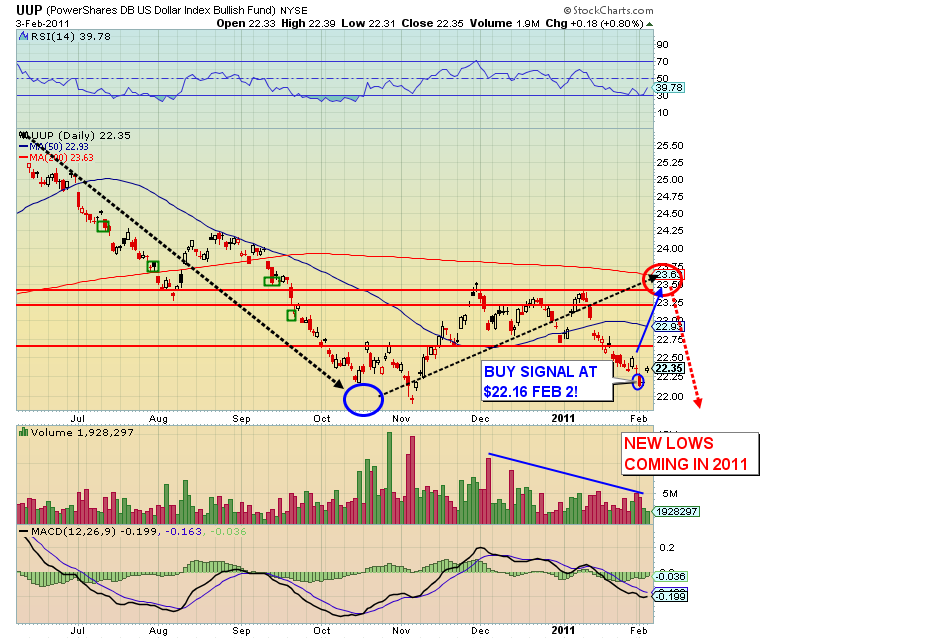
UUP (US Dollar Proxy) Chart
US Dollar Analysis:
-
The real currency is Gold. Leaving aside trading signals for a moment, in the big picture the dollar continues to flounder. The US dollar is in a terrible bear market, so if you are going to trade this on the long side, be very nimble. Do not get greedy with a winning trade.
-
In normal times, the dollar can be purchased to counter gold because they trade inversely. I have issued a buy signal for the dollar right now, and readers know I take pretty much every trade signal myself, but I am not taking this one. There is more to the market than just technical signals. The horrible debt situation means the focus must be Gold, not trading the dollar on the long side. The additions of new levels of debt bring new risks to long dollar trades that I am not comfortable bearing.
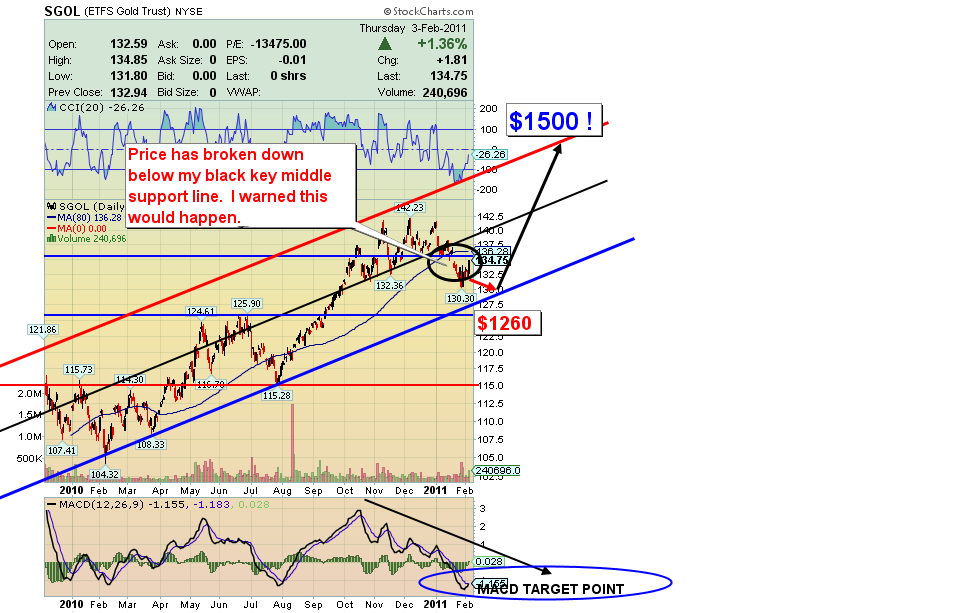
SGOL 14 Month Chart
-
A look at the 14 month chart above shows the progress being made towards my 1260 target. The MACD is very close to giving a buy signal. Don’t just buy my target, but instead buy all the way to my target, because sentiment figures are continuing to improve in this severely oversold market. The bottom could be put in at any time. At the same time, don’t chase yesterday’s price move up. I believe we have another down leg yet to come.
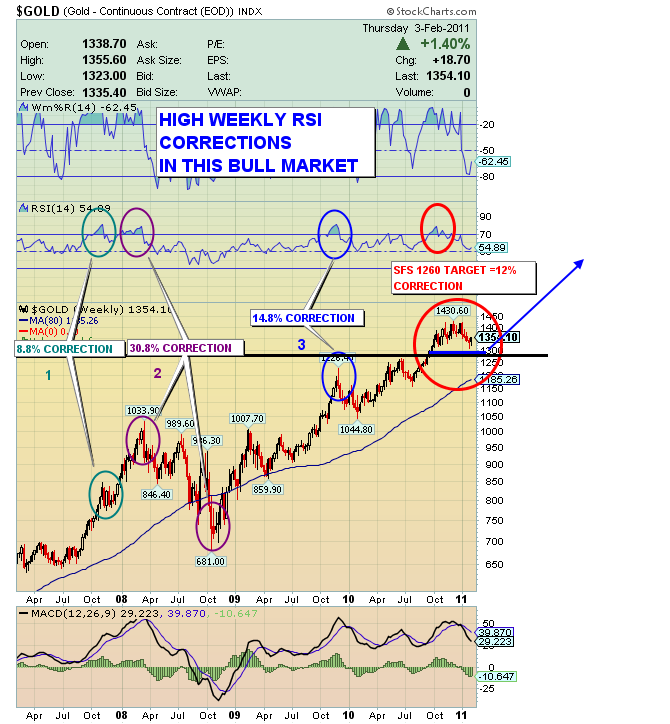
GOLD Weekly RSI Chart
-
Another look at the Gold chart, through my weekly “High RSI Chart”. Price is drawing closer to my $1260 price target, and nothing seems out of the ordinary, either on the move down towards that price, nor on the rallies upwards, within the correction.
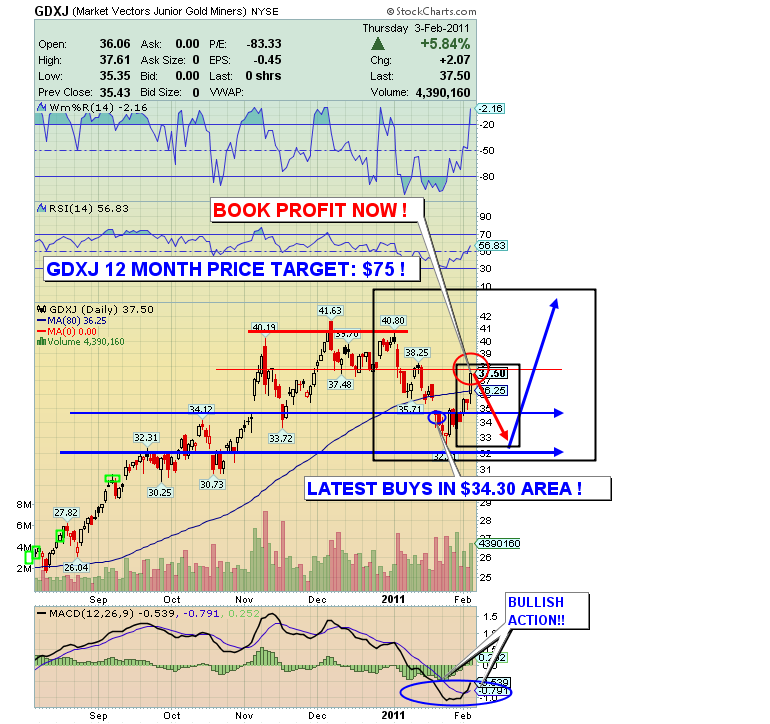
Gold Juniors GDXJ Chart
Gold Juniors Analysis:
-
The volume action in the last week alerted me that a move up to the $38 short term target was very realistic. I ignored the small bear wedge formation. Volume rules everything in the world of technical analysis. From this area around $38, I am expecting a move to test the lows in the $32 area, with the likely time target of March.
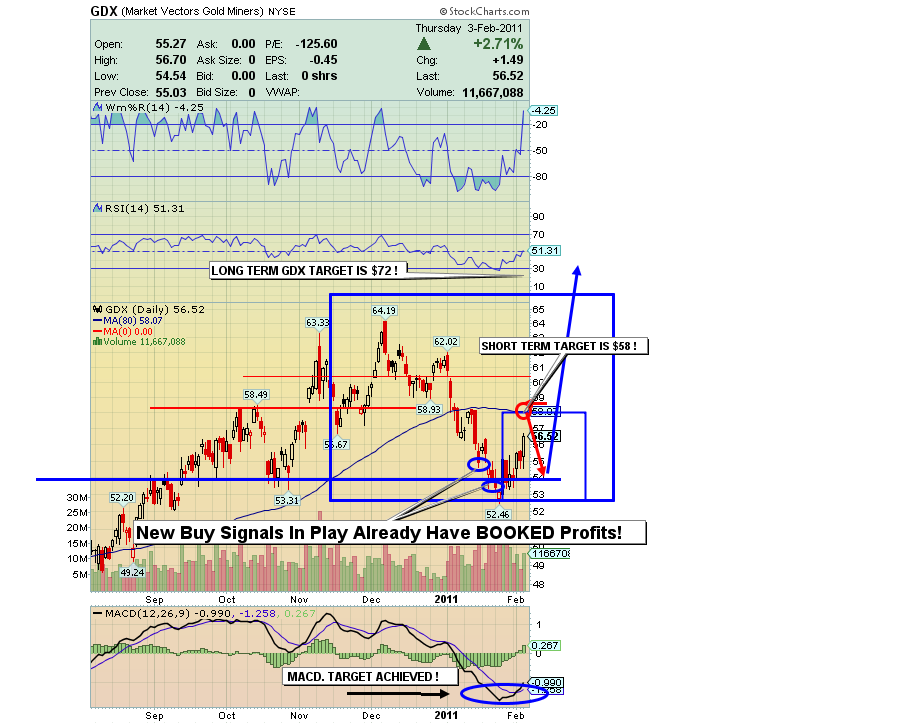
GDX 6 Month Chart
-
I issued a buy signal for GDX on Jan 20.
-
RSI made key progress when it hit the 30 level. MACD also is now showing a buy signal after its long descent from the top. Volume patterns continue to point to the $58.50 area.
-
The greatest bargains available are the Gold Senior Stocks, and not surprisingly, they are not even being looked by most investors. I am on record advocating a switch buy of GDX and senior Golds, and a sell of general US stock market equities.
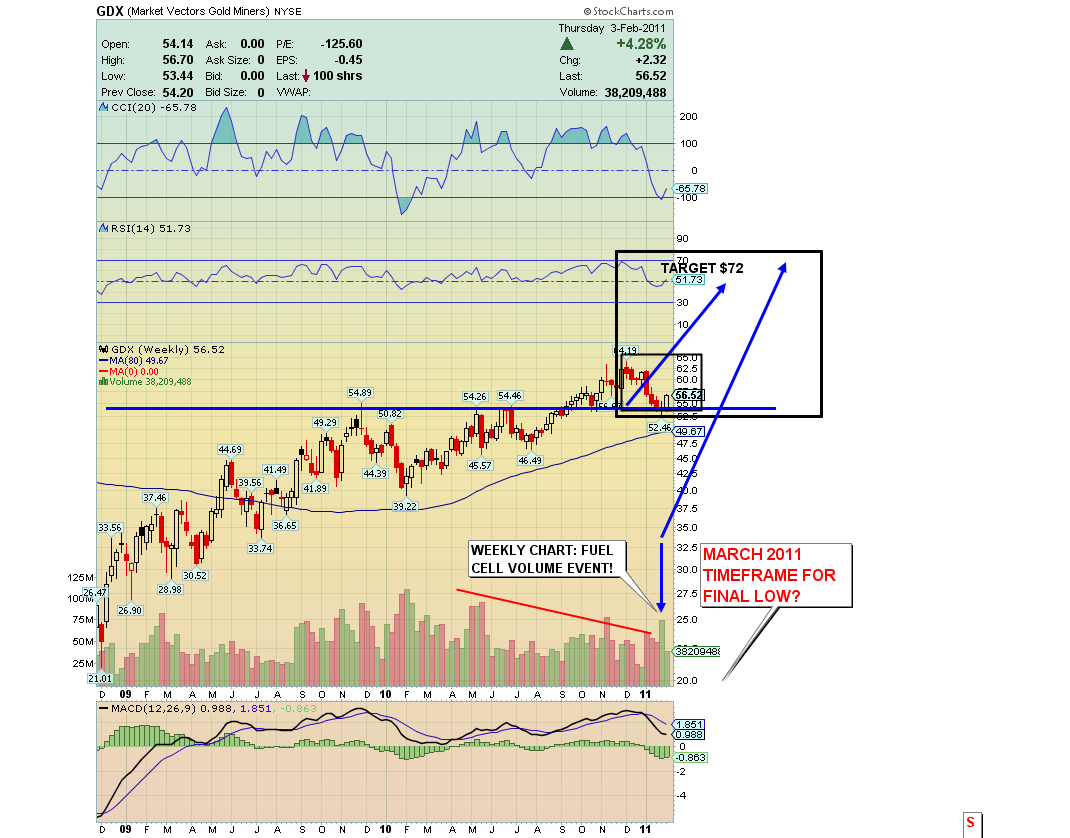
GDX Weekly Major Support Chart
-
This chart shows major support at the $54.00 area. It also shows a “SFS weekly Fuel Cell Indicator”. The fuel cell indicator is volume analysis I use to predict price moves of great power. This one should move price solidly higher in the weeks ahead. Even without the fuel cell buy signal, GDX is a great value play.
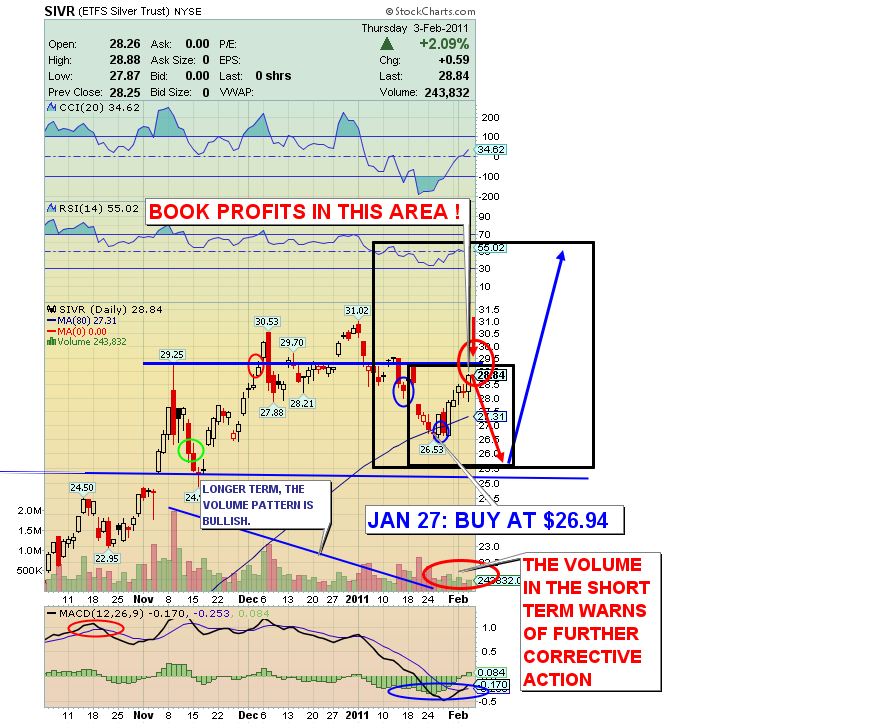
SIVR (Silver Proxy) 6 Mth Chart
Friday, Jul 3, 2026 Super Force Signals Unique Introduction For 321Gold Readers:
Send me an email to admin@supergoldsignals.com and I’ll send you my free “Inflation Thunder Now!” gold and silver stocks video report. I’ll also include 3 of my next Super Force Surge Signals free of charge, as I send them to paid subscribers. Thank you!
|
Stay alert for our Super Gold alerts, sent by email to subscribers,
for both the daily charts on Super Force Signals at www.supergoldsignals.com and for the 60 minute
charts at www.supergoldsignals.com
About Super
Gold Signals:
Our Surge Gold Signals are created thru our proprietary blend
of the highest quality technical analysis and many years of successful
business building. We are two business owners with excellent synergy.
We understand risk and reward. Our subscribers are generally successfully
business owners, people like yourself with speculative funds,
looking for serious management of your risk and reward in the
market.
Frank Johnson:
Executive Editor, Macro Risk Manager.
Morris Hubbartt: Chief Market Analyst, Trading Risk Specialist.
website: www.supergoldsignals.com
email:
admin@supergoldsignals.com
email: admin@supergold60.com
Mail:
1276 Lakeview Drive
Oakville, Ontario, L6H 2M8
Canada
###
Feb 4, 2011
Morris Hubbartt
321gold
Ltd
 |
