Super Force Signals - A Leading
Market Timing Service
We Take Every Trade Ourselves
The Pack Leader: Gold Juniors!
Morris Hubbartt
Weekly Market Update Excerpt
posted Feb 3, 2012
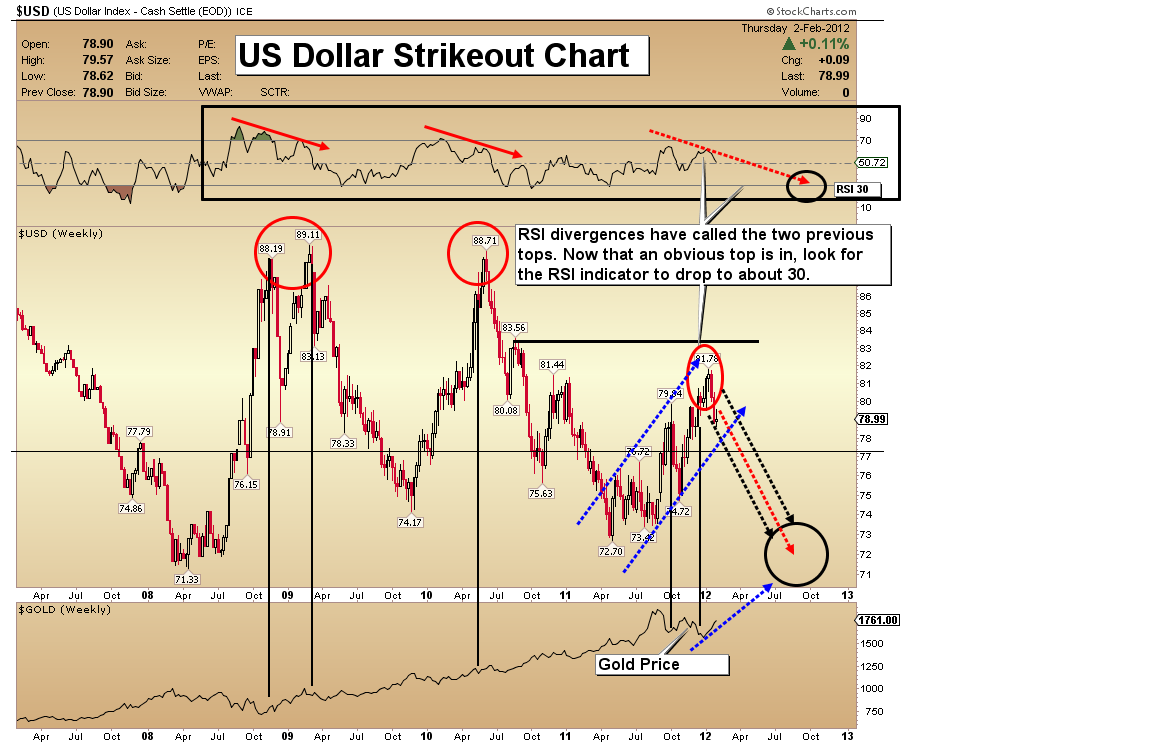
US Dollar Strikeout Chart
- I use this key chart to identify tops in the US dollar, and I think another top is forming now. Note the first two declines on this chart.
- The rally that began in the spring of 2011 at 72.70 only went as far as 81.78, despite the virtual implosion of Europe.
- Note the “RSI box” at the top of the chart. Each US dollar top has been accompanied by not only a weakening RSI, but the overall level of the RSI indicator has consistently weakened since the 2008 high.
- The dollar has had three swings with the price rally bat, each worse than the previous swing, and has now struck out. The Fed is talking about low interest rates for sustained periods of time, and that is anything but dollar-positive.
- The key highs for the dollar rallies have been 92.33, 89.11, and 88.71, in that order. Now it looks like you can add 81.78 to the list.
- The Fed has a “lend and spend” plan in play now, designed to keep money flowing at a high velocity. Bond buying keeps interest rates artificially low, theoretically forcing money out of savings and into the economy.
- The costs of everyday life continue to rise, while the average bank savings account pays you about 1%. The actions of our central bank could wipe out the savings of the entire middle class.
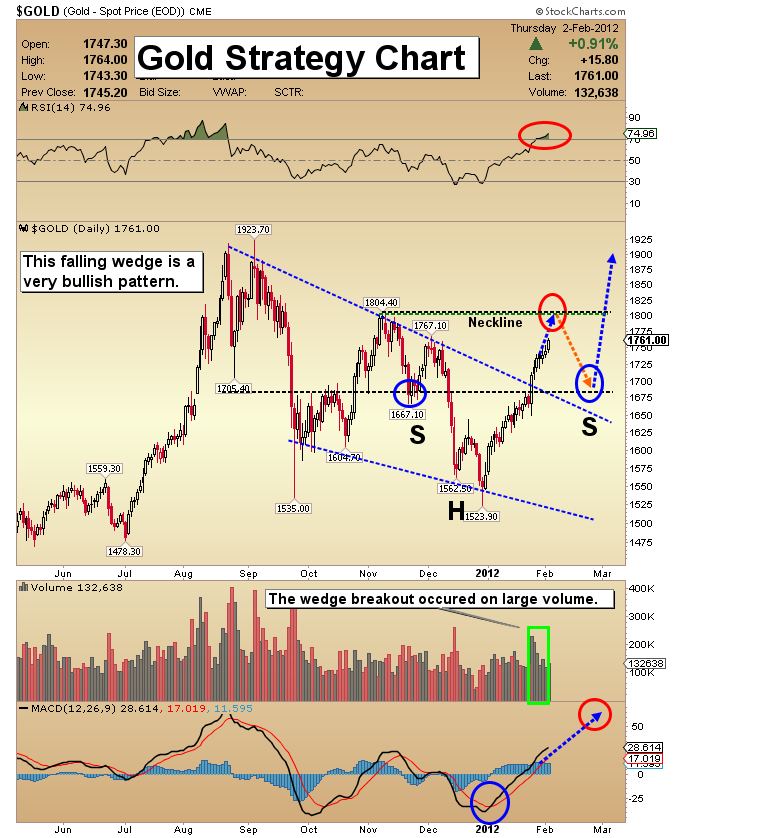
Gold Strategy Chart
- Technically, the gold price action this week is just what the doctor ordered. It started with a light volume pull back that I projected would follow the breakout from the falling wedge price pattern.
- I have set $1803 as the upside target of the first stage of this move. From that price area, I see a bigger pull back, again on light volume.
- From $1803, I’m projecting that gold will drop to about $1680, complete an inverse head and shoulders pattern, and then rise to $2100. June is the most likely timeframe that sees gold touch $2100. $2300 is likely by December, 2012.
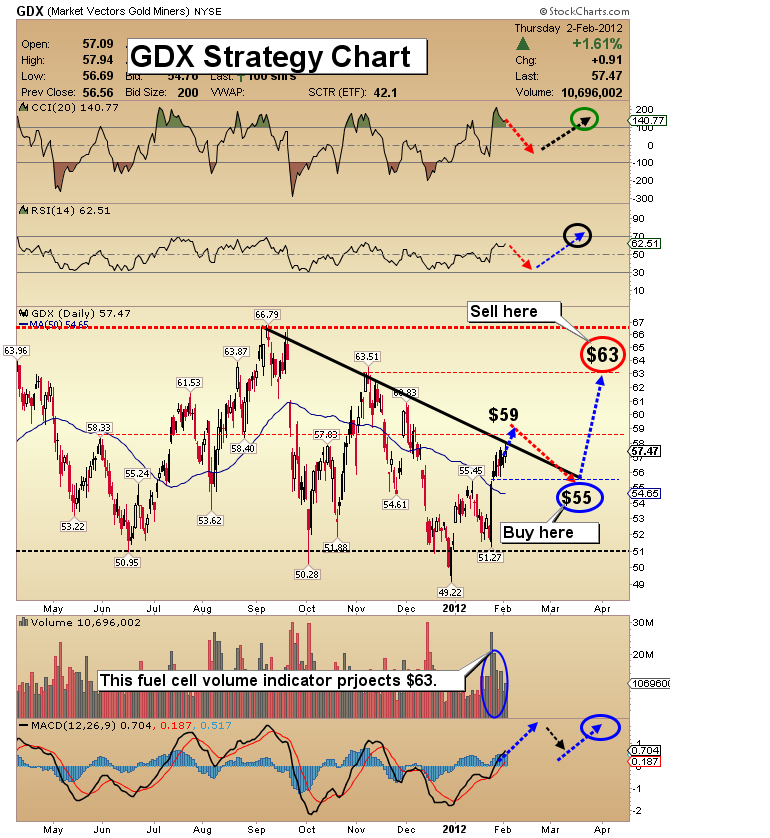
GDX Strategy Chart
- My trading model targets a price rise to $63 for GDX, and it should be coming over the next couple of weeks. My volume and trend analysis indicates that the current move is only about 50% complete. My shorter term target is $59, and from $59 I expect a brief pullback to $55. From there, a run to $63 looks highly likely.
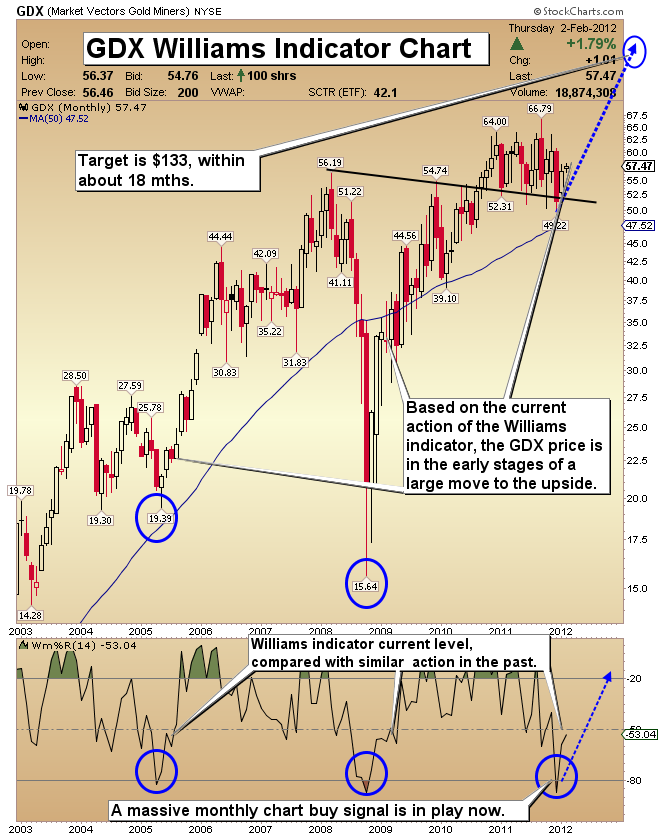
GDX Williams Indicator Chart
- The monthly Williams indicator chart is extremely compelling. I have identified a number of “we are here” potential overlap situations. Note how far the GDX price rallied from when the Williams indicator was in a similar situation to what you see now.
- The 40-50 range on the Williams indicator tends to be the zone from where enormous price rallies are launched.
- I see $133 as a likely target for GDX within 12-18 months. Once gold stocks get hot they tend to move dramatically. The key is to hold a large core position of gold stocks that you are not willing to sell for just tiny profits.
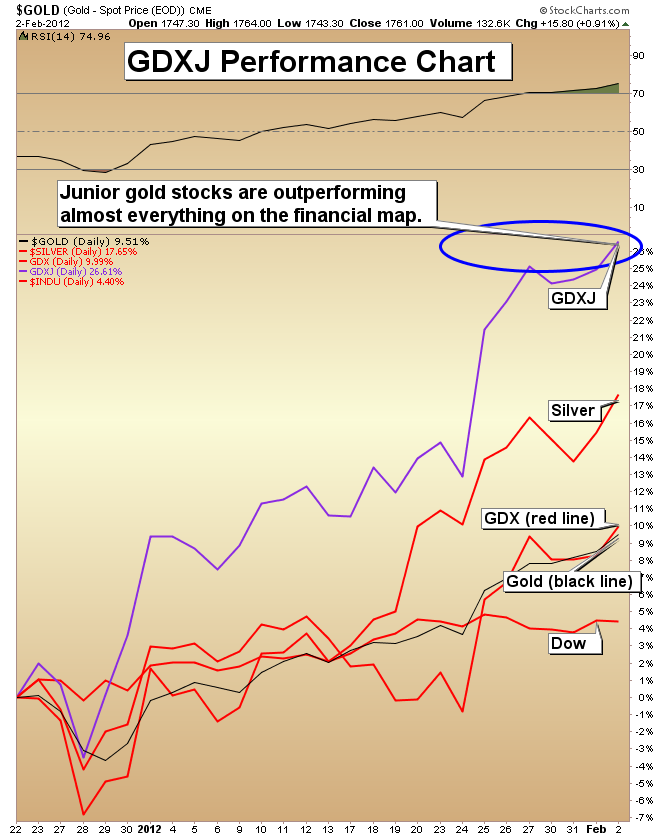
GDXJ Performance Chart
- This chart picture speaks a thousand words about your junior gold stocks. Gold juniors are now leading the pack, and doing so dramatically. Since GDXJ bottomed it has solidly outperformed its larger brethren GDX.
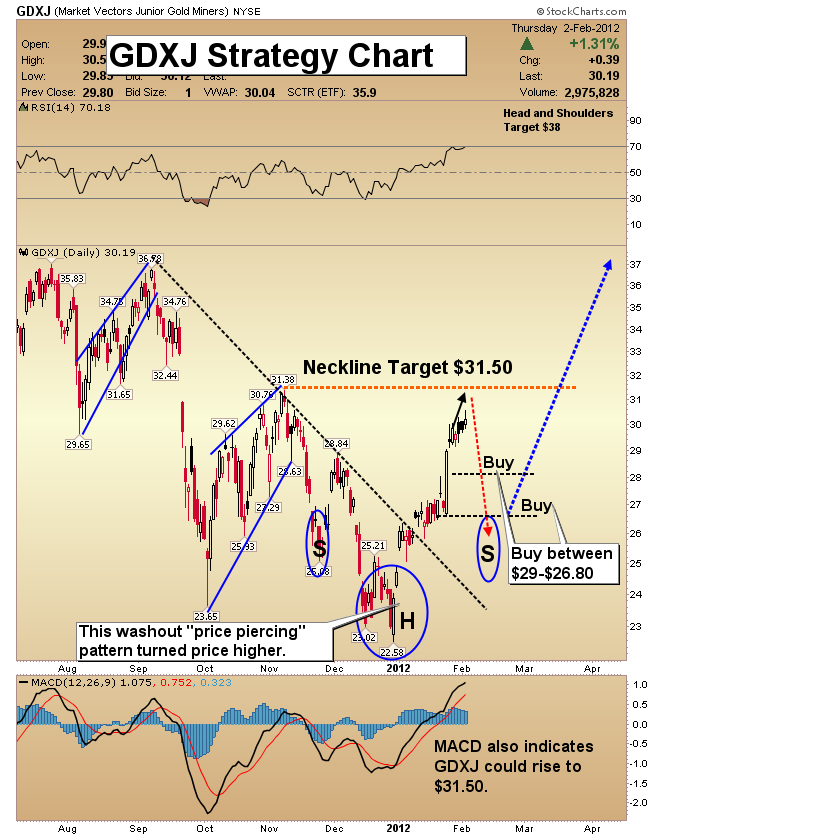
GDXJ Strategy Chart
- My trading model is targeting $31.50 as the high for this move. The market has been consolidating the recent gains with a sideways chop and an upside bias.
- Sentiment on the entire sector is still very negative and that is very bullish. Money should continue to flow into this market from the sidelines.
- It is likely that once the $31.50 target is acquired a quick pulldown should occur, taking GDXJ down to about 28.50, and perhaps as low as $26.80. I am recommending that junior gold investors be light sellers of GDXJ as the price rises towards $31.50, and strong buyers under $29.
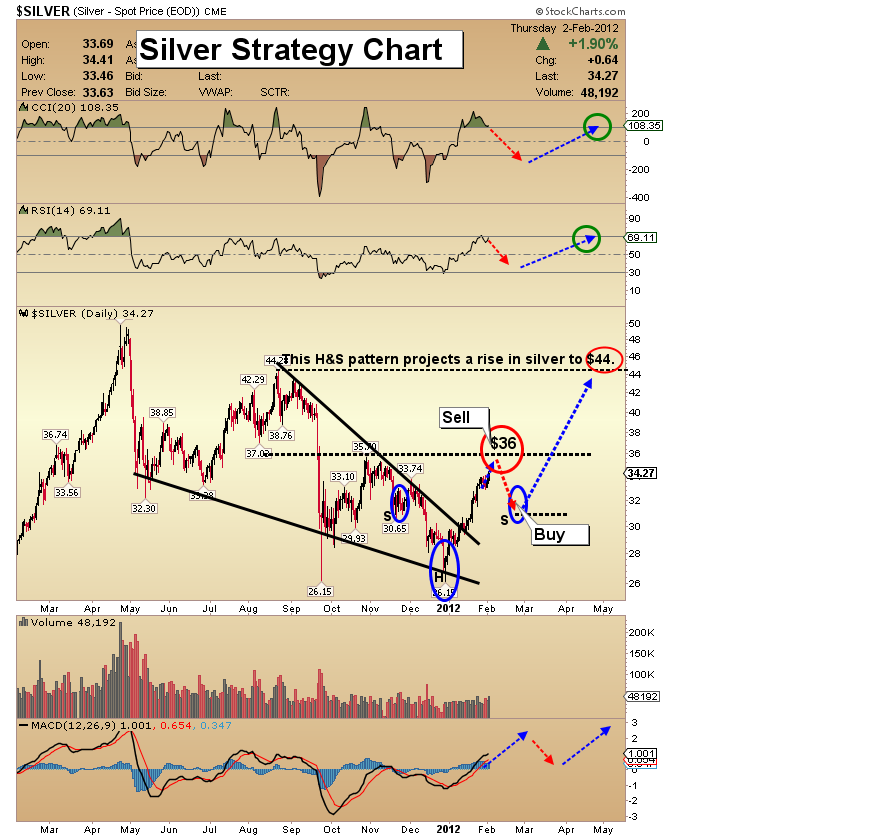
Silver Strategy Chart
- When silver was trading at its recent lows near $26 late last year, I suggested you engage in a series of timed accumulation buys. I bought physical silver in my own accounts, paying an average of under $30, with one very uncomfortable buy coming right into the low. Since then, this market is up substantially. In the larger picture silver has likely just started the move higher.
- My trading model is targeting $36 for this move, followed by a pullback to about $31. From there, I am projecting a strong move towards $44, with that target likely acquired by the end of the first quarter.
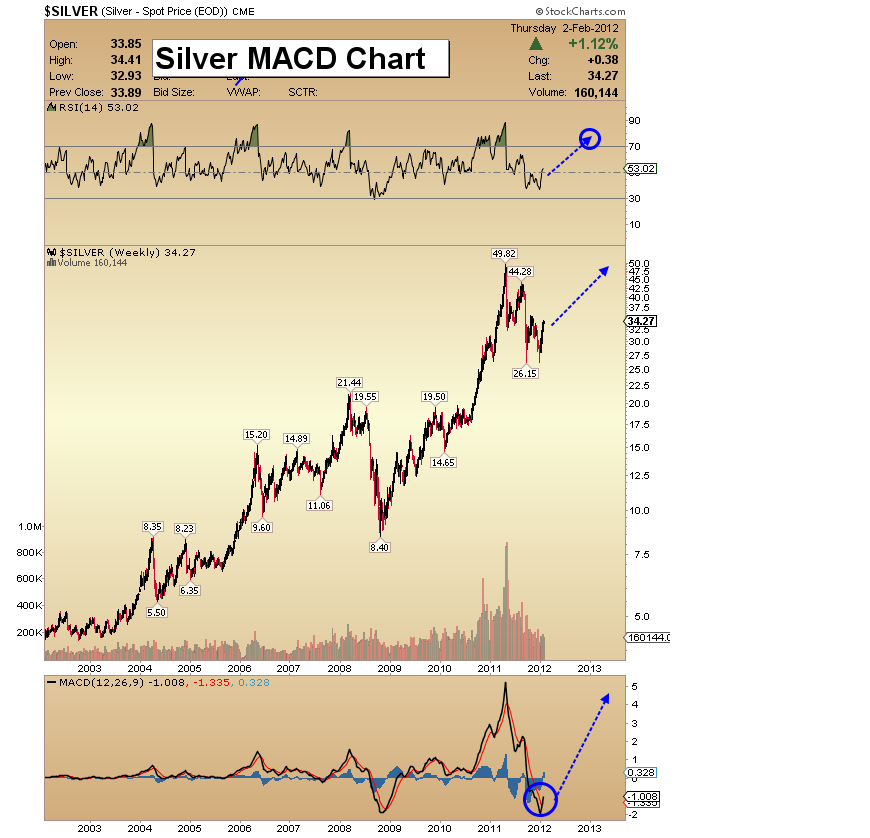
Silver MACD Chart
- Here I am highlighting a massive weekly chart buy signal for the MACD indicator. I was highlighting this indicator in late 2011 in the $27-$30 price range, as the indicator was close to a buy, but not quite there.
- I prefer you to buy silver when the price is lower. Anticipate a turn in the MACD, rather than waiting for it to happen. Still, this buy signal is impressive. In just one month, the price of silver is already up about 25%.
- This MACD buy signal indicates a move to $44 is easily possible, and that should bring some big smiles to silver investors!
Friday, Jul 3, 2026 Super Force Signals Unique Introduction For 321Gold Readers:
Send me an email to admin@supergoldsignals.com and I’ll send you my free “Inflation Thunder Now!” gold and silver stocks video report. I’ll also include 3 of my next Super Force Surge Signals free of charge, as I send them to paid subscribers. Thank you!
|
Stay alert for our Super Gold alerts, sent by email to subscribers,
for both the daily charts on Super Force Signals at www.supergoldsignals.com and for the 60 minute
charts at www.supergoldsignals.com
About Super
Gold Signals:
Our Surge Gold Signals are created thru our proprietary blend
of the highest quality technical analysis and many years of successful
business building. We are two business owners with excellent synergy.
We understand risk and reward. Our subscribers are generally successfully
business owners, people like yourself with speculative funds,
looking for serious management of your risk and reward in the
market.
Frank Johnson:
Executive Editor, Macro Risk Manager.
Morris Hubbartt: Chief Market Analyst, Trading Risk Specialist.
website: www.supergoldsignals.com
email:
admin@supergoldsignals.com
email: admin@supergold60.com
Mail:
1276 Lakeview Drive
Oakville, Ontario, L6H 2M8
Canada
###
Feb 3, 2012
Morris Hubbartt
321gold
Ltd

|
