Super Force Signals - A Leading Market Timing Service
We Take Every Trade Ourselves
Is Euro Spike Gold Rocket Fuel? Morris Hubbartt
Weekly Market Update Excerpt
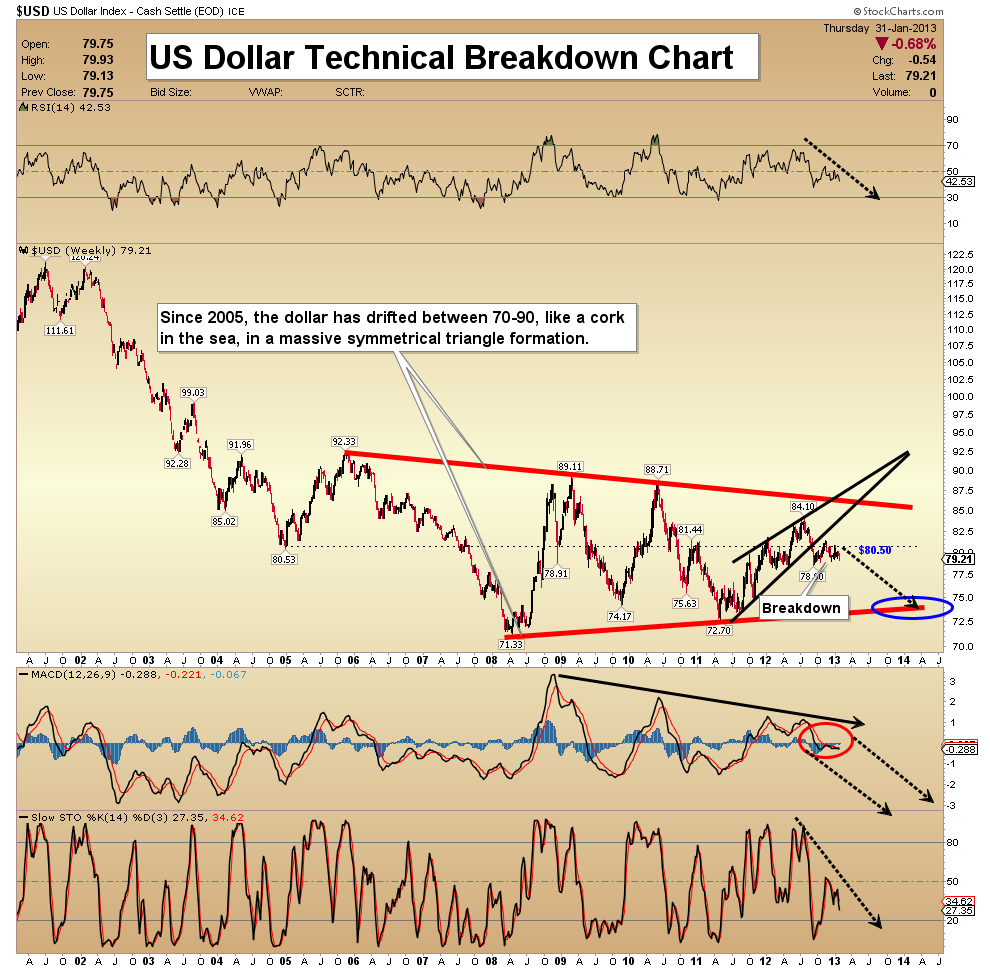
posted Feb 1, 2013 US Dollar Technical Breakdown Chart - US debt negations have been delayed again, by squabbling political parties. We are told that in May everything will be fixed, but the debt continues to grow, and so does pressure on the US dollar.
- The US dollar is vulnerable to a “loss of confidence” event. That could create a stunning decline, and a powerful move higher in the price of gold. A key level that I watch on the US dollar chart is the 80.50 area, which never seems to hold for very long.
- This chart has numerous head & shoulders top patterns on it, and it closed out the month of January below 80.50, which is a very ominous sign for dollar holders, and great news for gold!
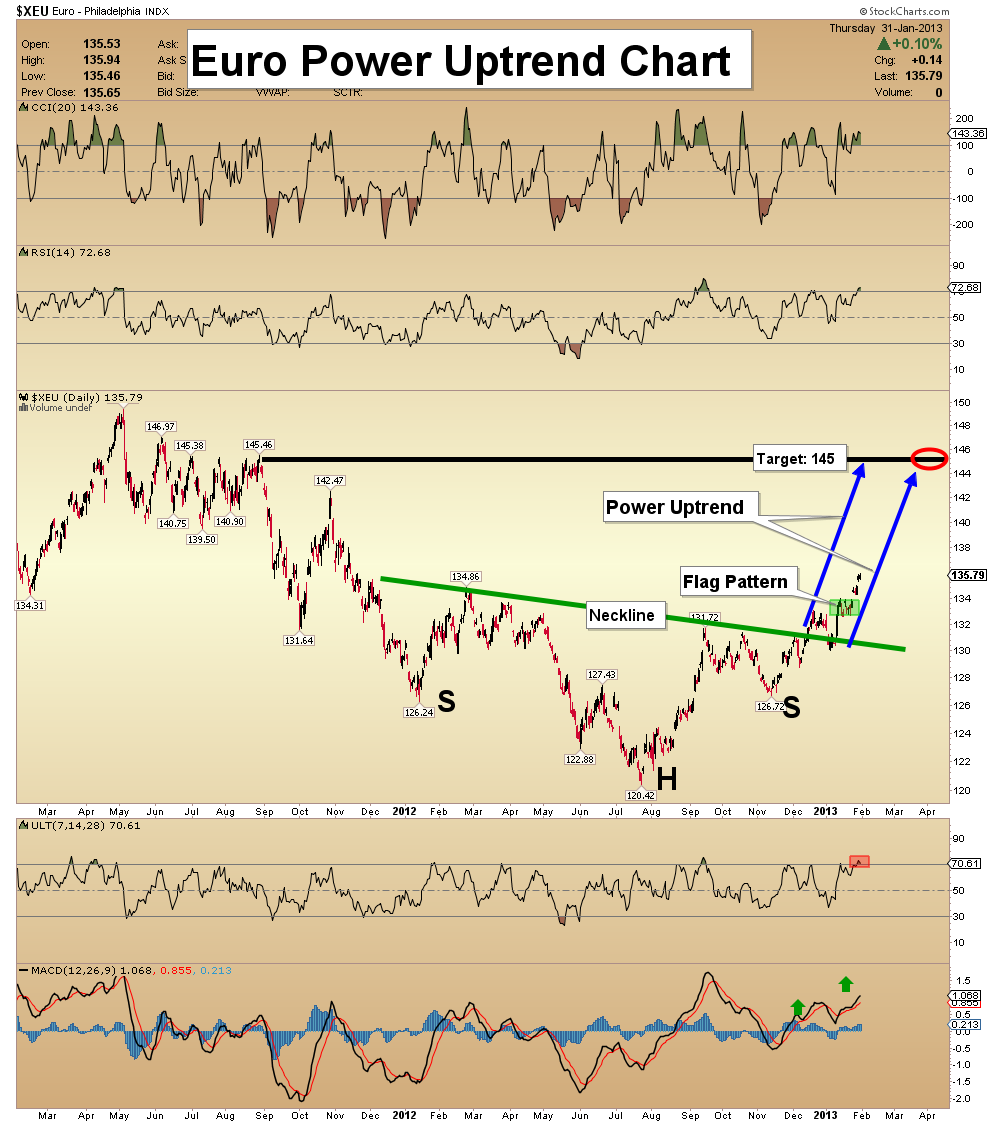
Euro Power Uptrend Chart - My target for the euro is the 142-145 price area. I predicted the euro would rise in a “power uptrend”, after it staged a breakout from the large inverse h&s bottom formation. That power uptrend is now in play.
- Note the nice flag pattern within the uptrend channel. While RSI is now a little overbought, all 2-3 day corrections should be bought by aggressive traders!
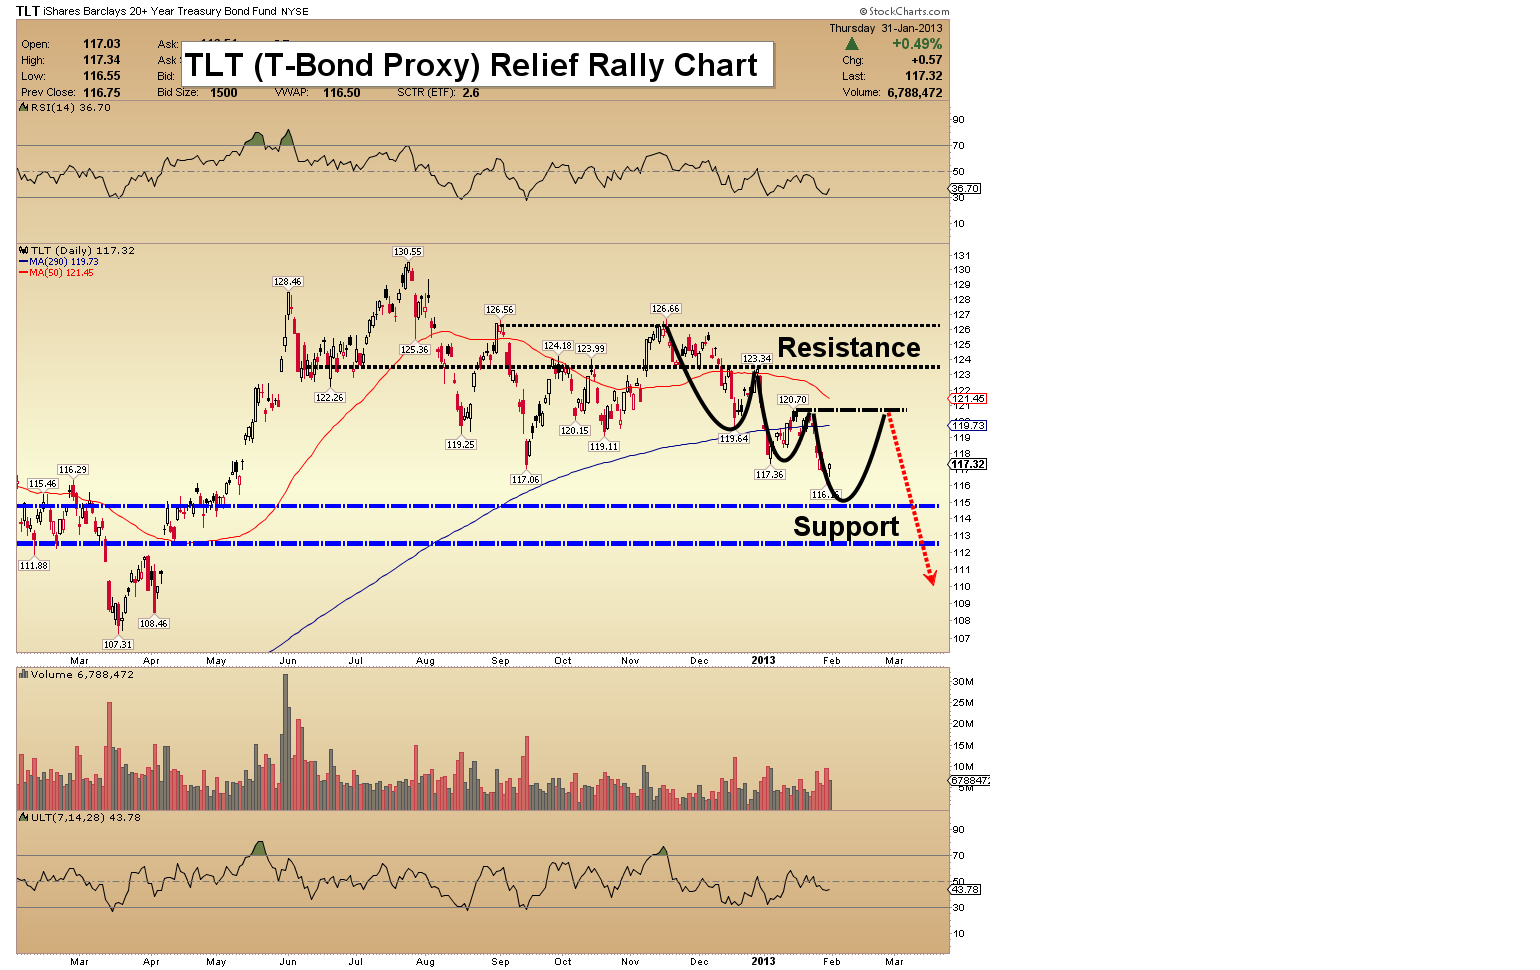
US TLT (T-Bond Proxy) Relief Rally Chart - Over the next several years, I see the bond going much lower, if not outright collapsing.
- That being said, a strong countertrend rally to the upside is quite likely now. Positive technical divergences are appearing. The ultimate oscillator is beginning to trend higher, and RSI refuses to confirm the recent lows in bond prices. I expect one more punch lower, and then a strong rally should begin.
- I will set a firmer upside target, once I see that a short term bottom is in place. If you shorted the bond, you can cover some positions now, and more on the next leg down.
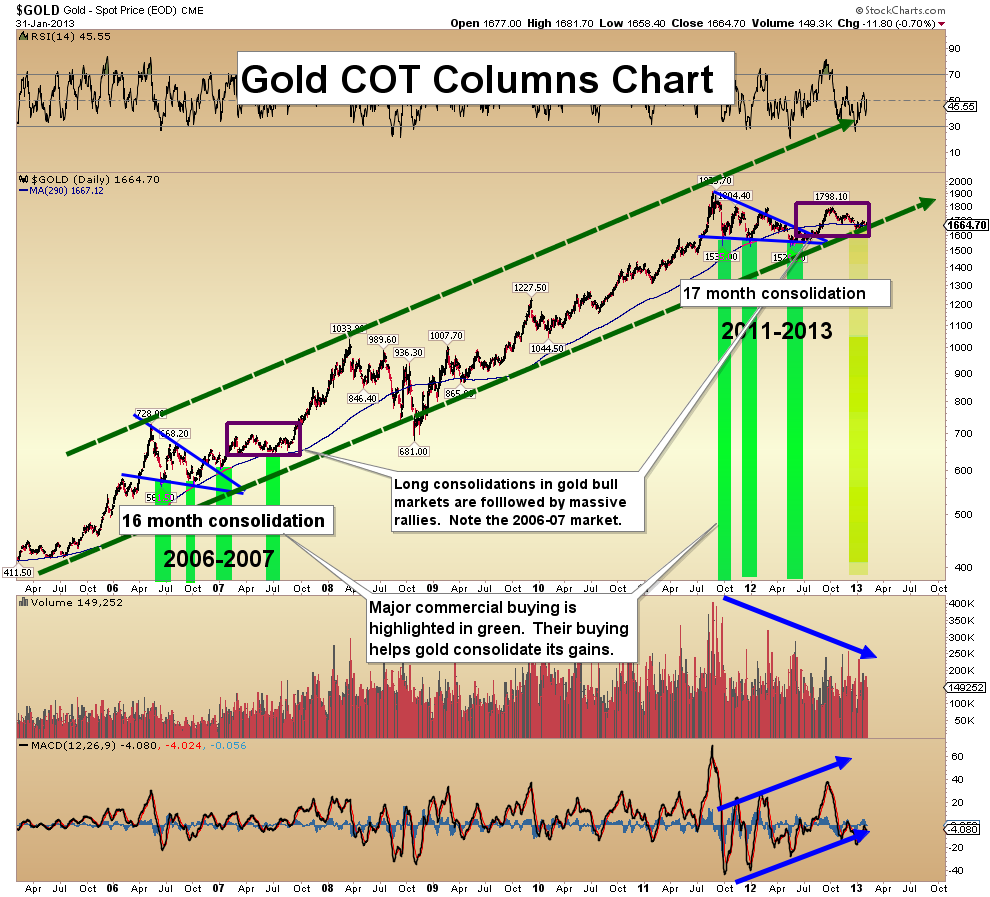
Gold COT Columns Chart - As this debt crisis continues to unfold, I expect more investors to transfer money from paper gold products to physical gold.
- I have started to color the last column on this chart with more green color, indicating that commercial buyers are slowly reducing their short positions, and increasing their longs. I will update subscribers as soon the next report is released on Friday afternoon, Feb 1, 2013.
- It’s a tedious process, but one worth waiting for.
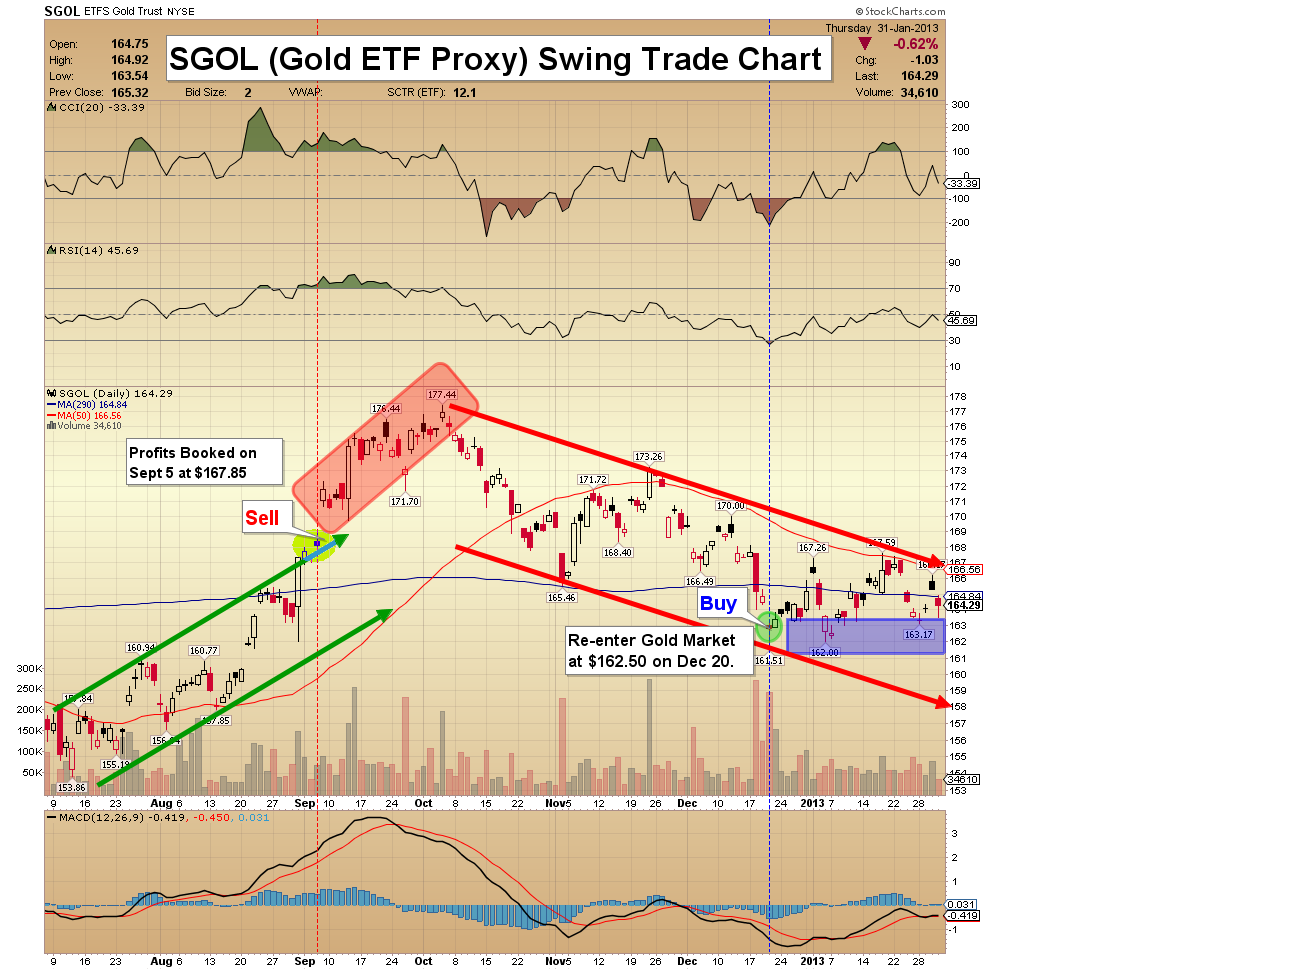
SGOL (Gold Proxy ETF) Swing Trade Chart - Note the red section on the chart. Some traders have been trying very hard, to call almost every tiny turn in the market, using excessive leverage. They are becoming frustrated that “the big move” hasn’t happened.
- I like the simple approach of selling modestly into a big rally, and then buying back, lightly, into the ensuing decline. I try hard to call the big market turns, but it’s much more important to make money than make spectacular market calls. If you would like to receive my free “Trading Basics” report, send me an email to trading@supeforcesignals.com, and I’ll send it to you. Thanks.
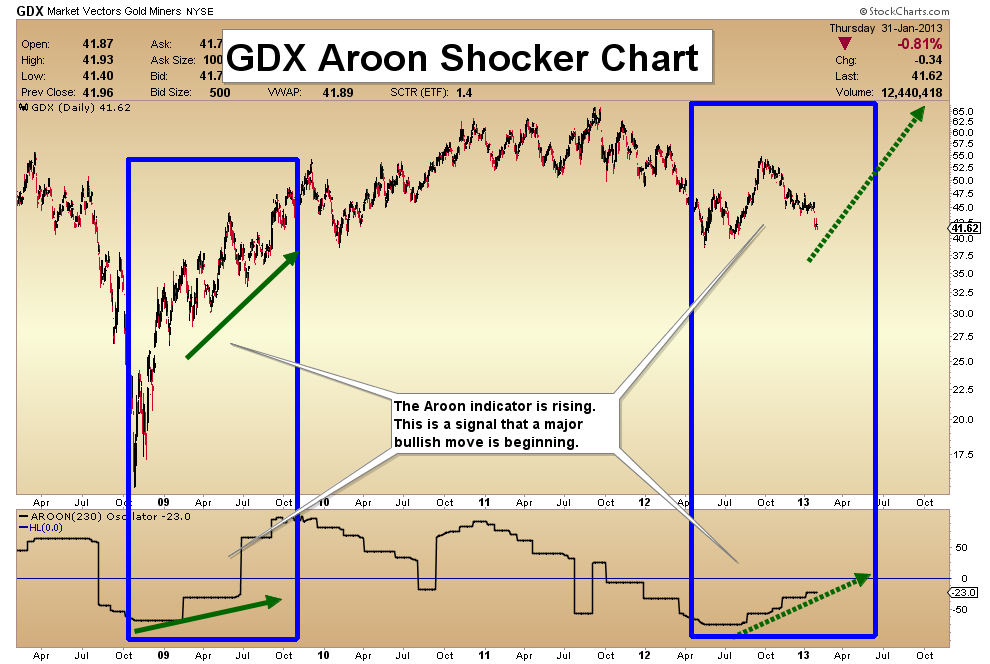
GDX Aroon Shocker Chart - Many analysts believe a huge head & shoulders top is in place on the GDX weekly chart, and much lower prices are coming. Anything is possible in the market, but bearish sentiment is more extreme now than it was at the 2008 lows, and the action of the Aroon indicator should encourage embattled bulls.
- The Aroon is an “ahead of the curve” tool. In Sanskrit, it means “early dawn”. As gold stocks have fallen by about 25% since the high last fall, the Aroon indicator has continued to climb higher. It tells me that the bears may be in store for quite a nasty surprise, very soon.
- Is the Aroon indicating that the spike in the euro will be followed by a gold price rocket, carrying gold stocks as passengers? I think it is!
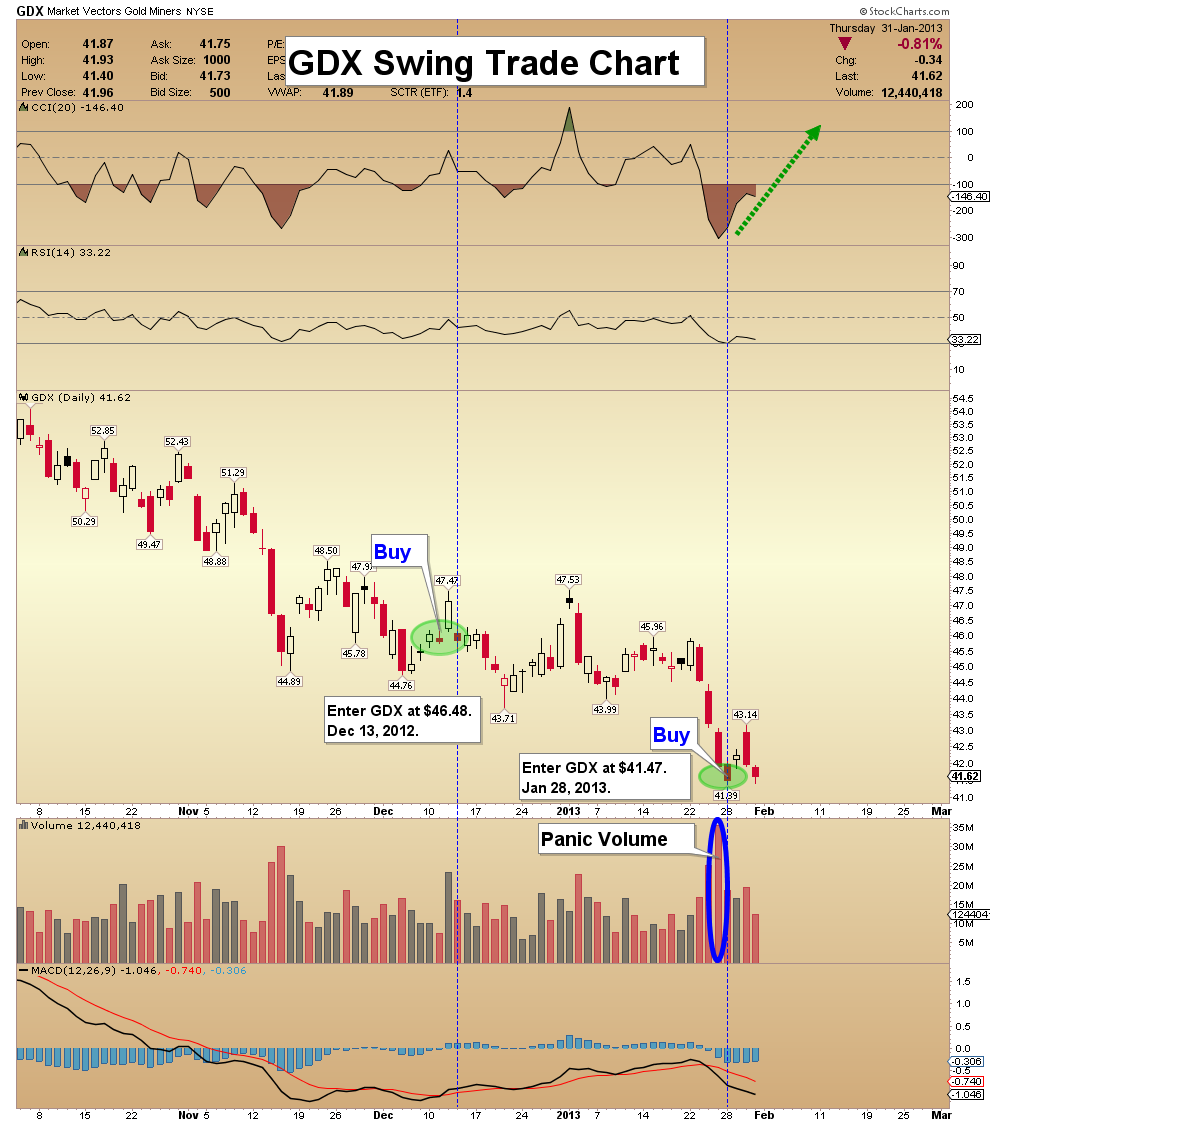
GDX Swing Trade Chart - Succeeding in the market is as “simple” as buying low and selling high. It’s not that easy to buy when buying must be done, but now is one of those times to take action with senior gold stocks.
- My latest buy signal came earlier this week, when GDX moved sharply lower, on very heavy panic volume. That one- two punch triggered the signal.
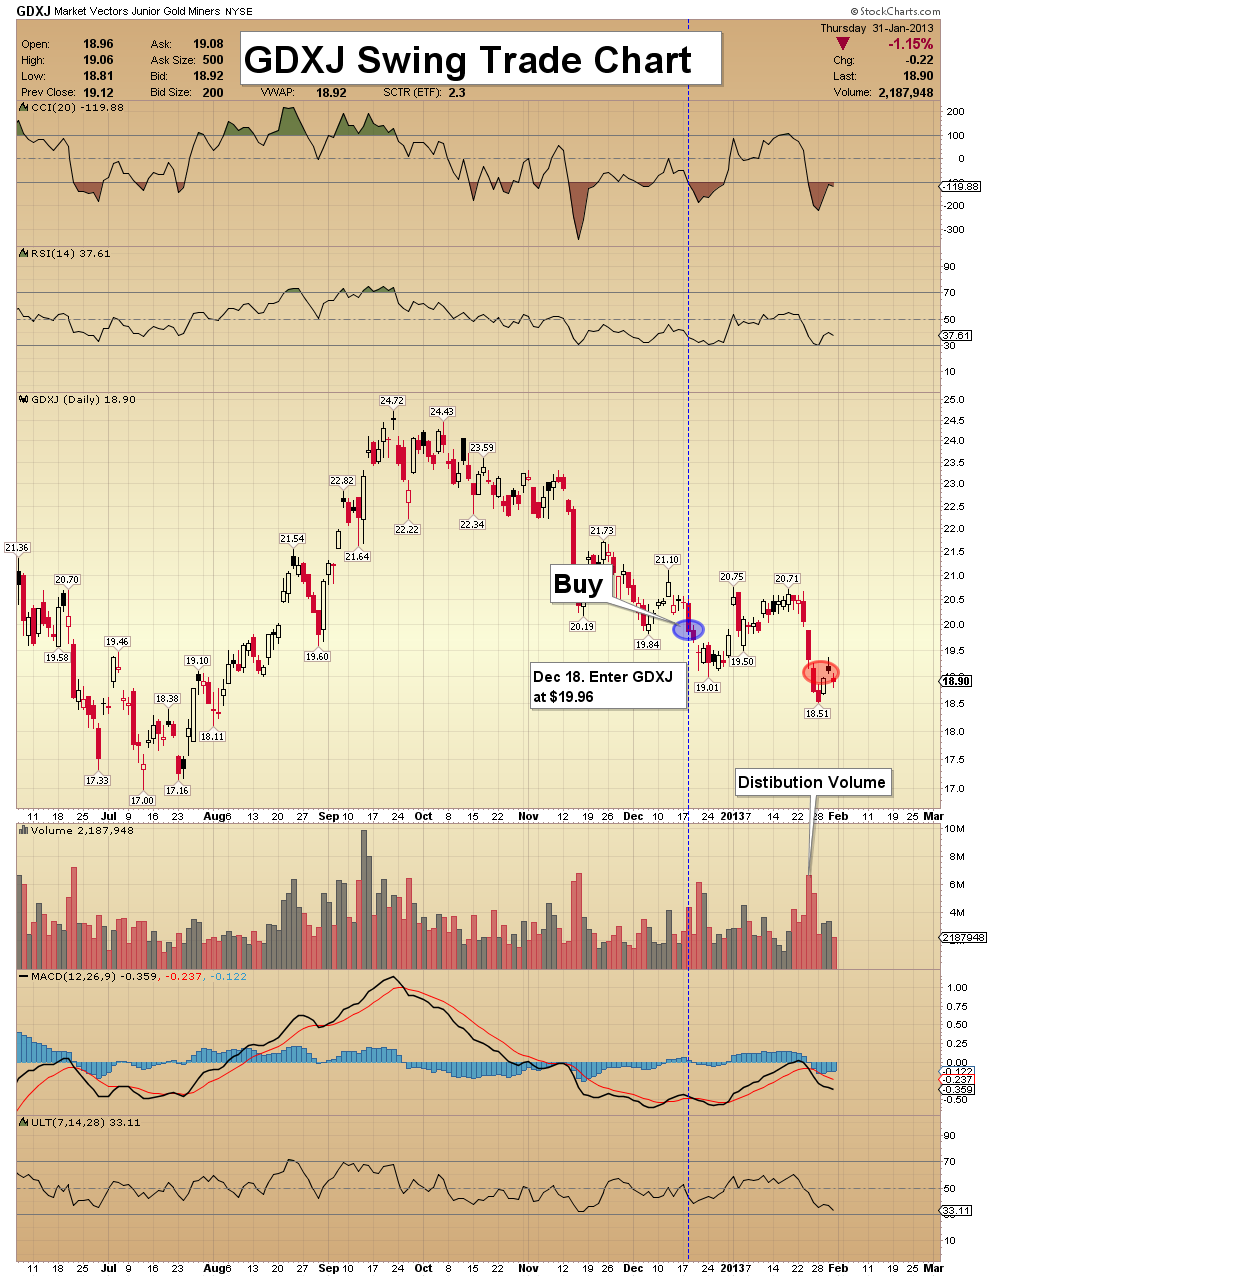
GDXJ Swing Trade Chart - While GDX got a new buy signal, GDXJ did not, because volume indicated distribution, rather than panic. Additional price weakness with character-changing volume is required, before a new buy signal can be offered for GDXJ.
- For junior gold stock accumulators, the time is near, but not quite here!
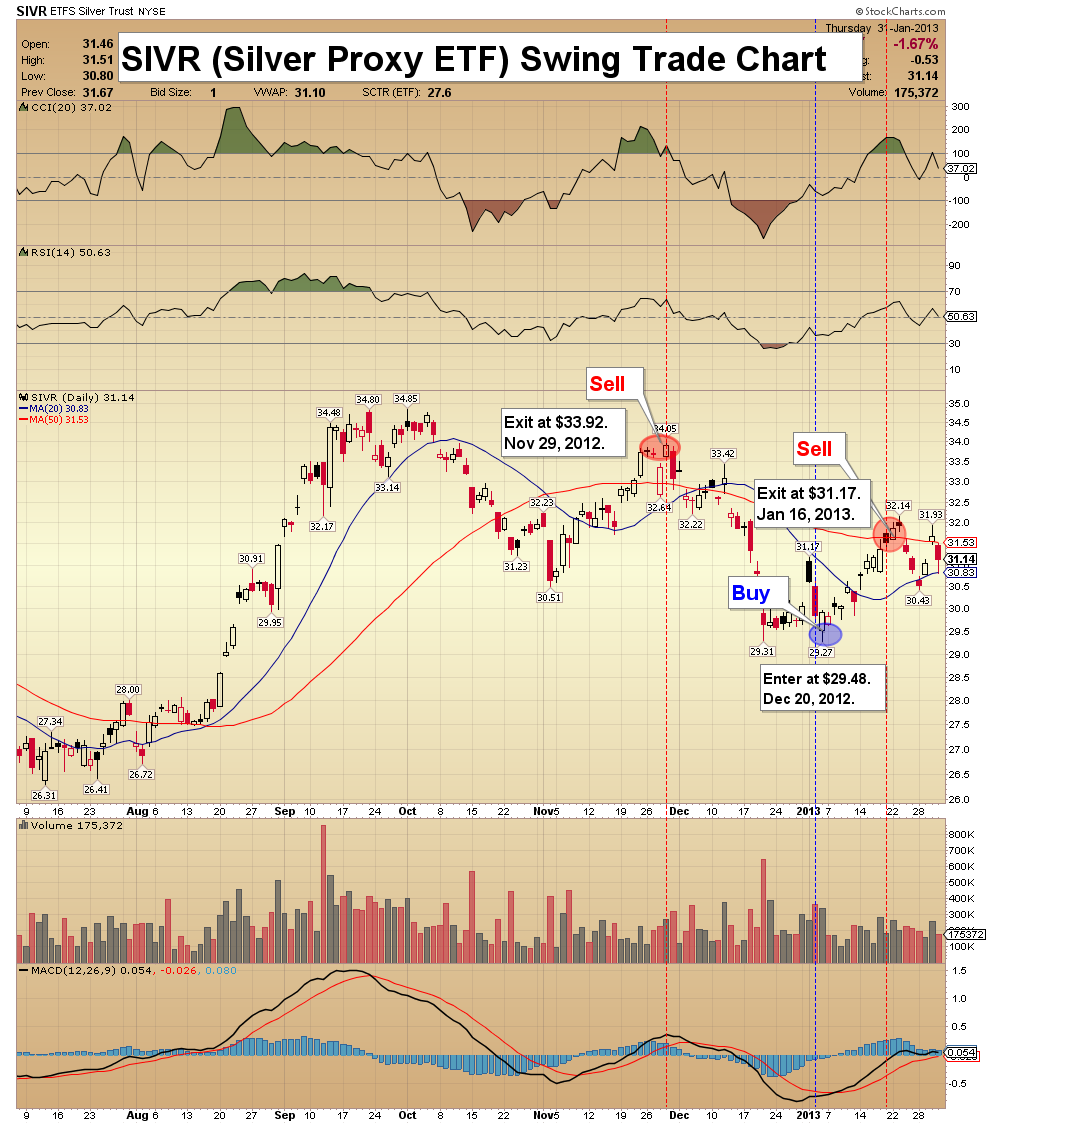
SIVR (Silver Proxy) Chart - Silver has been the best performer in the precious metals market, for several weeks. Continued strength would be encouraging news, for the whole sector.
- Silver is a market where buying low and selling high, using a rigid system of entry and exit points, is very profitable.
- My latest signal was a profit taking alert, but I don’t believe any investor should liquidate more than 30% of their silver position, no matter how bearish the market appears to be. I recommend a large core position of this mighty metal, for even the most active traders!
Friday, Jul 3, 2026 Super Force Signals Unique Introduction For 321Gold Readers:
Send me an email to admin@supergoldsignals.com and I’ll send you my free “Inflation Thunder Now!” gold and silver stocks video report. I’ll also include 3 of my next Super Force Surge Signals free of charge, as I send them to paid subscribers. Thank you!
|
Stay alert for our Super Gold alerts, sent by email to subscribers,
for both the daily charts on Super Force Signals at www.supergoldsignals.com and for the 60 minute
charts at www.supergoldsignals.com
About Super
Gold Signals:
Our Surge Gold Signals are created thru our proprietary blend
of the highest quality technical analysis and many years of successful
business building. We are two business owners with excellent synergy.
We understand risk and reward. Our subscribers are generally successfully
business owners, people like yourself with speculative funds,
looking for serious management of your risk and reward in the
market.
Frank Johnson:
Executive Editor, Macro Risk Manager.
Morris Hubbartt: Chief Market Analyst, Trading Risk Specialist.
website: www.supergoldsignals.com
email:
admin@supergoldsignals.com
email: admin@supergold60.com
Mail:
1276 Lakeview Drive
Oakville, Ontario, L6H 2M8
Canada
### Feb 1, 2013
Morris Hubbartt
321gold Ltd
 |
