Super Force Signals - A Leading
Market Timing Service
We Take Every Trade Ourselves
Gold Correction To $1260. Technical Update
Morris Hubbartt
Weekly Market Update Excerpt
posted Jan 28, 2011
Gold and Precious Metals
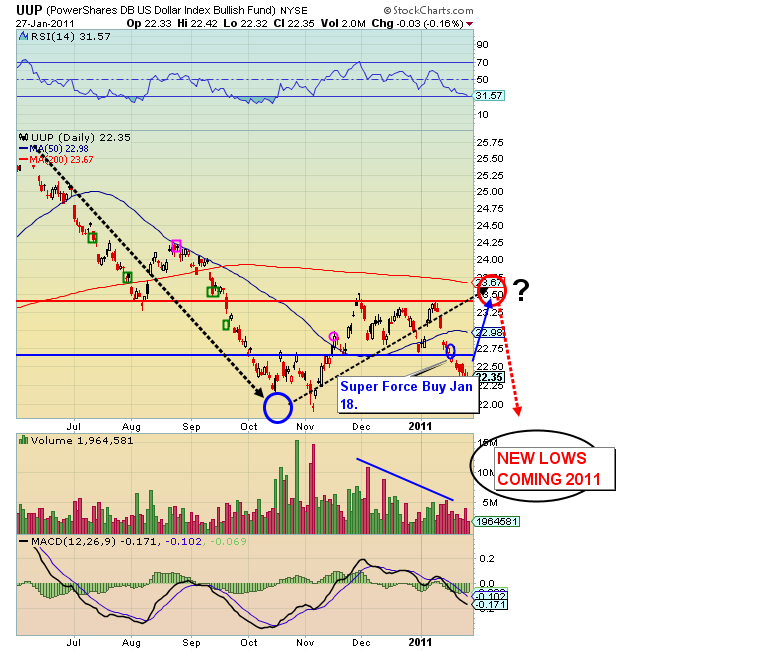
UUP (US Dollar Proxy) Chart
US Dollar Analysis:
-
Your focus is gold, I know. But I want you to focus also on the fact that the action of the US dollar in the last week is not impressive. I have said repeatedly that when the natural trend is up and all you get is distribution followed by lower prices, we may be entering the look out below season prematurely. That time is now.
-
There are rumors in the last few days that the Fed might announce an end to QE. Personally, I don’t think that is possible, not now. That would require strong leadership. We don’t have strong political leadership. Conservatives in congress have talked about real solutions and they are ridiculed. Liberals and socialists want nothing to do with responsible spending and governing; their desire is for power. The action of the Fed works hand in hand with this insanity by bailing out politicians with money printing.
-
The Dollar and Euro are already in trouble and this would have a profound impact on all currencies, and therefore on the value and price of Gold. Everyone is focused on the correction (which I predicted would occur and has, with a $1260 target for gold). Focus on what $100 trillion in new debt means for gold, not today’s $10 drop or whatever. Currencies around the world are already being diluted and that dilution is accelerating.
- A Gold Standard in some form will have to be reintroduced eventually, and that will see Gold revalued considerably higher. Not buying Gold now has been called a “medical insanity” by one fund manager.
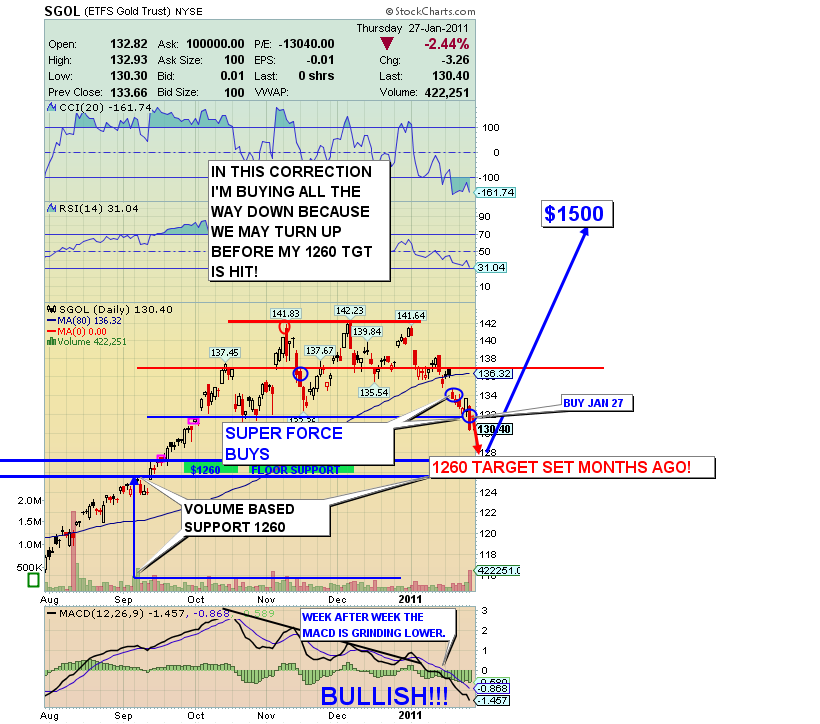
SGOL (gold bullion proxy) 6 Mth Chart
-
I issued a SFS buy signal for SGOL on Jan 27. I still expect a move to $1260 for gold. We have made further progress towards my target this week and I have bought all the way down.
-
Since the Momentum chasers ran out of gas in October, sentiment has turned quite negative. We have come from a frothy mkt to a depressed one, in just a couple of months. I must say this is healthy and normal, and essential to keeping the bull intact.
-
On Tuesday one large Hedge Fund was selling large leveraged gold stock positions. This is unbelievable. Just as this fund manager was dumping his shares, I am loading up SFS subs and hopefully the gold community too. I have recommended buying more Gold shares than any time since last summer, and done so myself. This is the kind of news that lets you know the bottom is near or here in these Gold stocks.
-
Fundamentally, nothing has changed. Inflation is moving up and QE will continue until the system is destroyed. That is the game plan of our controllers. They should examine the history of money printing. It has never worked anywhere, any time. A look at the most recent COT Report made it clear that panic selling is likely creating the best opportunity of the year to buy the premier asset on the globe, gold.
-
When buying like the last two weeks is the action in smart money, again that is the action of my SF60 program. My timing program is a model of buying weakness and selling strength created thru our proprietary blend of quality indicators, so writing losses doesn’t happen. The latest SF60 Closed Trades Summary is 75 wins 0 losses since mid October 2010.
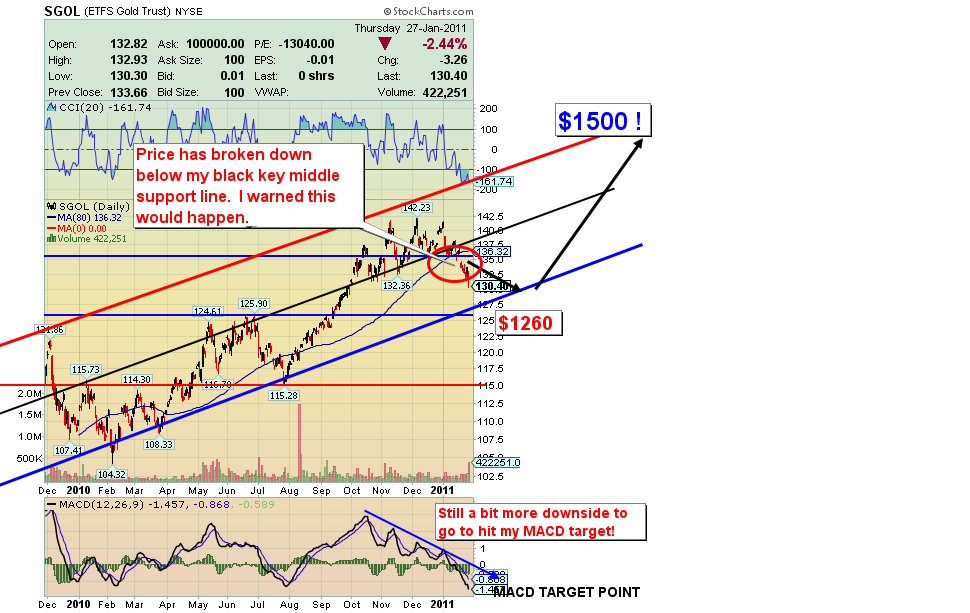
SGOL 14 Month Chart
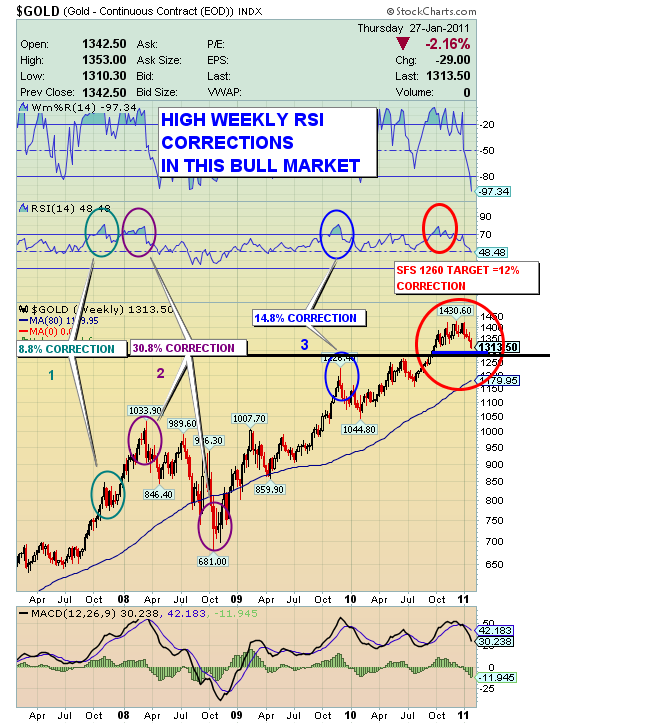
$GOLD- Historical High-Level RSI Market Action Chart
-
The RSI weekly chart is one of the tools that enabled me to successfully call the gold top last fall. At that time I established a target for the current correction. As I look at volume this week, I believe the correction is not over; I continue to look for Gold $1260. I’m a gold buyer, all the down to the target. As of today, it not “all the way down” anymore. It is a little bit further down.
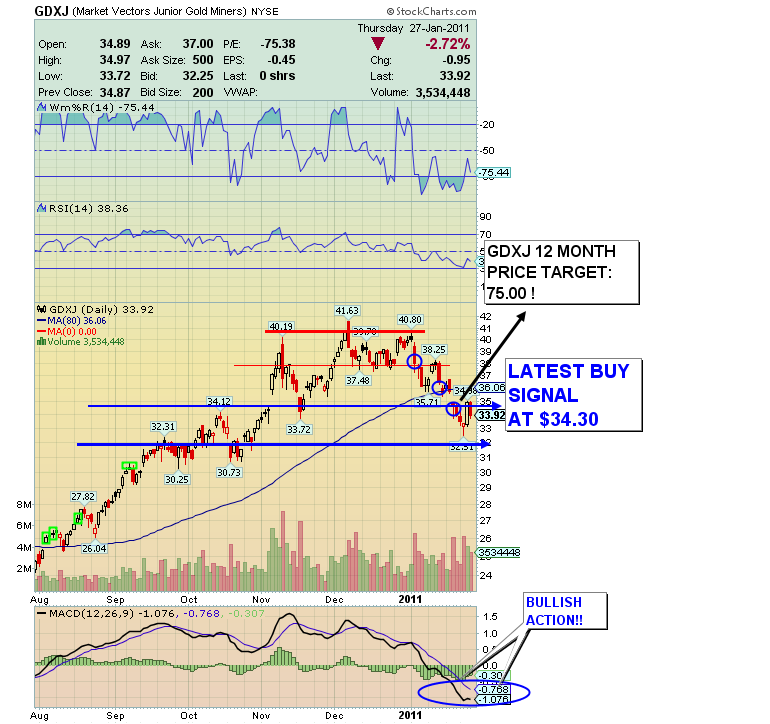
Gold Juniors GDXJ Chart
Gold Juniors Analysis:
-
I issued a Super Force Buy signal on Jan 20th at $34.30 for GDXJ. This is a SFS 75 Buy Signal, a fairly intense buy signal.
-
The largest part of the selling is done on Gold stocks. A look at the volume of the last three months shows far more distribution than buying. The hot money crowd moved in, ran price higher and now are on fire looking for an extinguisher.
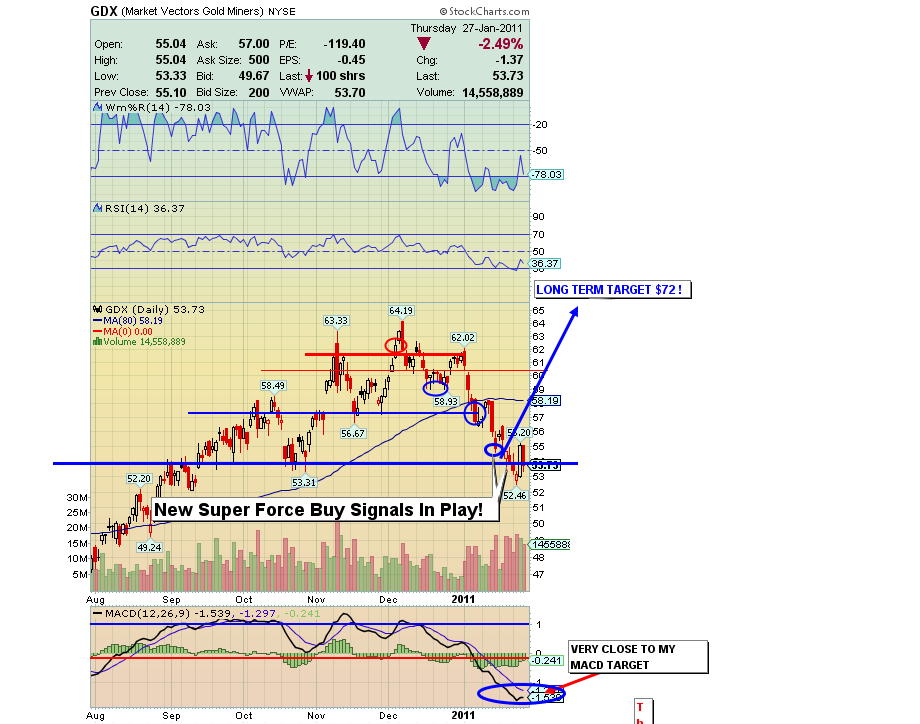
GDX 6 Month Chart
-
The GDX ETF has a SFS 75 buy signal on it as of Jan 20. This is another investment now at my targeted buy zone.
-
Technically the RSI has already been under the key 30 mark. I think the gold stocks will be the leaders as we come out of this correction in gold.
-
I advocate selling domestic general equity stocks in favor of Gold stocks. I am doing this in my own accounts.
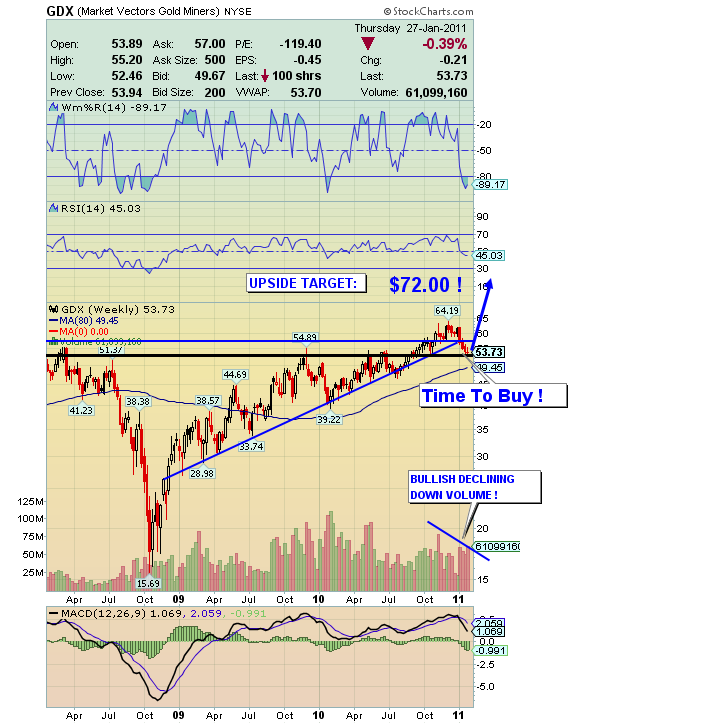
GDX Massive Breakout On 3 Year Chart
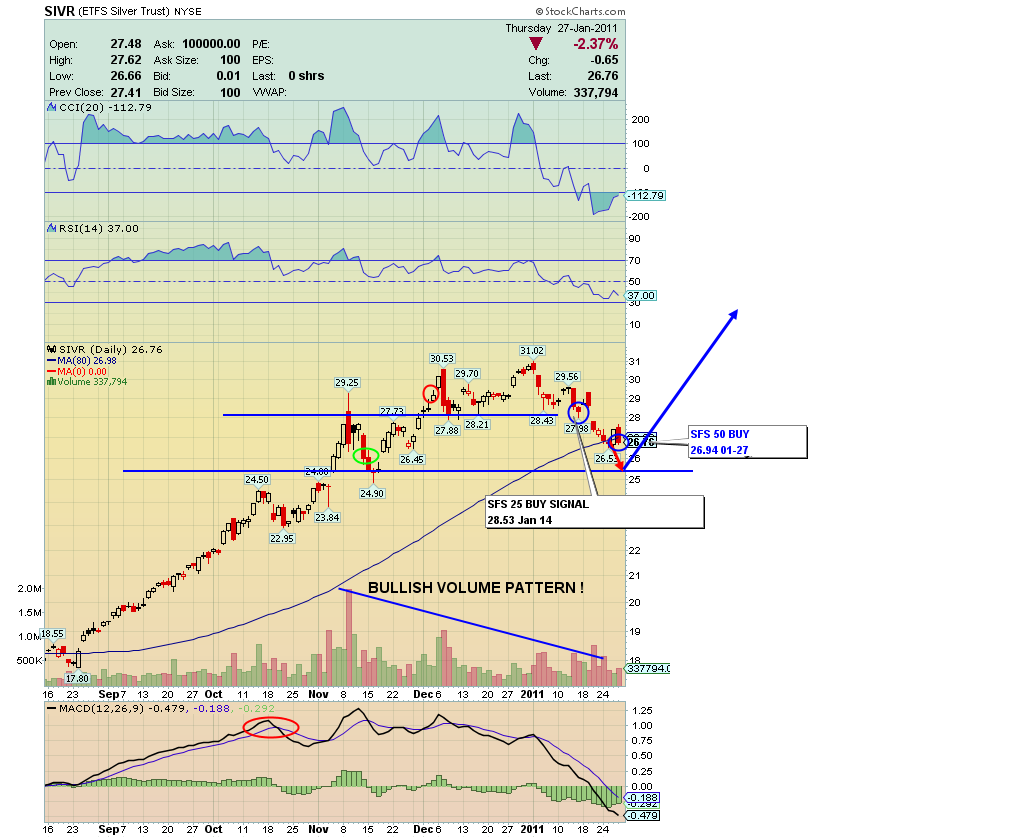
SIVR (Silver Proxy) 6 Mth Chart
-
I have a SFS 50 buy signal on silver. The fact that the Gold and Silver physical markets are outrunning the paper markets indicates that the correction may end quite quickly. It’s interesting to look at recent past corrections in silver, and note the difference this time around. The relative strength is impressive. Silver has far outperformed Gold to the upside yet this correction is not that much deeper.
Friday, Jul 24, 2026 Super Force Signals Unique Introduction For 321Gold Readers:
Send me an email to admin@supergoldsignals.com and I’ll send you my free “Inflation Thunder Now!” gold and silver stocks video report. I’ll also include 3 of my next Super Force Surge Signals free of charge, as I send them to paid subscribers. Thank you!
|
Stay alert for our Super Gold alerts, sent by email to subscribers,
for both the daily charts on Super Force Signals at www.supergoldsignals.com and for the 60 minute
charts at www.supergoldsignals.com
About Super
Gold Signals:
Our Surge Gold Signals are created thru our proprietary blend
of the highest quality technical analysis and many years of successful
business building. We are two business owners with excellent synergy.
We understand risk and reward. Our subscribers are generally successfully
business owners, people like yourself with speculative funds,
looking for serious management of your risk and reward in the
market.
Frank Johnson:
Executive Editor, Macro Risk Manager.
Morris Hubbartt: Chief Market Analyst, Trading Risk Specialist.
website: www.supergoldsignals.com
email:
admin@supergoldsignals.com
email: admin@supergold60.com
Mail:
1276 Lakeview Drive
Oakville, Ontario, L6H 2M8
Canada
###
Jan 28, 2011
Morris Hubbartt
321gold
Ltd
 |
