Super Force Signals - A Leading Market Timing Service
We Take Every Trade Ourselves
Golden Patience & Trading Rules Morris Hubbartt
Weekly Market Update Excerpt
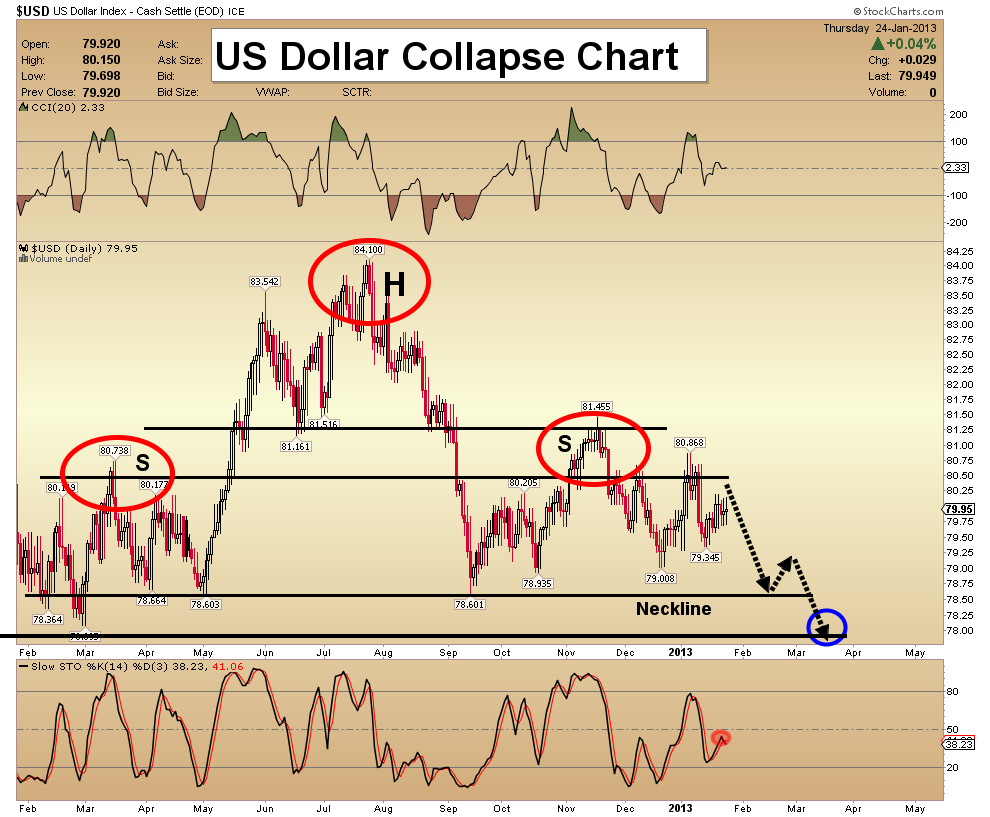
posted Jan 25, 2013 US Dollar Collapse Chart - The dollar’s huge head and shoulders top formation is maturing. The target is 72. It will be activated when the dollar closes under 78, for two consecutive days. A breakdown under 78 should be accompanied by gold breaking above $1800.
- The long term outlook for the dollar is not good. Printing a trillion dollars a year, via QE, is the main catalyst causing the creation of this huge top pattern.
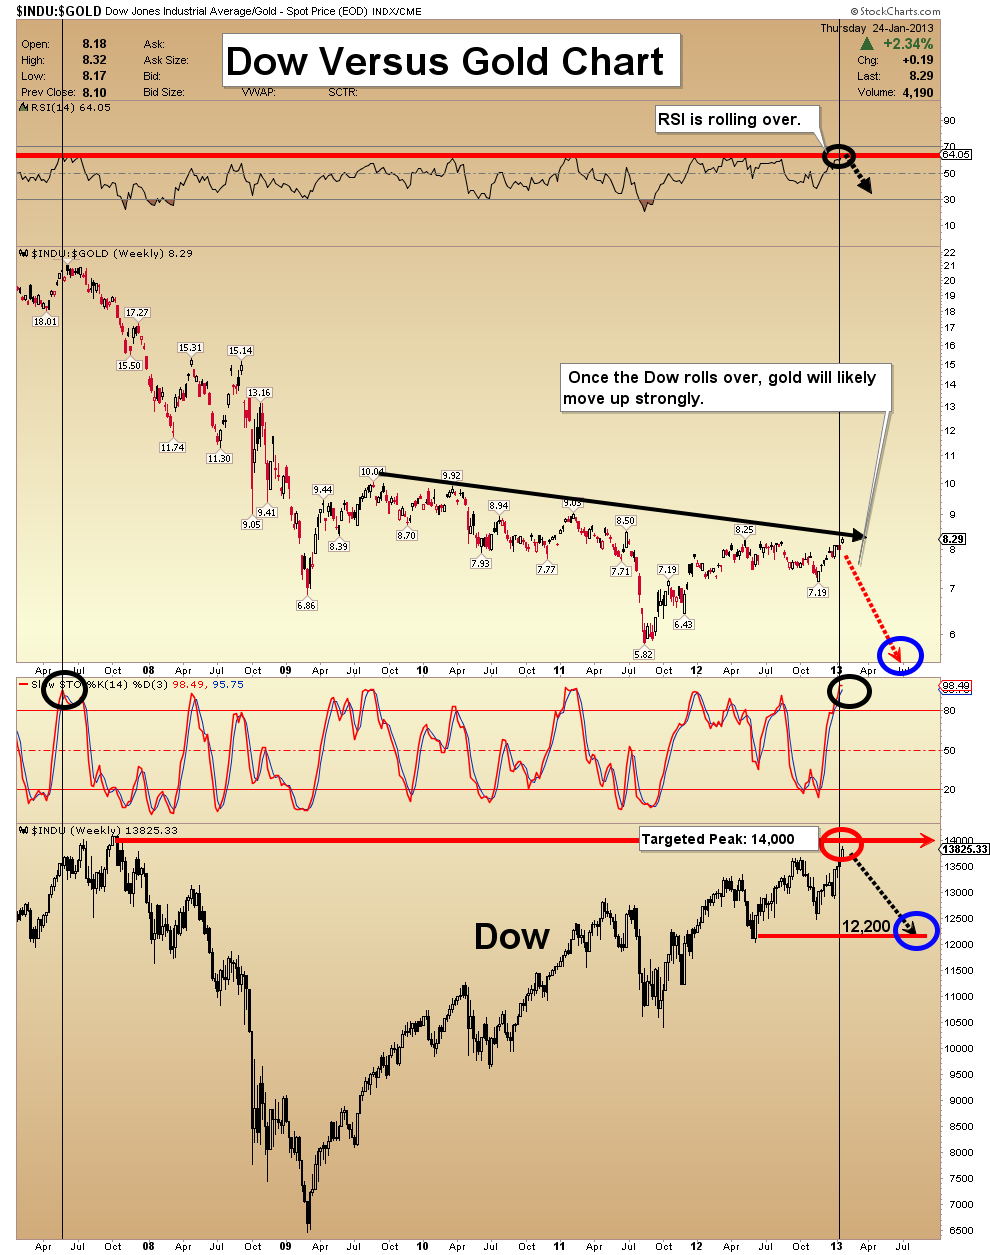
Dow Versus Gold Chart - I have projected that early February would likely see the end of the move up in the Dow, and gold would resume its leadership of all markets then. My last buy signal for the Dow came at about 12,400.
- The market has risen about 10% since then, and I have sold most long positions. I am lightly shorting the market now. My Dow 14,000 target is now just 2% above the current price.
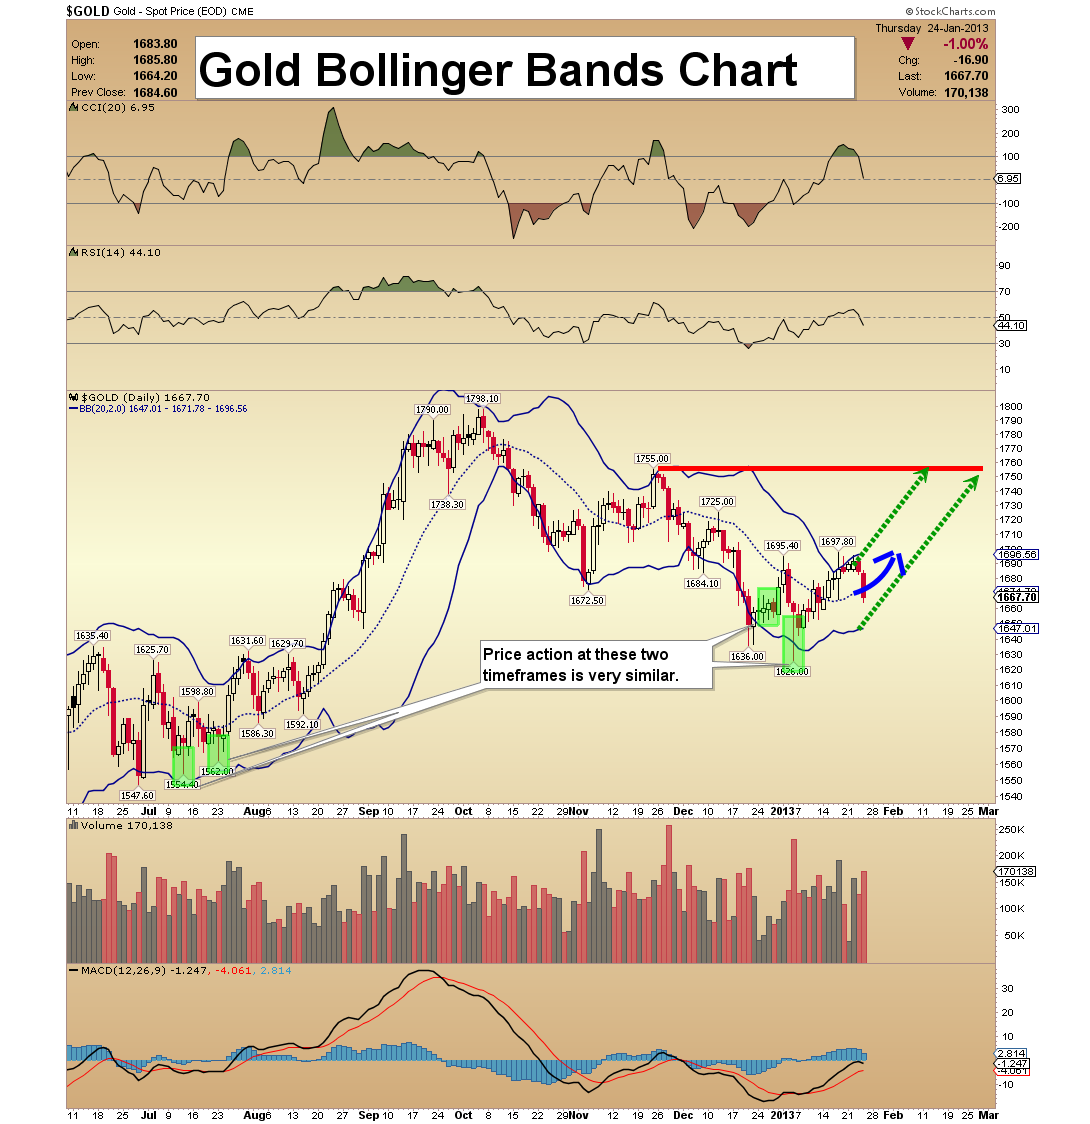
Gold Bollinger Bands Chart - The gold market trend is very close to turning up. Note the highlighted boxes on the chart. Bollinger bands are not what generates my trade signals, but are tools I use to confirm them. The bands are painting a very constructive picture for gold right now.
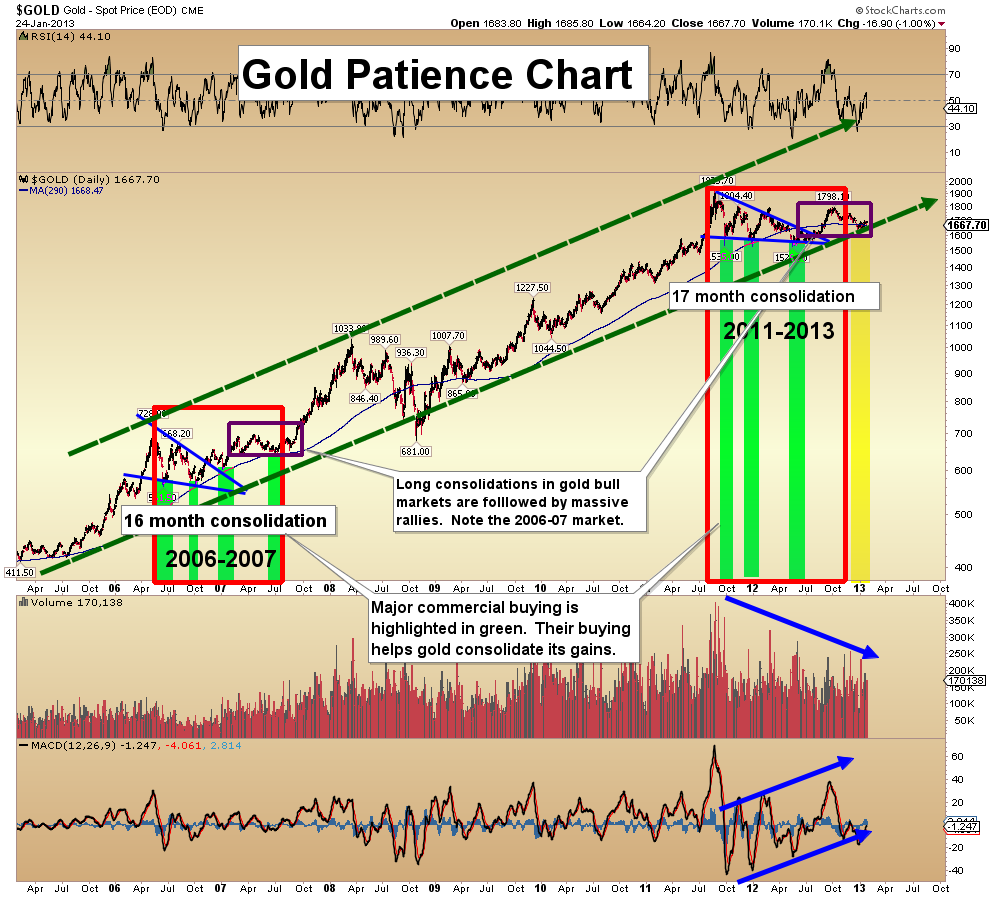
Gold Patience Chart - As you can see, I have not put the final column on this chart in green color, because the smart money commercials haven’t bought heavily in this area, yet. Their buying is needed to start a trending move higher. It’s so close that I can almost “taste it”. This is the point in the bull cycle where investor patience is critical.
- Sentiment is constructive, due to an overly-negative public attitude towards gold. Also, Hulbert’s gold timer surveys continue to show great negativity by the timers who are historically poor performers. This is positive for gold prices.
- Gold is the premier asset to hold in a debt crisis, and that is precisely why my largest personal holding is gold, followed by silver. My recommendation is that physical metal should comprise 70% of all resource-oriented portfolios, and 30% of your entire net worth. I trade the other 30% of my portfolio with a proprietary timing system.
Trading Rules - I want to talk today about swing trading. Traders should keep most of their assets in physical gold bullion, rather than going “all-in” with their trades. That might seem “boring”, but it’s a necessary part of the trading game. If you use leverage, you must use tight stop losses, but that is not a guarantee that you’ll outperform unleveraged traders. The odds are high that leveraged traders will fail, with or without stop losses. Leveraged swing trading is really gambling, but most participants won’t admit it.
- Even when trading without leverage, the amount of account capital you allocate to every trade must be strictly controlled. Trading rules are not made to be broken. I allocate 1-3% of account capital to each signal generated by my timing system, not 30% or 300%! If you allocate huge gobs of capital to my system trades, in the hopes of getting rich quick, you’re more likely to get very poor, very quickly. Traders must understand that Rome isn’t built in a day, but it can be burned down in a day!
- I’m a little concerned that many investors are taking huge gambles in the gold market, particularly on the short side, trying to make back junior gold stock losses. This gambling strategy is like jumping from the fry pan into the fire. In trading, money management is much more important than calling the market.
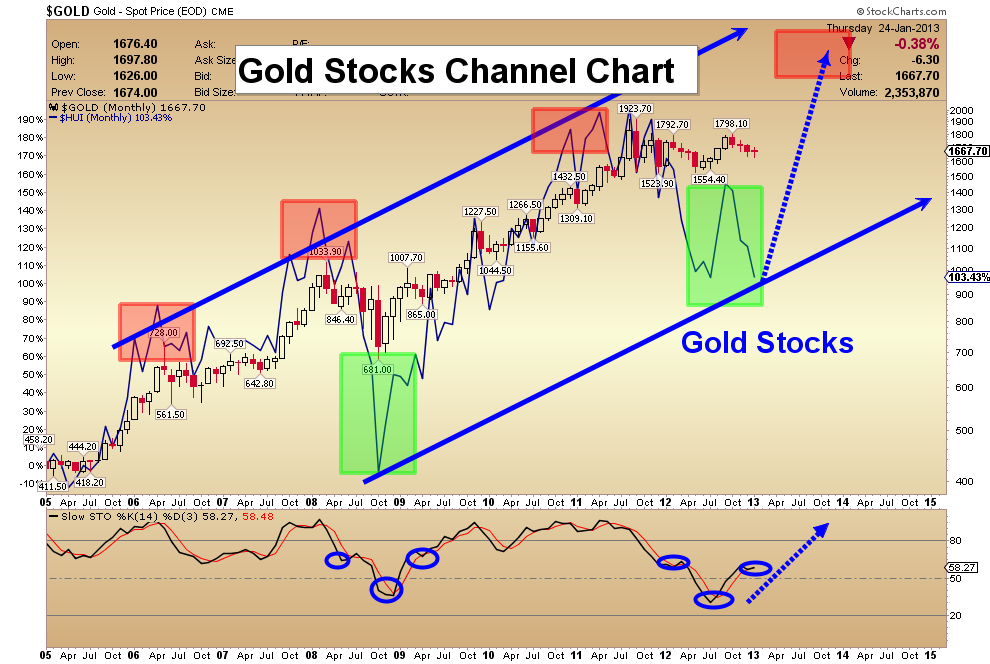
Gold Stocks (GDX) Channel Chart - Over time, markets oscillate from undervaluation to overvaluation. The chart below demonstrates how gold stocks go from one extreme to the other, forming a channel that can be bought and sold.
- In terms of undervaluation, gold stocks are now stretched to the point of challenging the 2008 panic low!
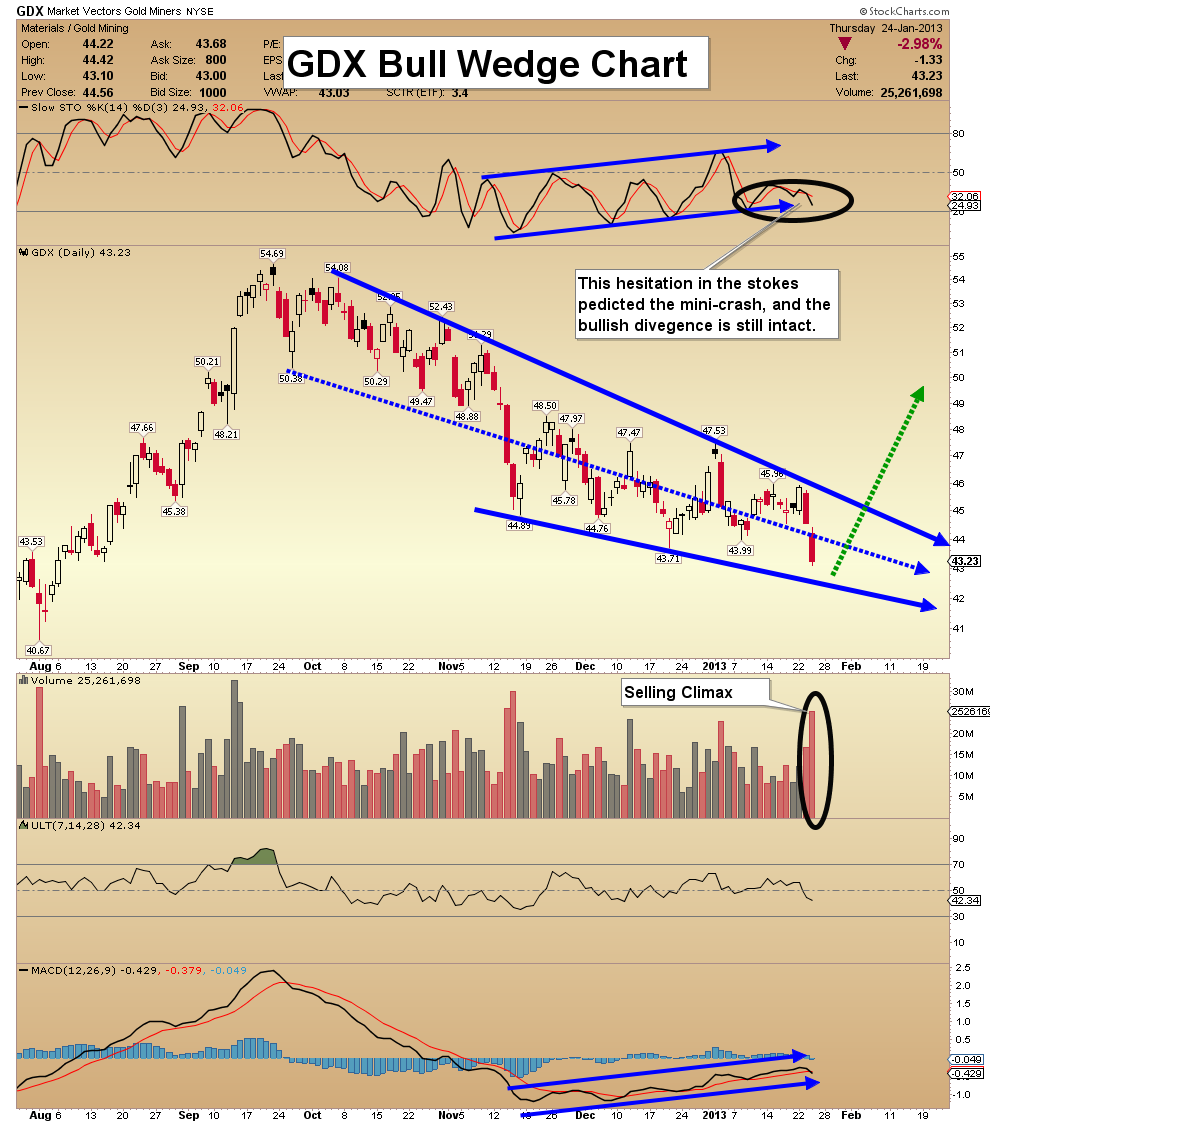
GDX Bull Wedge Chart - Gold stock investors are bloodied, but not beaten. Each recent technically bullish event has been crushed by the bears, but battles must be lost to win a war. Now a bullish wedge pattern has appeared on the GDX chart.
- Will the bears crush this pattern, too? MACD and the slow Stokes are predicting an upside breakout. Regardless, patience is clearly required, to succeed as a gold stock investor!
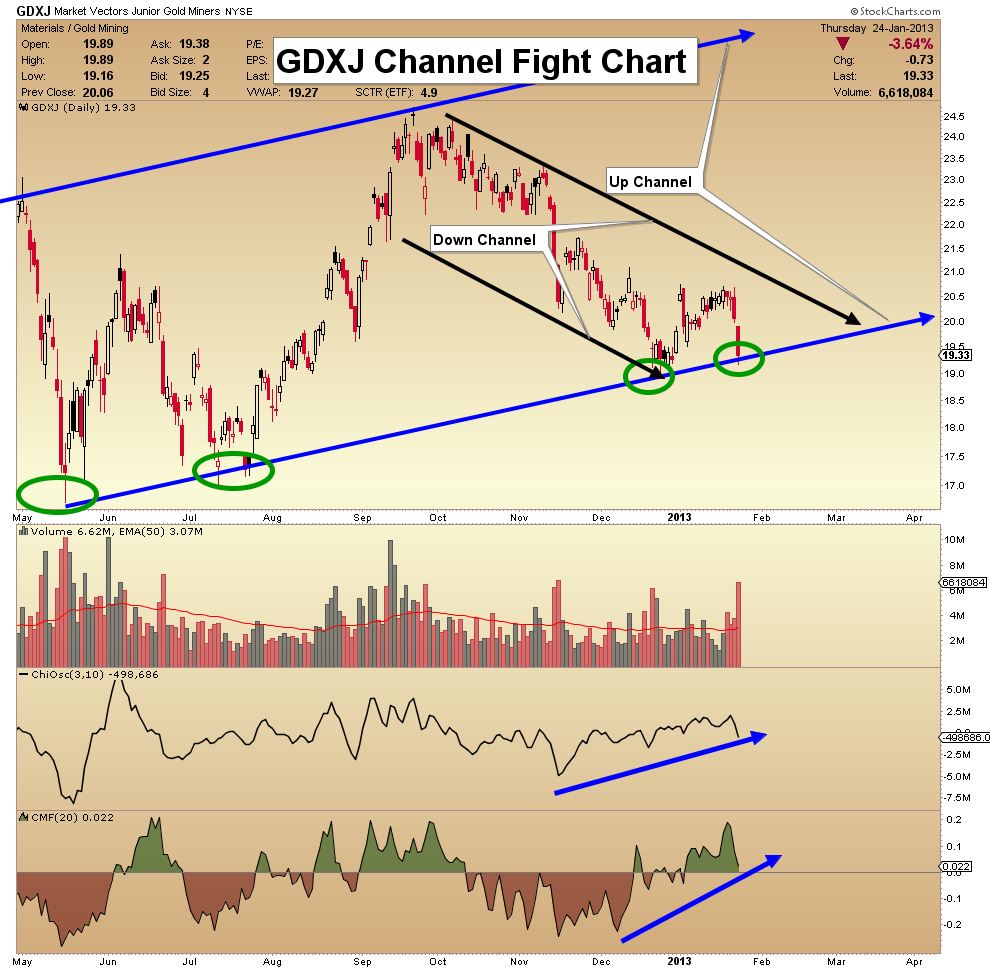
GDXJ Channel Fight Chart - Junior gold stock money flow indicators continue to demonstrate underlying buying by strong hands is in play.
- I call this the channel fight chart, because a small bearish channel is converging with a large bullish one. The bears have been winning most of the junior gold stock fights lately, but the bigger channel usually wins these confrontations.
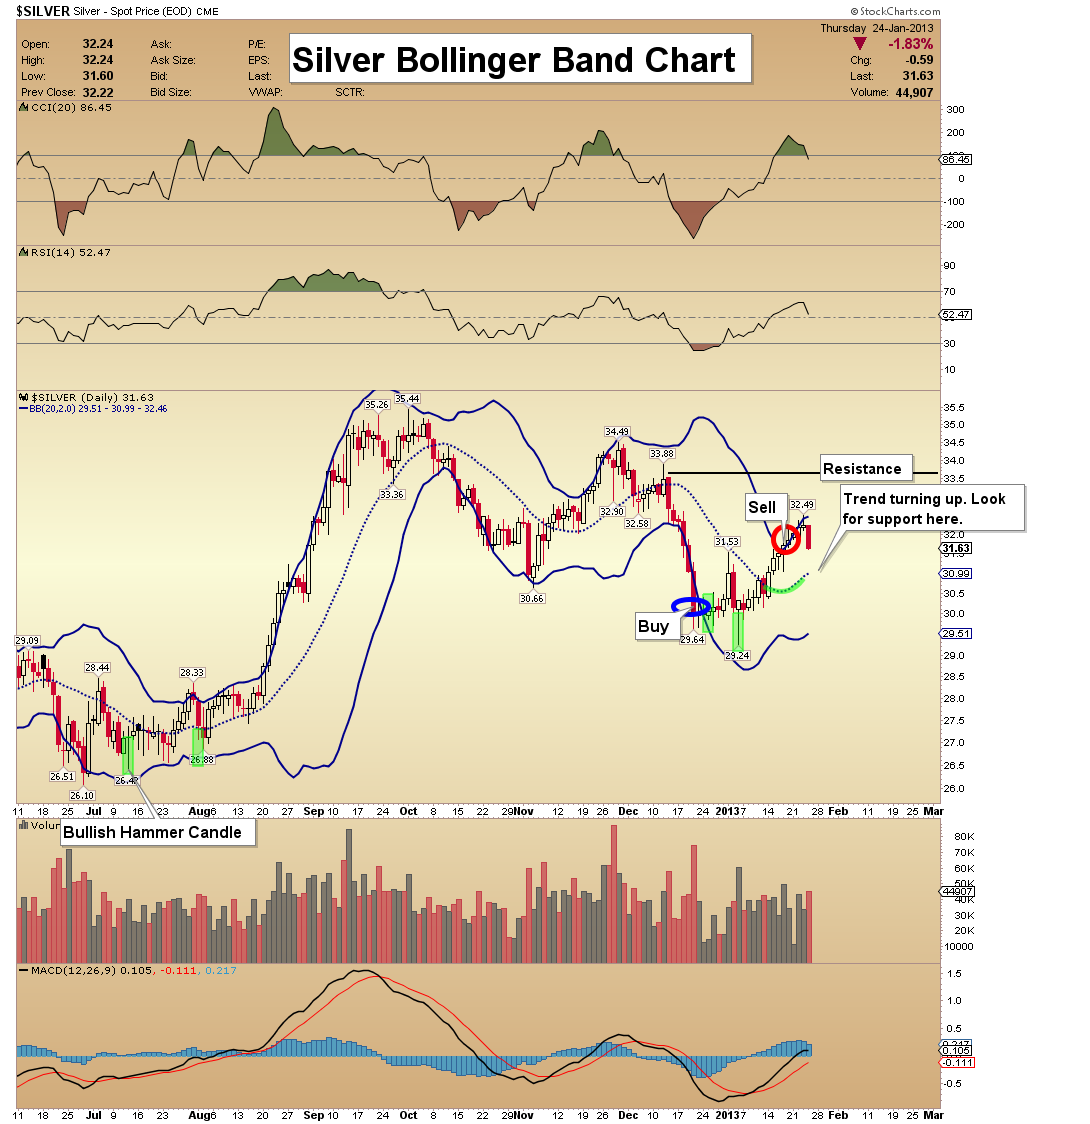
Silver Bollinger Bands Chart - The Bollinger bands are suggesting that yesterday’s frightening sell-off is a “fake out” move. Further gains are indicated, before a more substantial correction occurs. In the short term I’m looking for this pullback to end in the vicinity of the dotted line between the two main Bollinger bands. From there, silver should make a beeline for the resistance area at $33. Happy trading!
Friday, Jul 3, 2026 Super Force Signals Unique Introduction For 321Gold Readers:
Send me an email to admin@supergoldsignals.com and I’ll send you my free “Inflation Thunder Now!” gold and silver stocks video report. I’ll also include 3 of my next Super Force Surge Signals free of charge, as I send them to paid subscribers. Thank you!
|
Stay alert for our Super Gold alerts, sent by email to subscribers,
for both the daily charts on Super Force Signals at www.supergoldsignals.com and for the 60 minute
charts at www.supergoldsignals.com
About Super
Gold Signals:
Our Surge Gold Signals are created thru our proprietary blend
of the highest quality technical analysis and many years of successful
business building. We are two business owners with excellent synergy.
We understand risk and reward. Our subscribers are generally successfully
business owners, people like yourself with speculative funds,
looking for serious management of your risk and reward in the
market.
Frank Johnson:
Executive Editor, Macro Risk Manager.
Morris Hubbartt: Chief Market Analyst, Trading Risk Specialist.
website: www.supergoldsignals.com
email:
admin@supergoldsignals.com
email: admin@supergold60.com
Mail:
1276 Lakeview Drive
Oakville, Ontario, L6H 2M8
Canada
### Jan 25, 2013
Morris Hubbartt
321gold Ltd
 |
