Super Force Signals - A Leading
Market Timing Service
We Take Every Trade Ourselves
Gold Bulldozer Has Gold Stocks Driver
Morris Hubbartt
Weekly Market Update Excerpt
posted Jan 13, 2012
US Dollar Sentiment Extremes Chart
Analysis
- Consider the interest rate paid to retired savers today on their bank deposits. The diligent saver gets no respect. They get almost no interest on their money, while the banks receive trillions of dollars through various money printing programs.
- The quantitative easing programs have crushed interest rates, and kept them crushed. Investors all around the world have run to the “safety” of the US dollar and US Treasury bonds and bills. These are investments that pay little or no interest.
- For even the most prodigious savers, the annual interest paid on savings is not even enough to buy them groceries for the year.
- The dollar is “performing” now because European debt is probably also beyond the point of no return, like our debt is, too. That’s not a great reason to buy the dollar.
- The US Treasury is pressuring China for a higher Renminbi and a lower dollar. The Treasury likes the term “compete” rather than “devalue”, whenever they talk about taking our national currency to the wood shed.
- I have stated for months that the way to take advantage of fiat currency competition (devaluation) is to add to gold bullion positions when the price is negatively affected. The last currency standing will likely always be gold.
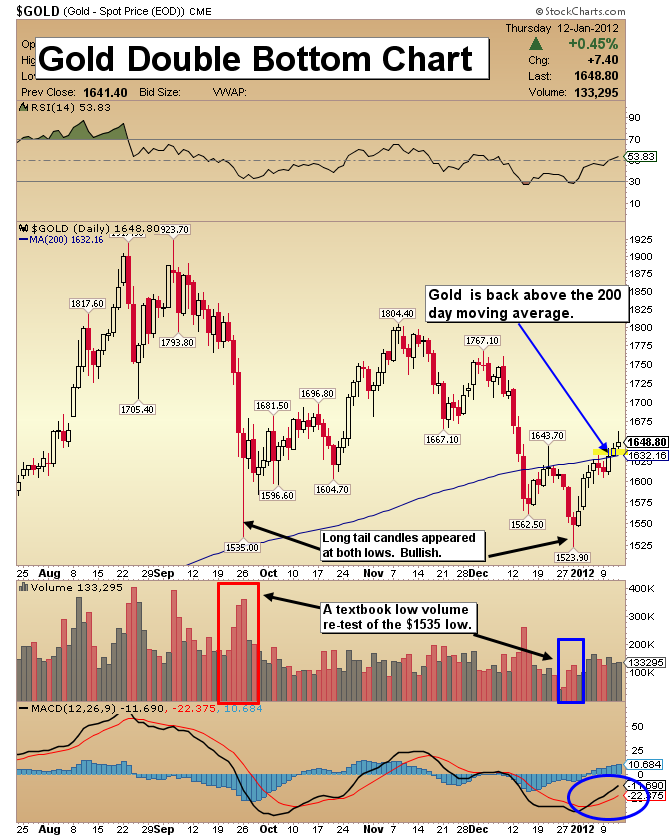
Gold Double Bottom Chart
- Many investors are convinced that the bottom is falling out of gold, and the gold bull market is finished. The weight of the technical and fundamental evidence suggests they are probably quite premature in making these statements.
- I would argue that gold is undervalued just based on the amount of fiat currency that has been printed over the past few years. Much more money printing is likely to come. Technically, gold is exhibiting a textbook-style double bottom, which is very bullish.
- Look at the volume patterns on this chart, and the long-tailed candles that mark each bottom. Gold has also recaptured the 200 day moving average, which is another bullish event.
- This chart shows no evidence of a top in gold. Quite the opposite is the case; gold is likely putting in a substantial bottom, and is poised to rise dramatically from this large double bottom formation.
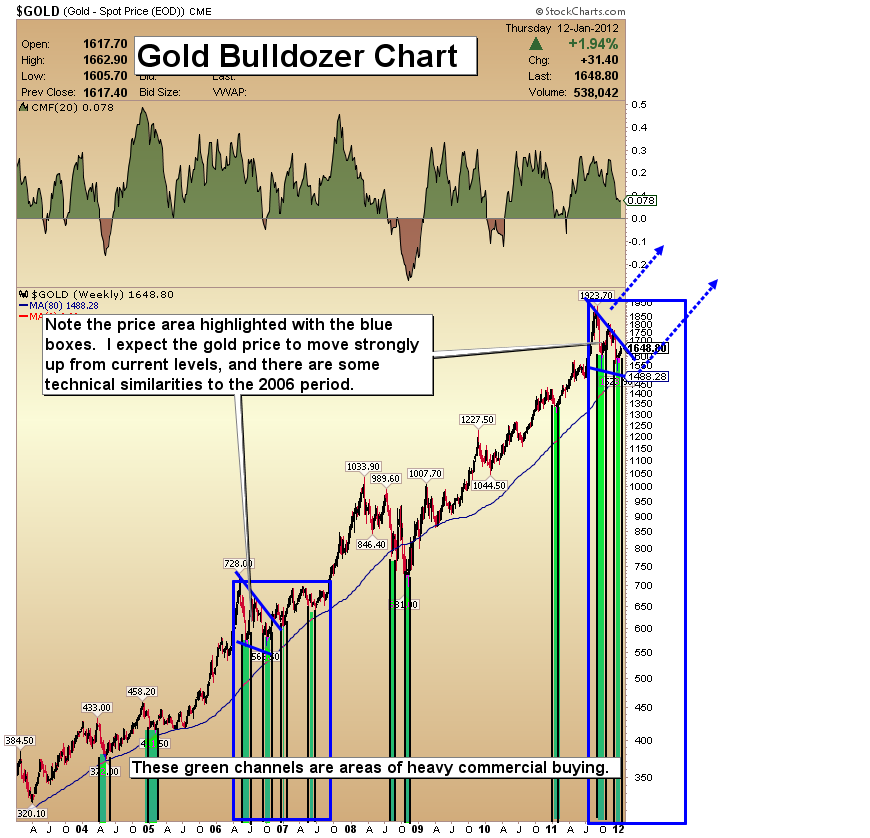
Gold Bulldozer Chart
- I have two scenarios for gold bullion prices. The first is a run straight to $2300 area by mid-year, with very little correction in the price. The second scenario has gold also rising to $2300, but in December of this year.
- In the short term, it seems likely that gold will trade up to about $1700 on this move. At that point I expect a pullback accompanied by substantial commercial buying, as we have seen on every pullback over the last several months.
- In this “gold bulldozer scenario”, gold is likely to perform more like it did after the 2006 low than it did after the 2008 low. After the 2008 low, gold rocketed higher. In 2006, gold first acted more like a bulldozer, plodding steadily higher.
- The good news for investors is that both scenarios are bullish, and after the “bulldozing period” that followed the lows of 2006, gold did begin a period of very rapid price appreciation.
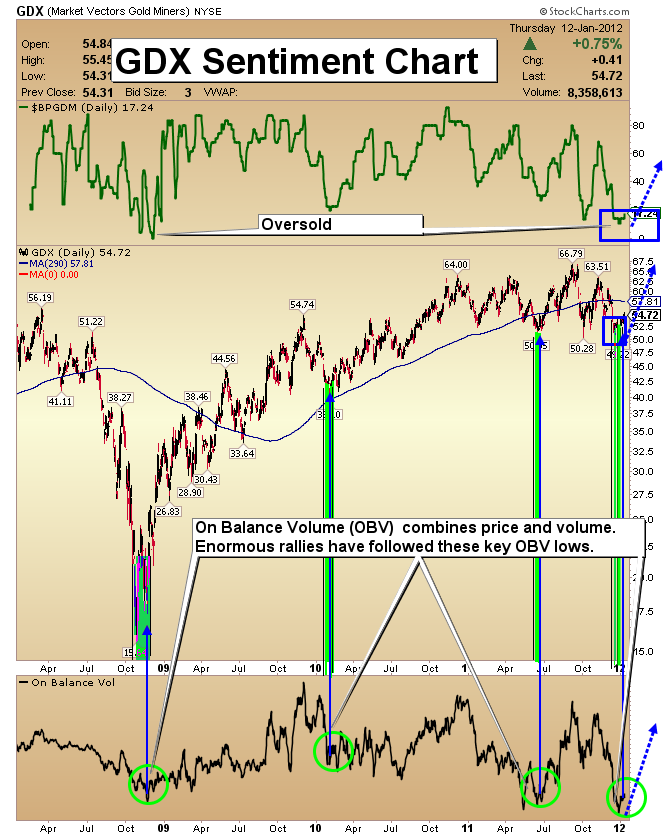
GDX Sentiment Chart
- 2012 could produce “the great gold stock rally”. Even if bullion rises “only” to $2300, gold stocks could move much higher. Look at the above chart. The technical table is set. I use a number of sentiment indicators, and at this time they all project an enormous rally has barely started.
- My data indicates that short-covering is likely to fuel this stage of the gold stocks rally. This week gold stocks have continued higher, yet sentiment of weak investors has gotten even more bearish.
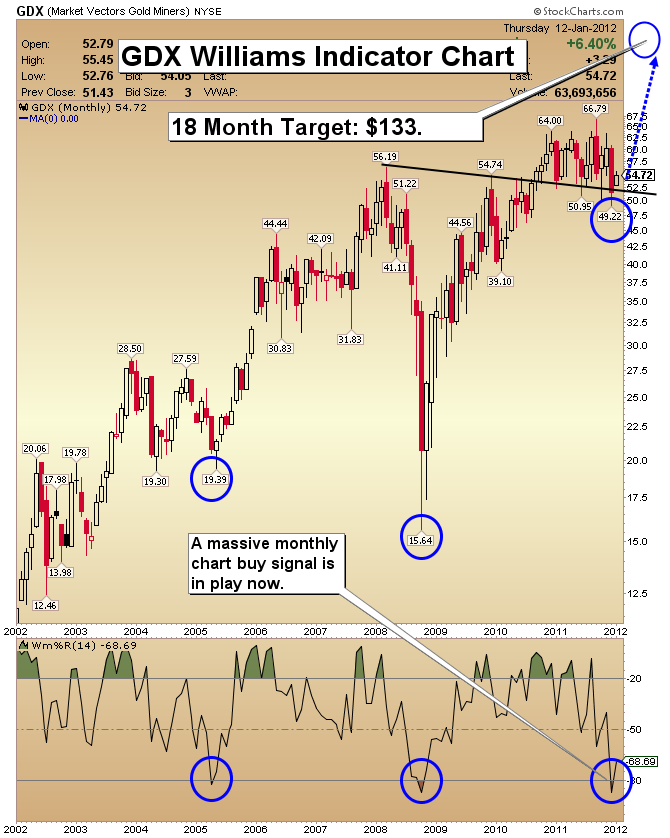
GDX Williams Indicator Chart
- It is important to hold a large core of gold stock positions. Monthly charts are too boring for most investors to follow, yet they produce the biggest chart signals.
- One of them is in play now, and it is an enormous buy signal that has just been generated by the Williams indicator. The indicator has turned sharply higher, from a dramatically oversold position. Looking at how the indicator turns up is very important. A V-shaped turn above the -80 line is the most bullish type of move, and that is in play now.
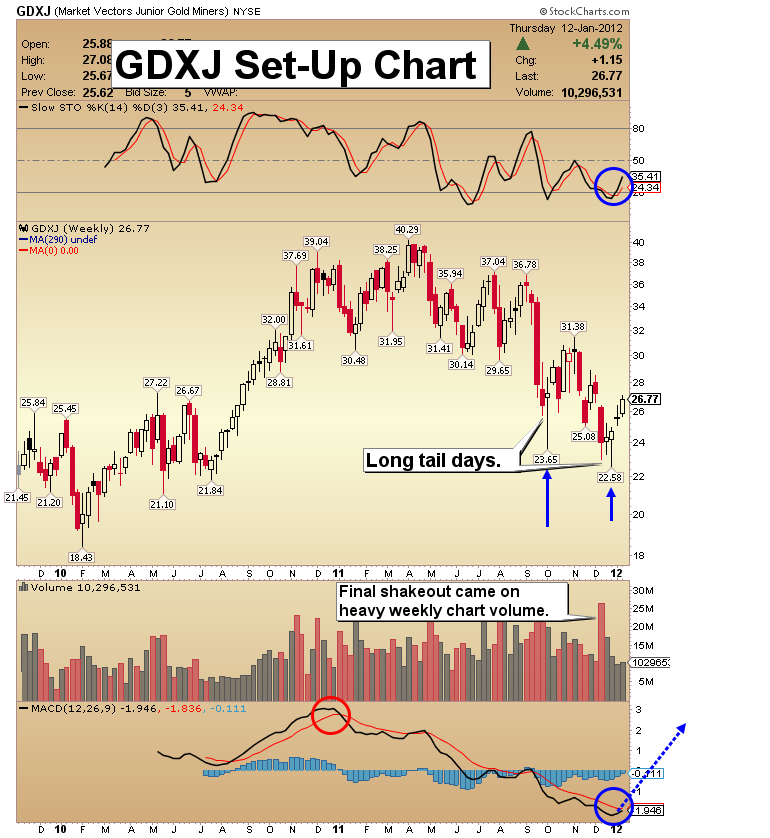
GDXJ Set-Up Chart
- This week I’ve included a look at the GDXJ weekly chart. I see a lot of opportunity going forward for junior precious metal stocks. The daily, weekly and monthly charts all have buy signals in play, which is good news. In the gold community, junior gold stocks are the most-followed sector of the metals market.
- My suggestion is to ignore the fear-mongers and buy some long term quality juniors. My favorite way to buy juniors is through this ETF. The opportunity is compelling.
- Long-tailed candles, a key volume spike day, MACD, and the slow Stochastics indicator all are combining to give this weekly chart a very bullish posturing.
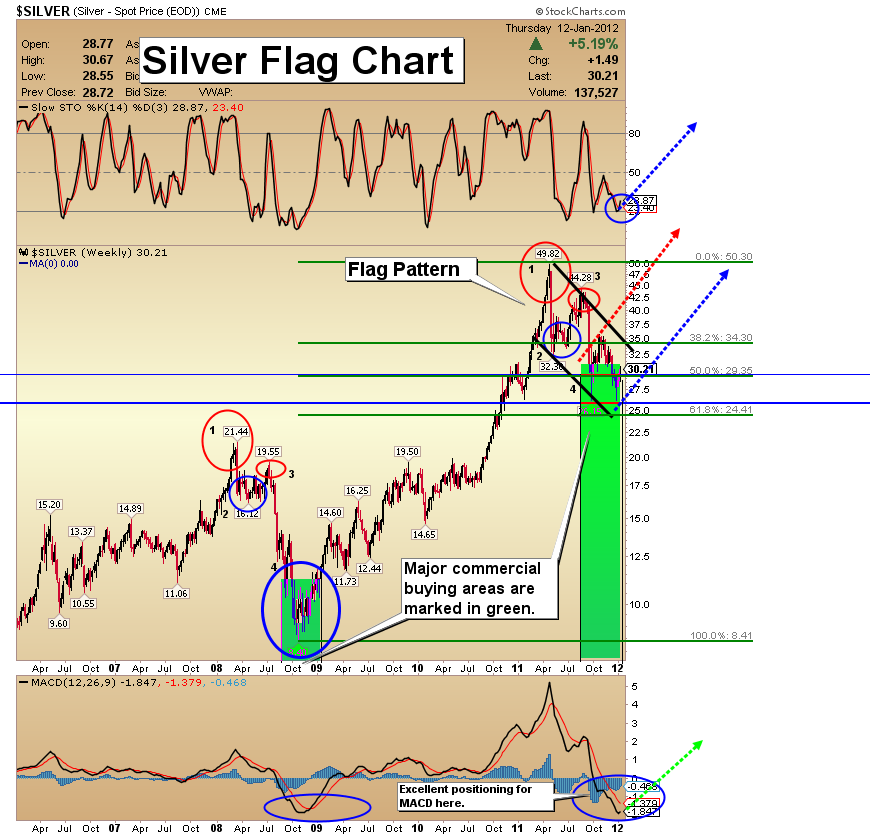
Silver Flag Chart
- Silver is my asset of choice. The price has just appreciated by about 10%. You could wait for further light weakness to add to positions, but I want you to think about the enormous upside implications of this flag pattern.
- The MACD is positioned to drive the silver price up and out of the flag pattern. The slow “stokes” (Stochastics) look good, and the commercial buying and short-covering into the lows is incredibly bullish.
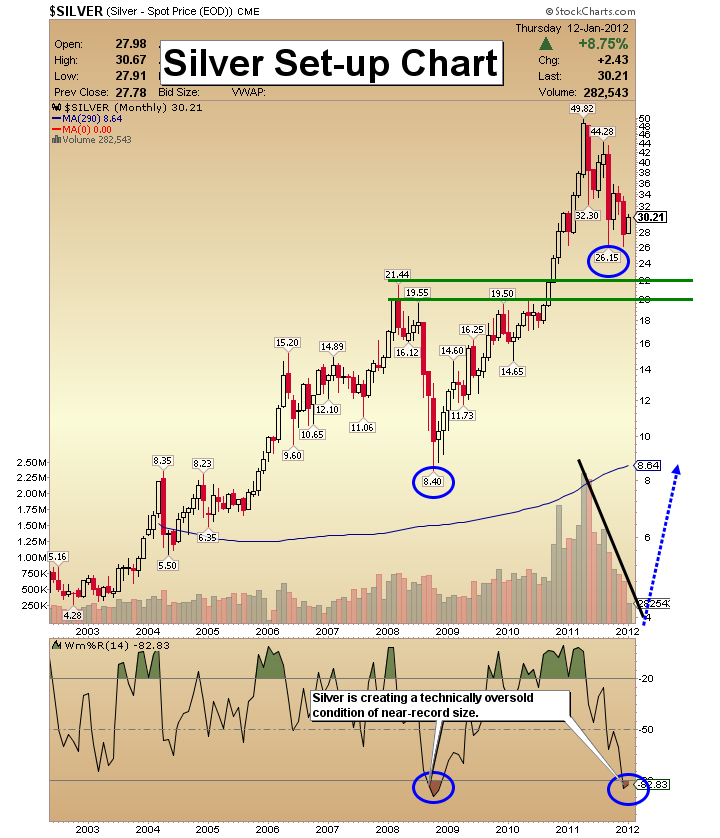
Silver Williams Indicator Chart
- While the V-shaped Williams indicator turn that exists on the GDX chart is not quite as evident here, the absolute positioning is very positive.
- The volume pattern on this silver chart is extremely bullish. As the price rose towards $50, volume expanded. As the price has fallen, volume has contracted in sync with the price.
- When investing it pays to keep the biggest perspective. The above monthly chart for silver produces evidence that silver, my favorite asset, is now a major buy!
Friday, Jul 3, 2026 Super Force Signals Unique Introduction For 321Gold Readers:
Send me an email to admin@supergoldsignals.com and I’ll send you my free “Inflation Thunder Now!” gold and silver stocks video report. I’ll also include 3 of my next Super Force Surge Signals free of charge, as I send them to paid subscribers. Thank you!
|
Stay alert for our Super Gold alerts, sent by email to subscribers,
for both the daily charts on Super Force Signals at www.supergoldsignals.com and for the 60 minute
charts at www.supergoldsignals.com
About Super
Gold Signals:
Our Surge Gold Signals are created thru our proprietary blend
of the highest quality technical analysis and many years of successful
business building. We are two business owners with excellent synergy.
We understand risk and reward. Our subscribers are generally successfully
business owners, people like yourself with speculative funds,
looking for serious management of your risk and reward in the
market.
Frank Johnson:
Executive Editor, Macro Risk Manager.
Morris Hubbartt: Chief Market Analyst, Trading Risk Specialist.
website: www.supergoldsignals.com
email:
admin@supergoldsignals.com
email: admin@supergold60.com
Mail:
1276 Lakeview Drive
Oakville, Ontario, L6H 2M8
Canada
###
Jan 13, 2012
Morris Hubbartt
321gold
Ltd

|
