Super Force Signals - A Leading Market Timing Service
We Take Every Trade Ourselves
Gold's Early Dawn Morris Hubbartt
Weekly Market Update Excerpt
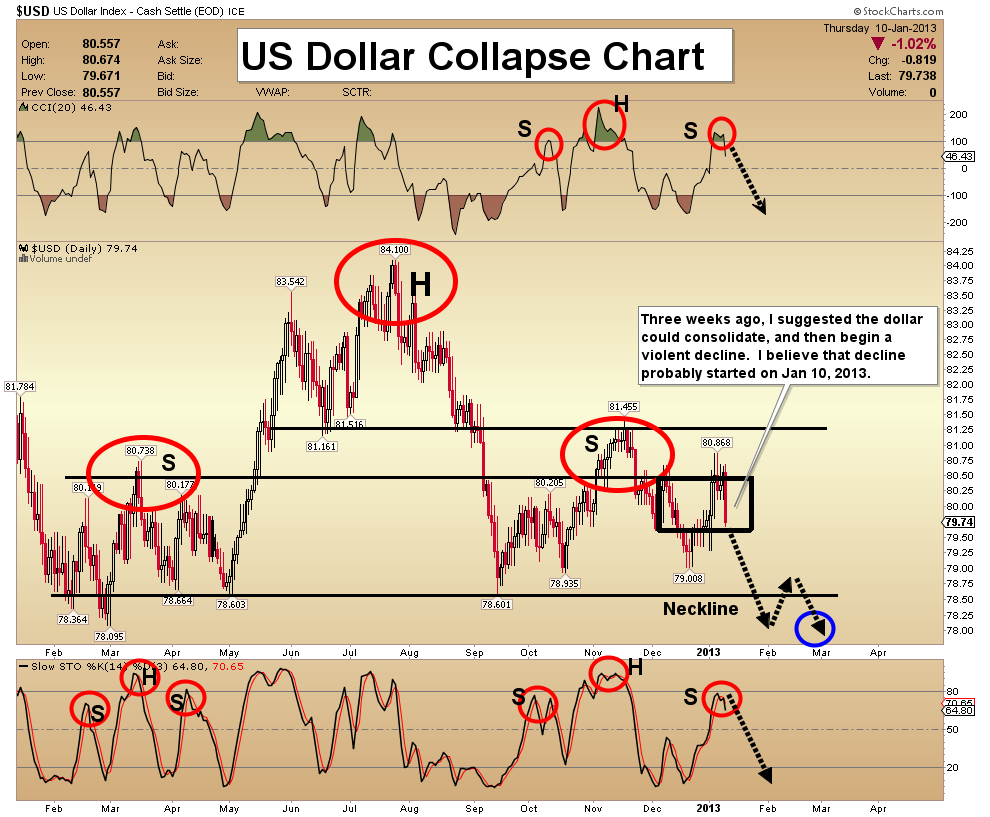
posted Jan 11, 2013 US Dollar Collapse Chart - I projected that the dollar would consolidate for about 3 weeks, and then a collapse would begin. The primary downtrend likely resumed on Jan 10, 2013. The catalyst appears to be Mario Draghi’s comments about a recovery in Europe.
- Technically, 80.50 area is critical, as the dollar can't seem to stay above that level for any substantial amount of time.
- The oscillators show no negative divergences; this indicates sideways trading is likely, with an upward bias, for a few more days. After that, I see the dollar beginning a decline akin to a snowball tumbling off a cliff of gold.
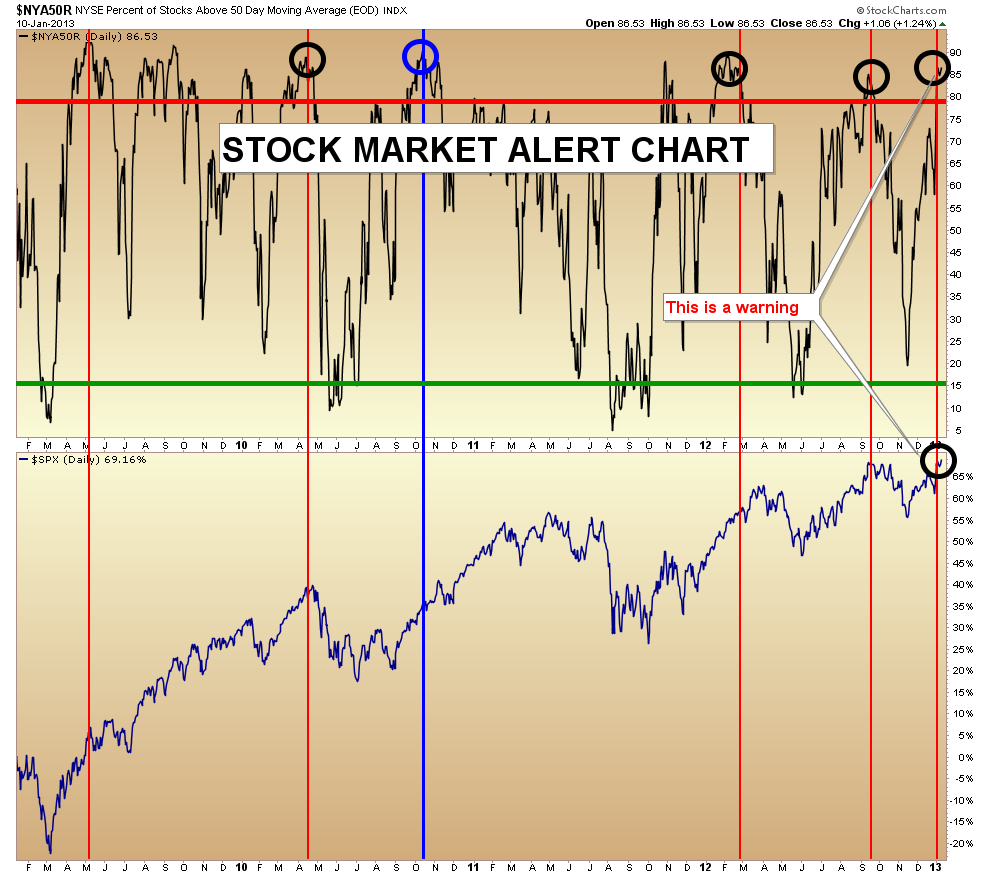
Stock Market Alert Chart - This chart shows the percentage of NYSE stocks that are trading above their 50 day moving average. It suggests the dollar could pullback by 10%, or more.
- No indicator is perfect, and if you note the blue vertical line on the chart, you’ll see one example of this one going awry. Technically, I think the Dow is capable of making it to 14,000 before collapsing.
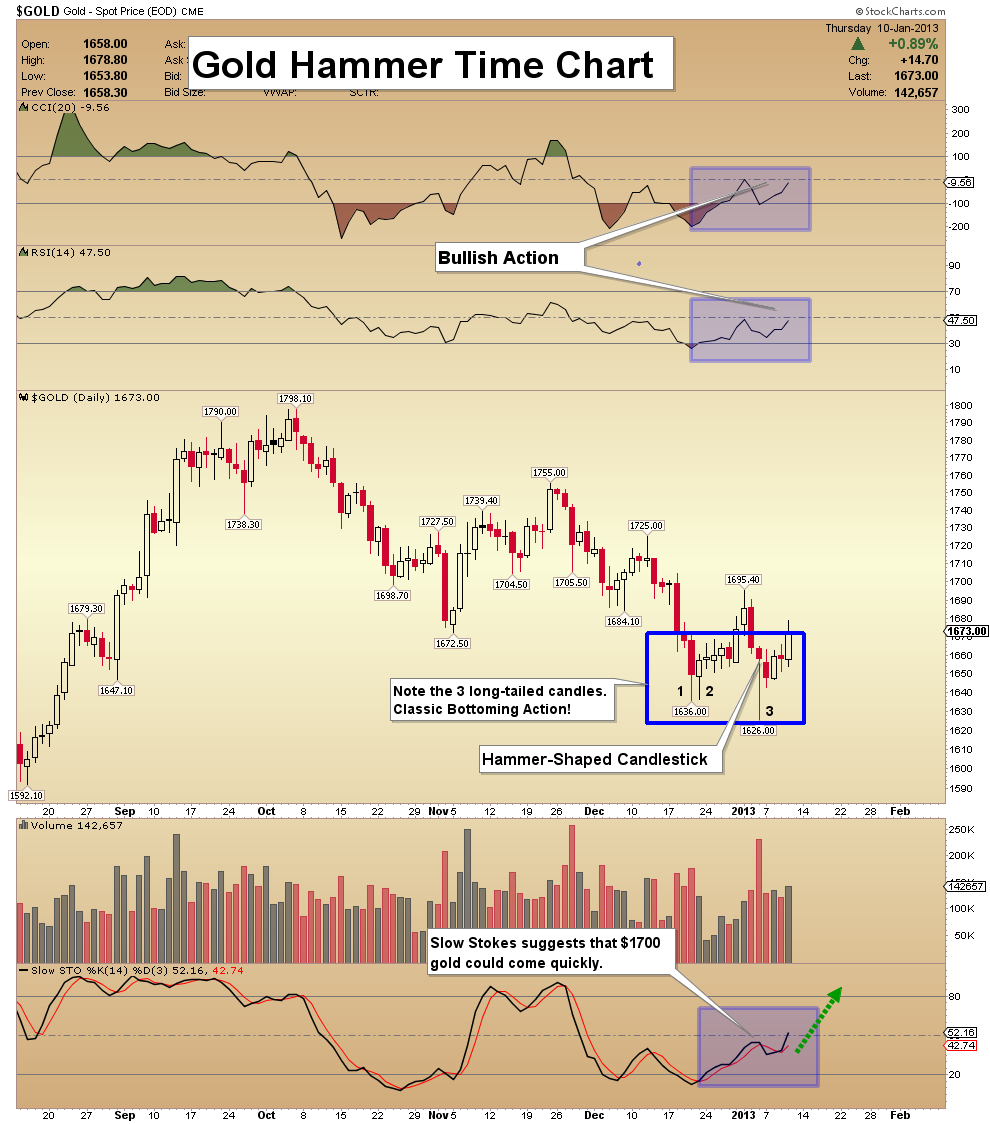
Gold Hammer Time Chart - Note the bullish long-tailed candlesticks on this chart. Last Friday’s jobs report created an exciting hammer candle formation, and it came on climactic volume.
- While this action is quite encouraging, even more long tails could occur over the next few trading days, creating more volatility.
- Note the action of the CCI, RSI, and Stochastics. The powerful bullish divergence of key technical indicators is suggesting that the coming rally could “rock your world!”
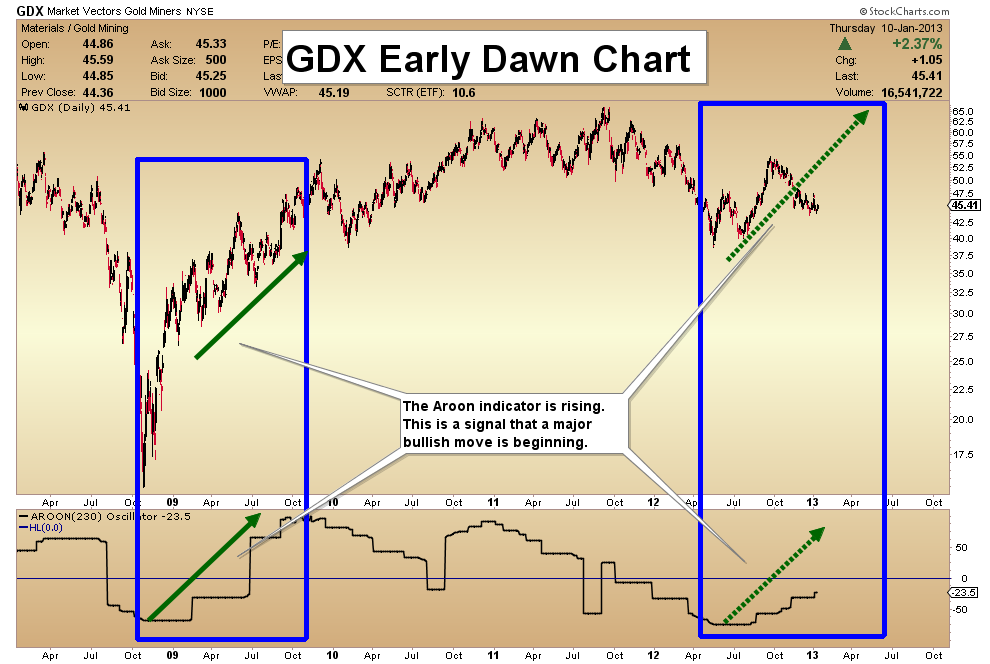
GDX Early Dawn Chart - As with gold, there are positive indicators of an impending rally in the gold stocks sector.
- Note the Aroon indicator that I’ve highlighted on this chart. In Sanskrit, “Aroon” means "Dawn's Early Light". Since GDX began correcting from $55 area, the Aroon indicator has moved steadily higher.
- This key indicator of trends is not just predicting a small bounce, but a very meaningful rally. In the coming weeks, I’ll continue to watch the Aroon, for further signs of progress!
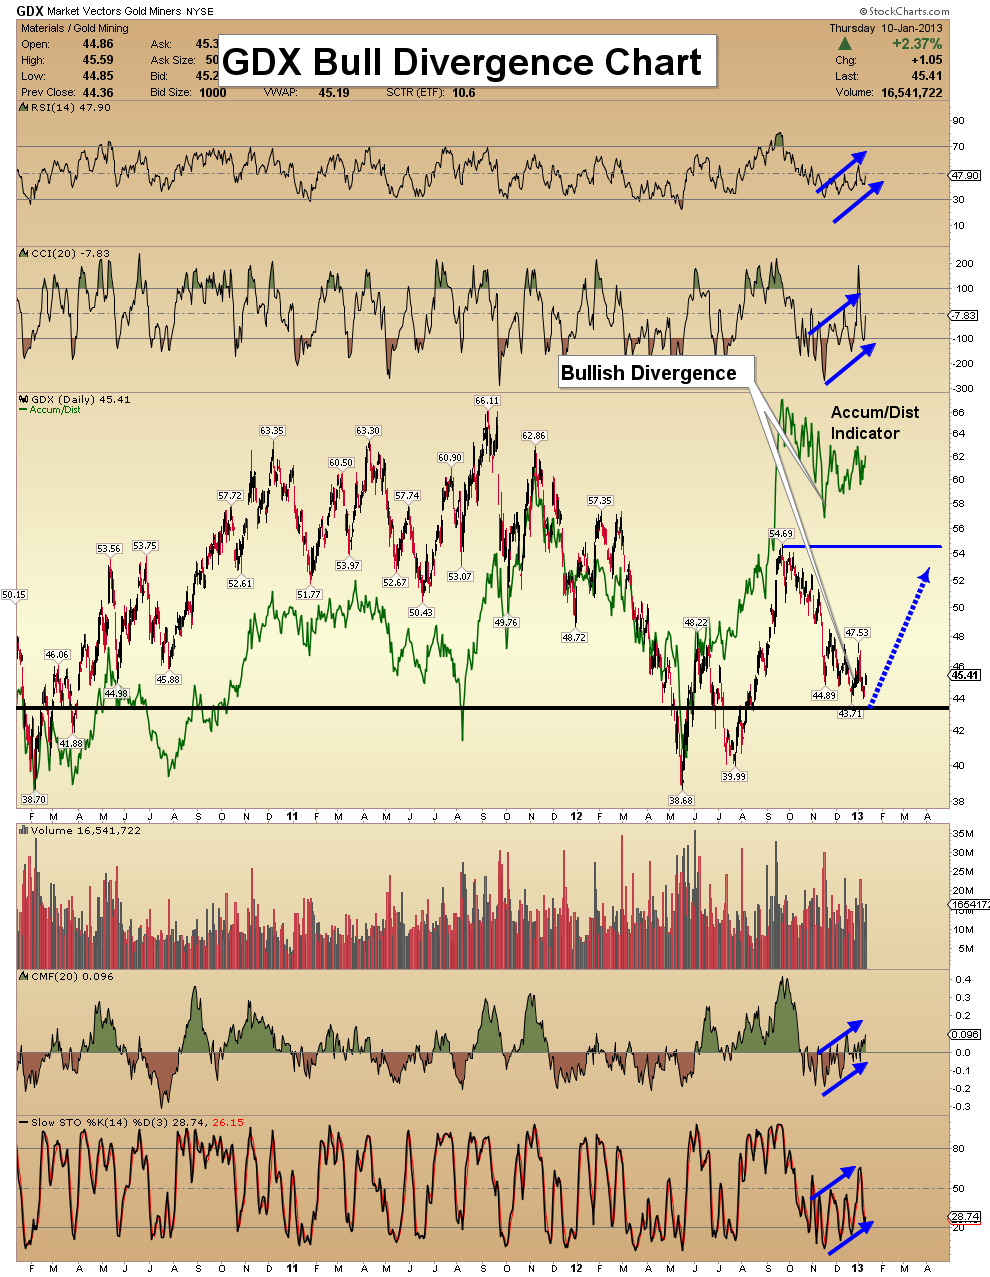
GDX Bull Divergence Chart - The “outrageous” bull divergence being displayed by the Accumulation/ Distribution indicator suggests that we are probably on the cusp of a huge leg higher, for the entire gold stocks sector.
- Note the trending action of RSI, CCI, CMF, and the Stokes. I’ve highlighted that in blue color. Are they suggesting an upside trending move is beginning in gold stocks? I think so!
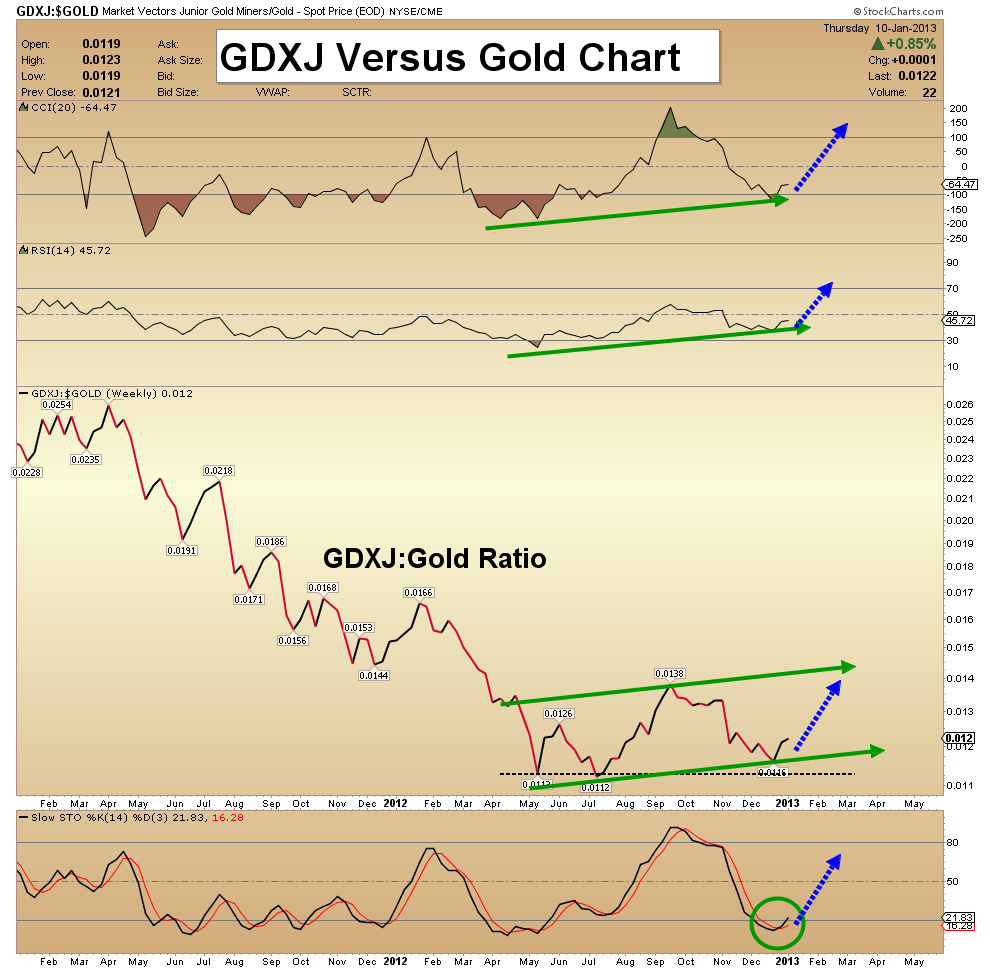
GDXJ Versus Gold Chart - This is a ratio chart that compares the price of GDXJ to gold bullion. Although there is ongoing volatility in junior gold stocks, there is also now ongoing outperformance!
- Note the beautiful buy signal in play on the Stokes indicator at the bottom of the chart. GDXJ, and most individual junior gold stocks, seem poised to perform very well in 2013.
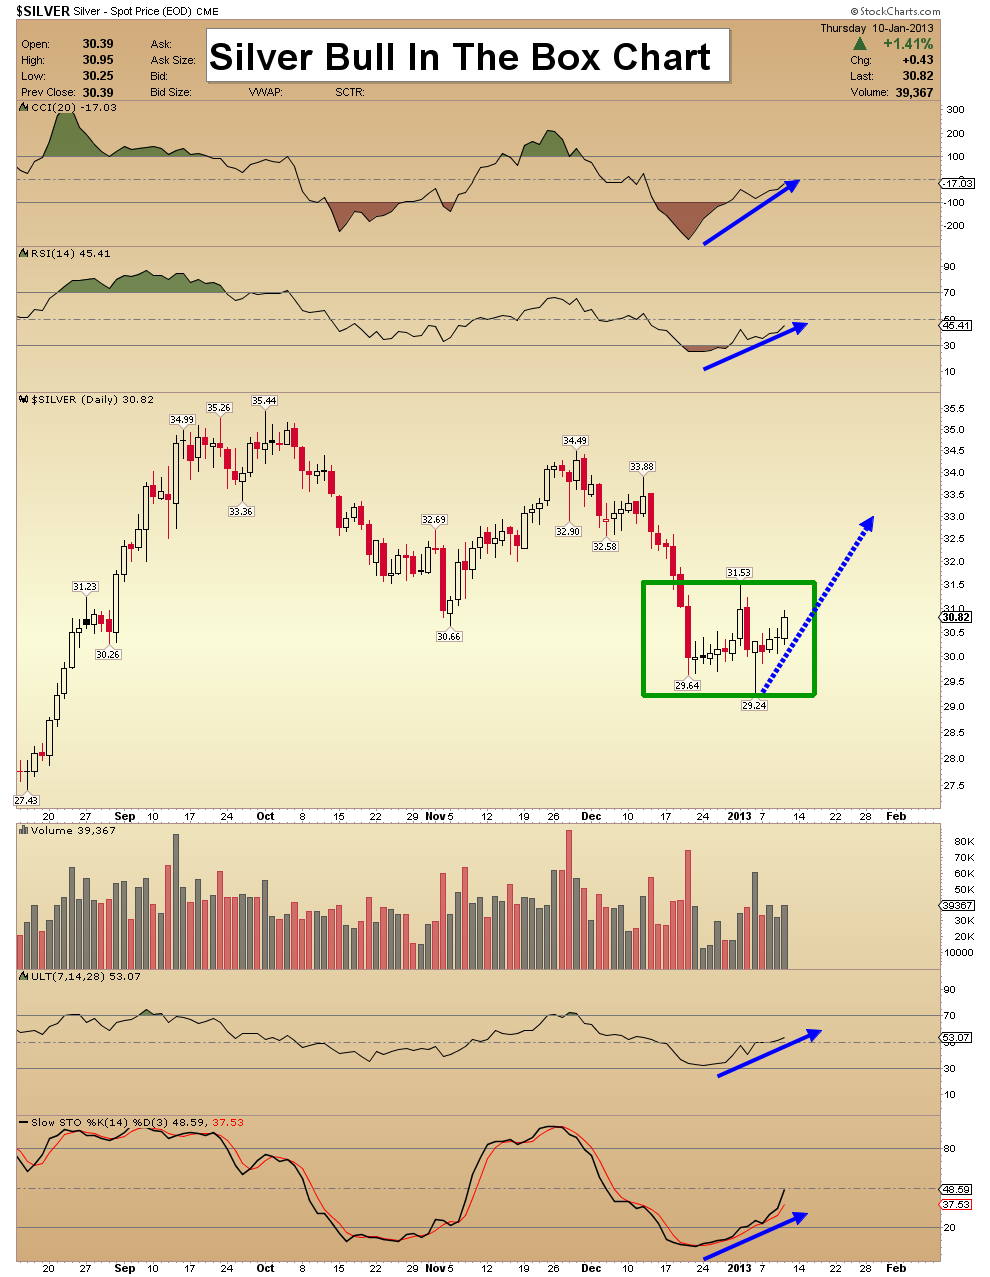
Silver Bull In The Box Chart - As good as gold looks here, silver looks even better. The hammer candlestick that appeared last Friday, is very similar to the one that I highlighted on the gold chart.
- Over the last several trading sessions, volume has picked up nicely.
- Silver looks a bit like a “Jack In The Box”, coiling between $29.24 and $31.53. Note the fabulous action of all 4 technical indicators on this chart.
- Perhaps you should view silver like a “Bull In The Box”, ready to charge out and gore the bears!
Friday, Jul 3, 2026 Super Force Signals Unique Introduction For 321Gold Readers:
Send me an email to admin@supergoldsignals.com and I’ll send you my free “Inflation Thunder Now!” gold and silver stocks video report. I’ll also include 3 of my next Super Force Surge Signals free of charge, as I send them to paid subscribers. Thank you!
|
Stay alert for our Super Gold alerts, sent by email to subscribers,
for both the daily charts on Super Force Signals at www.supergoldsignals.com and for the 60 minute
charts at www.supergoldsignals.com
About Super
Gold Signals:
Our Surge Gold Signals are created thru our proprietary blend
of the highest quality technical analysis and many years of successful
business building. We are two business owners with excellent synergy.
We understand risk and reward. Our subscribers are generally successfully
business owners, people like yourself with speculative funds,
looking for serious management of your risk and reward in the
market.
Frank Johnson:
Executive Editor, Macro Risk Manager.
Morris Hubbartt: Chief Market Analyst, Trading Risk Specialist.
website: www.supergoldsignals.com
email:
admin@supergoldsignals.com
email: admin@supergold60.com
Mail:
1276 Lakeview Drive
Oakville, Ontario, L6H 2M8
Canada
### Jan 11, 2013
Morris Hubbartt
321gold Ltd
 |
