Super Force Signals - A Leading Market Timing Service
We Take Every Trade Ourselves
Gold May Surprise The Bears Morris Hubbartt
Weekly Market Update Excerpt
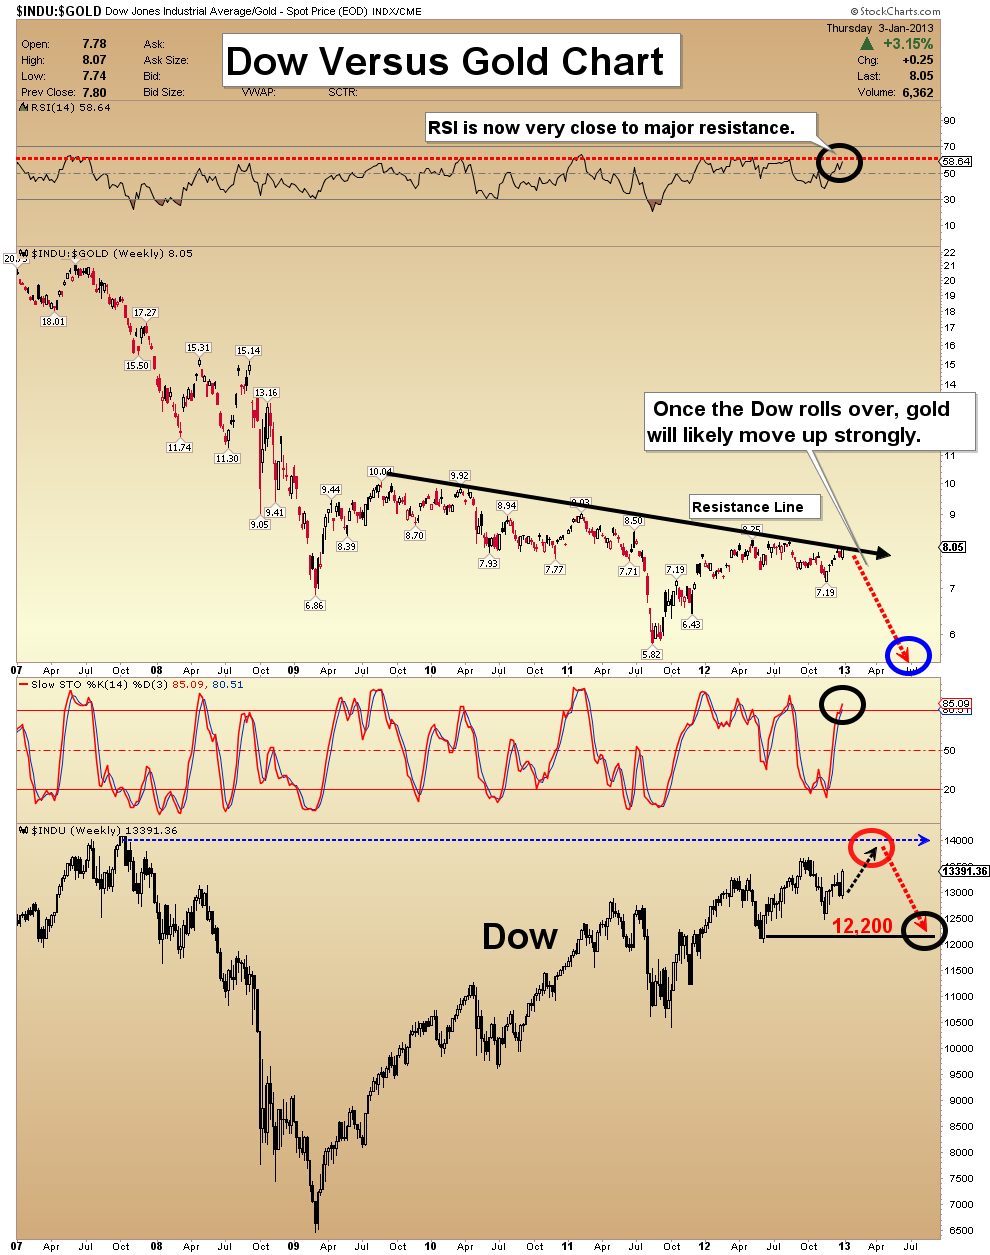
posted Jan 4, 2013 Dow Versus Gold Chart - The resolution that I was looking for in debt negotiations has taken place, and that has lifted stock prices. I continue to expect the Dow to approach 14,000 in the next several weeks, and top out there.
- Note the RSI indicator on this chart. It suggests potential outperformance by the Dow against gold, but only over the next few weeks.
- This last-gasp move higher by the Dow should set the stage for a multi-month rally in gold.
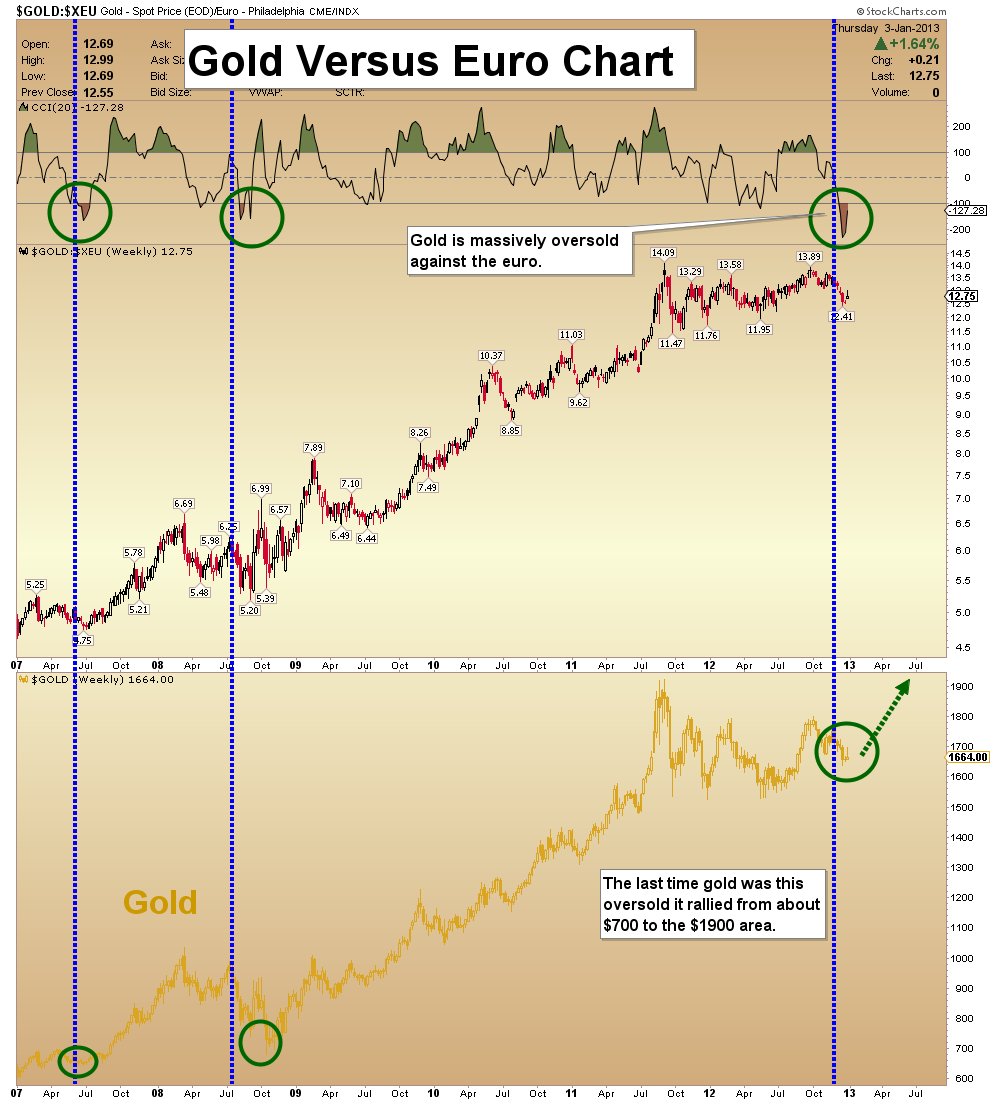
Gold Versus Euro Chart - This is a weekly ratio chart. Note how oversold gold is, compared to the euro. A strong buy signal for gold is now in play, and the last time one like this occurred, gold doubled in price, over the next three years.
- I don’t want to be predicting pies in the sky, but any rational investor can see that buying some gold here against the euro is a reasonable course of action!
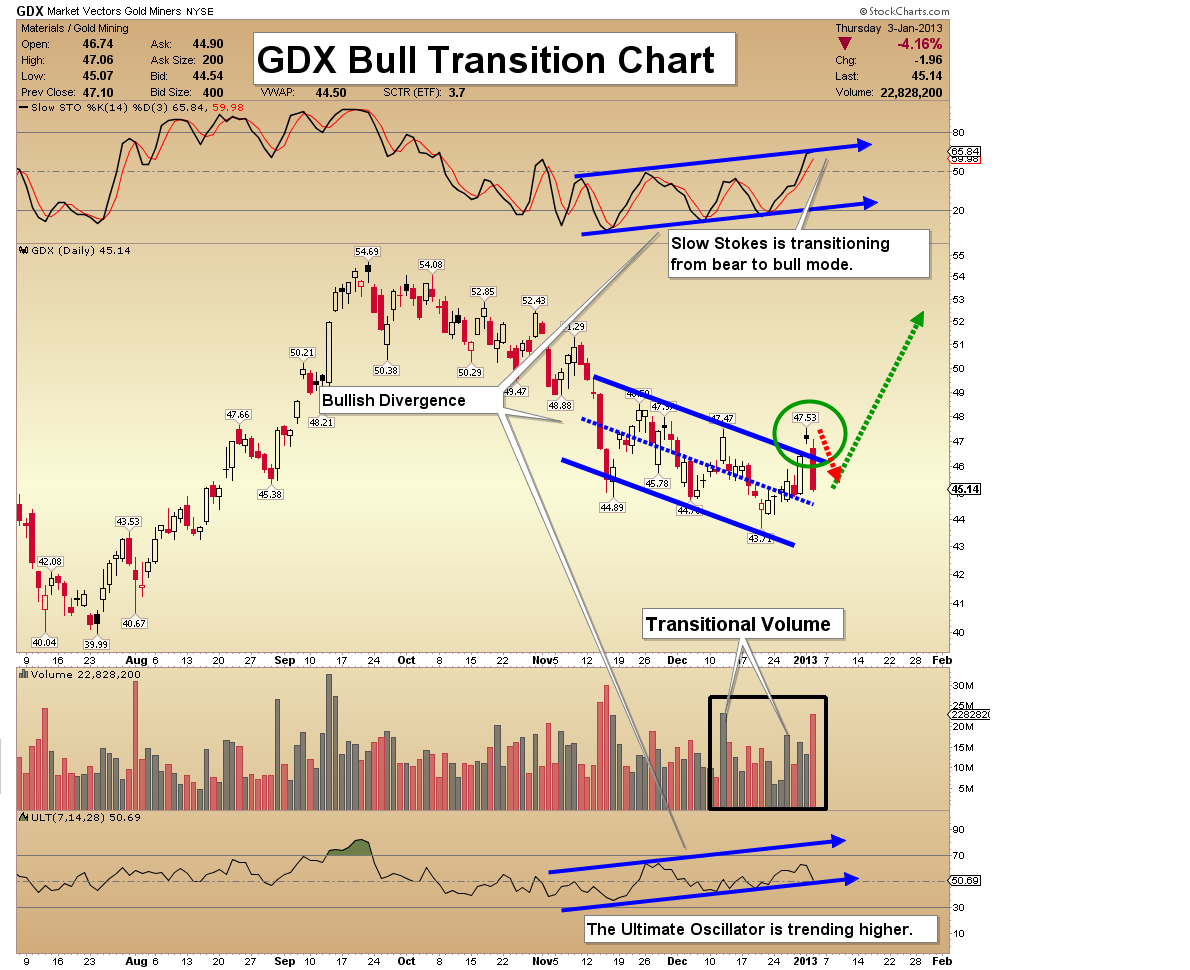
GDX Bull Transition Chart - A week ago I highlighted transitional volume on this GDX chart and discussed the possibility of an upside breakout. GDX delivered that breakout, and roared higher.
- Unfortunately, the breakout was short-lived. The release of the FOMC minutes did some technical damage to this chart. The red sell volume bar that occurred yesterday is a concern. Still, it’s too early to guess about whether it is the beginning of a new leg down, or capitulation volume.
- What is most encouraging about the senior gold stocks sector right now, is the positive divergences that are in play. Both the slow Stokes and the Ultimate Oscillator are trending higher, and until the Fed bombed the market, GDX was also beginning to rise nicely.
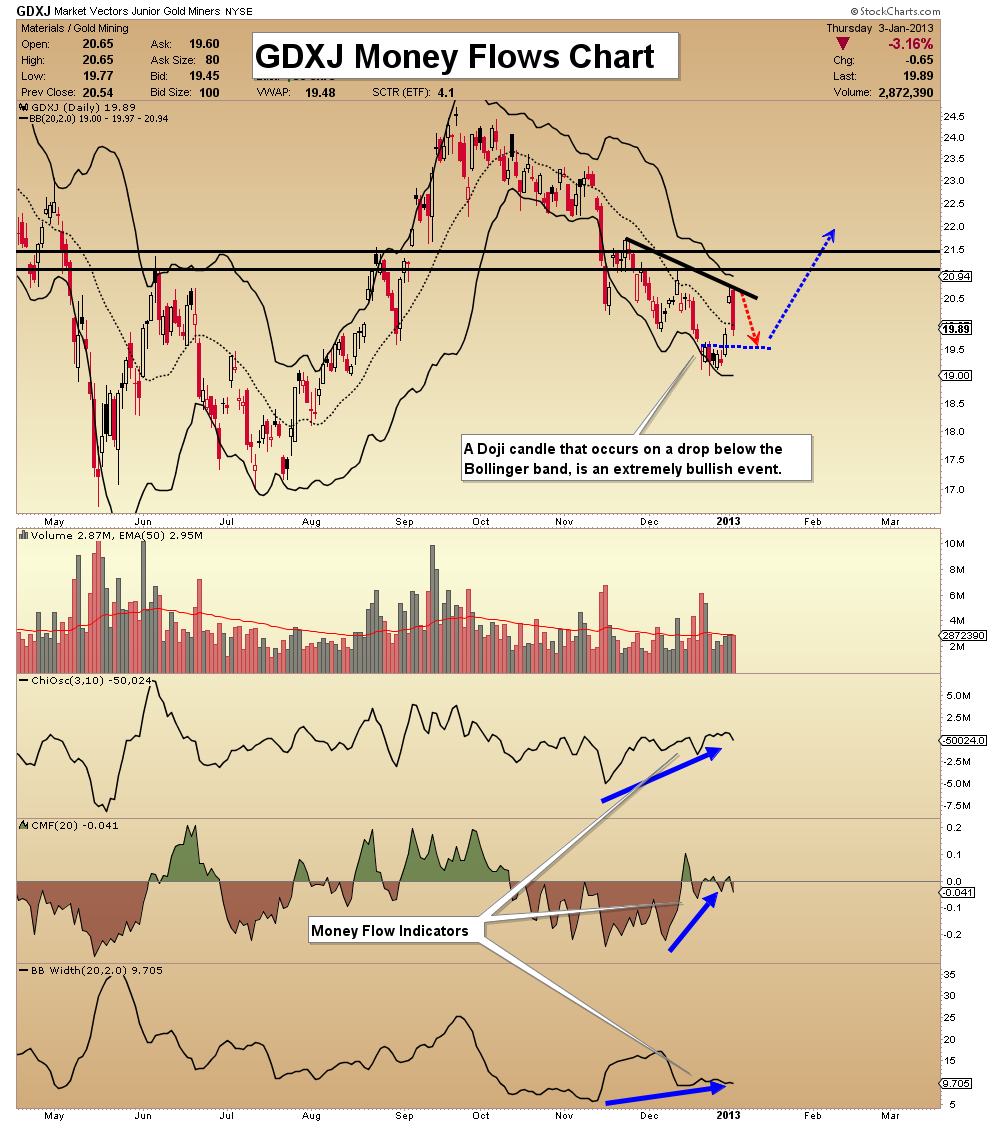
GDXJ Money Flows Chart - Last week I highlighted a Doji candlestick pattern, which indicated that a bottom for gold stocks was close at hand. That bottom occurred, and is holding. There are two areas of resistance on the chart that need to be taken out, before junior gold stocks are likely to really move higher.
- The first one that is directly overhead is the neckline off of the double bottom. It is located at $21. There is also minor resistance just above there, at $21.50.
- What I expect from here is stabilization over the next few sessions, and then a strong move through that resistance, and up to $24.50.
- I have highlighted strong money flows into the sector, at the bottom of the chart. This action is very similar to leg two of the double bottom last summer, when GDXJ rallied 45%. Stay long and strong!
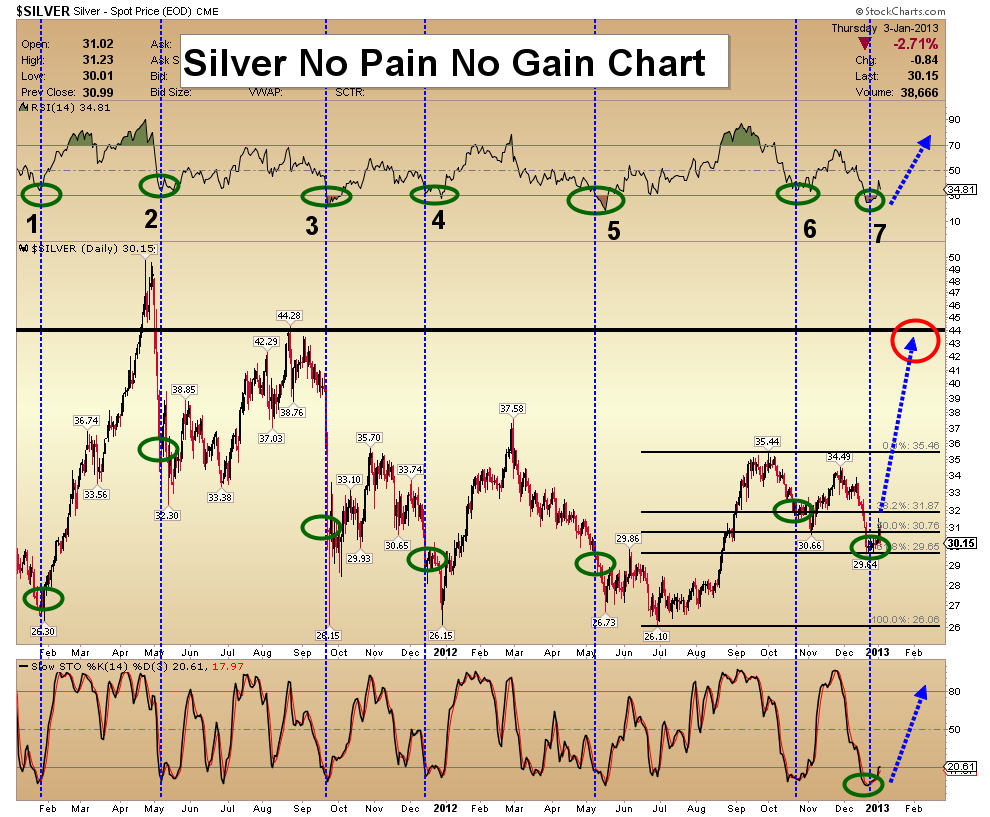
Silver No Pain No Gain Chart - Silver is one of my favorite assets to purchase on weakness, for long term capital gains. Today’s prices offer a great opportunity to do that, but remember that silver is far more volatile than gold.
- Note how drastically oversold RSI and the slow Stokes are. These powerful indicators suggest that investors who endure the pain caused by the FOMC minutes, could soon be greatly rewarded!
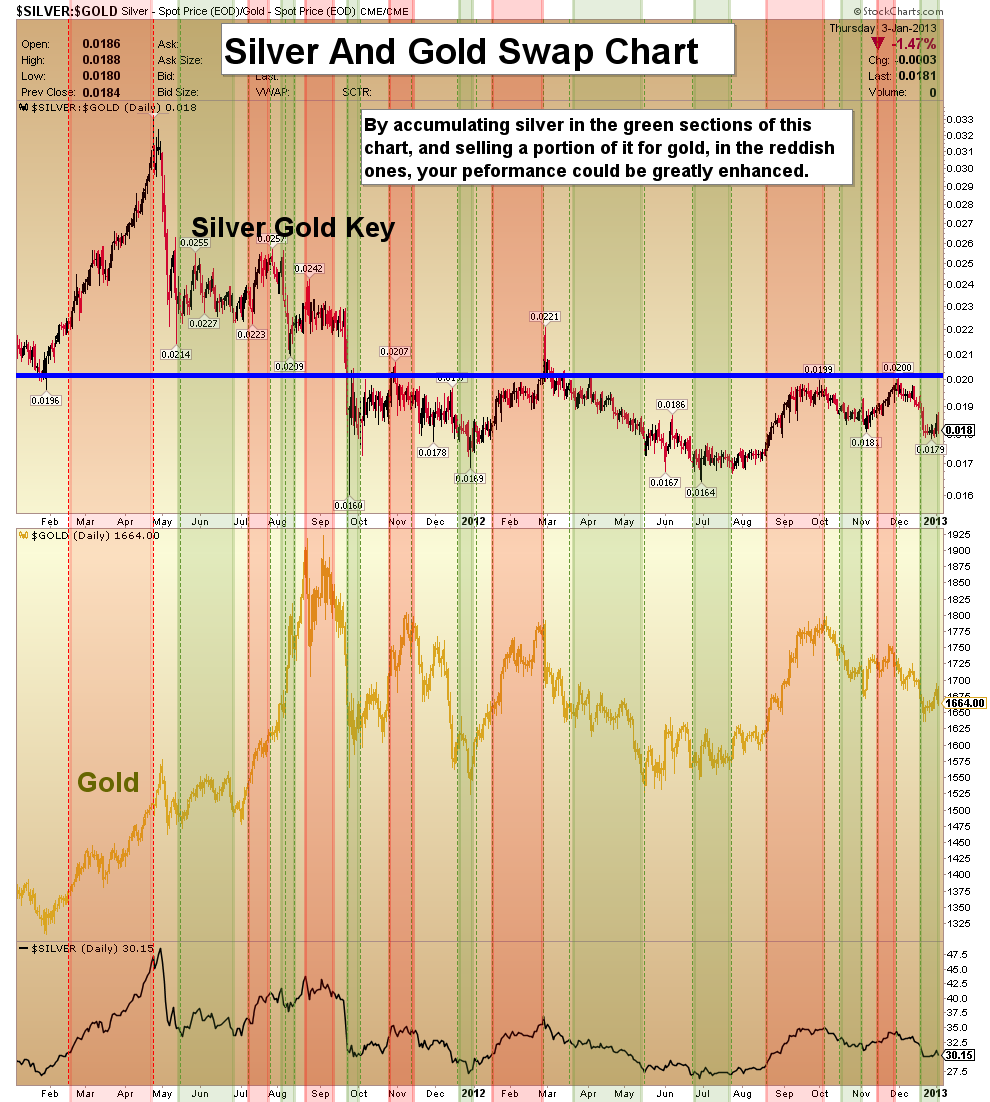
Silver And Gold Swap Chart - By accumulating silver in the light green sections on this ratio chart, and exchanging it for gold in the reddish areas, your performance could be greatly enhanced.
- Note the blue horizontal line that I’ve used to highlight the key .020 price area. If silver can rise over that line, it could mark the beginning of a long period of outperformance against gold.
Friday, Jul 24, 2026 Super Force Signals Unique Introduction For 321Gold Readers:
Send me an email to admin@supergoldsignals.com and I’ll send you my free “Inflation Thunder Now!” gold and silver stocks video report. I’ll also include 3 of my next Super Force Surge Signals free of charge, as I send them to paid subscribers. Thank you!
|
Stay alert for our Super Gold alerts, sent by email to subscribers,
for both the daily charts on Super Force Signals at www.supergoldsignals.com and for the 60 minute
charts at www.supergoldsignals.com
About Super
Gold Signals:
Our Surge Gold Signals are created thru our proprietary blend
of the highest quality technical analysis and many years of successful
business building. We are two business owners with excellent synergy.
We understand risk and reward. Our subscribers are generally successfully
business owners, people like yourself with speculative funds,
looking for serious management of your risk and reward in the
market.
Frank Johnson:
Executive Editor, Macro Risk Manager.
Morris Hubbartt: Chief Market Analyst, Trading Risk Specialist.
website: www.supergoldsignals.com
email:
admin@supergoldsignals.com
email: admin@supergold60.com
Mail:
1276 Lakeview Drive
Oakville, Ontario, L6H 2M8
Canada
### Jan 4, 2013
Morris Hubbartt
321gold Ltd
 |
