|
|||
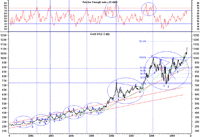
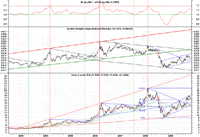
Are Gold and Silver Overbought?Troy Schwensen Last issue we discussed consolidation patterns in the gold price and how everything had set up nicely for a significant rally. Gold was trading at US$991/oz and the stage was seemingly set. 6-7 weeks down the track and the gold price has added US$125/oz representing a 13% rally. Attention now turns to whether this rally is getting a little long in the tooth. Below is a look at our longer term chart for gold (weekly). My conservative shorter term target remains US$1,180/oz. Gold Wave Analysis  The top section of the chart shows a standard RSI indicator. Looking back over the years, we can see these rallies have typically taken out the 75 level (red horizontal line). Earlier in the bull market this was a pretty reliable profit taking point. The previous two rallies however, have been more significant and we can see the 75 level has been hit on multiple occasions (circled areas), signaling brief consolidation periods on the way to the eventual intermediate term highs. My best guess is we are likely to see this occur during the present rally. The fact we have not yet hit the 75 mark in the RSI suggests we have more upside before we eventually get a correction. The question will then be whether this correction is paving the way for higher levels or whether it represents something more sinister (another consolidation period). For the time being, I see nothing to suggest this rally hasn't got more legs. US$1,150 - US$1,180 before year end seems very plausible. What's Silver's Story? Since the precious metals bottomed in late 2008, silver has been outperforming gold. A look at the middle section of the following chart (Silver/Gold ratio) shows silver's performance versus gold. As you can see, the ratio has been rallying higher during 2009. Silver has put on 78% and gold 57% from the 2008 lows. Silver Price Analysis  When we look at silver's performance relative to gold over the last 3 years however, we can see the trend is lower. Silver spent the first 6 years of this decade outperforming gold by some considerable margin. When we look at the middle section of the chart we can see the strong channel this ratio formed to the upside. This broke down in the middle of 2008 when the financial crisis was getting into top gear. The ratio now looks to be trading in a new channel trending lower. Until economic conditions and confidence improve, I think this is likely to be the relationship for some time to come. Gold tends to outperform silver in times of economic uncertainty which became very evident in 2008. While gold has continued to make record highs, silver has failed to reach existing highs. This is not to say that we can't have shorter term periods where silver outperforms gold. We are seeing this in 2009 on the back of hopes that the worst of this economic downturn is behind us. The overall trend of silver's relationship with gold over the intermediate term however remains down. The ratio looks to have strong resistance around the 0.02 mark (50:1 - Gold/Silver ratio). At this stage, it seems very unlikely that we will see the ratio challenge this level in the intermediate term. A look at the top section of the chart shows that silver tends to hit intermediate term price peaks when its 50 day moving average becomes 120% of the 200 day moving average or greater. On this basis, there looks to be some upside left in the silver price which would be consistent with our shorter term assessment of the gold price. Whether silver goes on to make brand new highs this time around remains to be seen. This will largely depend on economic sentiment and market conditions. If confidence dramatically falls away and we go into another round of de-leveraging, expect silver to significantly underperform the gold price. ### Nov 13, 2009 Editor Editor GN North America In our ongoing effort to develop a comprehensive information package for gold investors, the recently released North American version of the GoldNerds product includes a rolling 4 quarter summary of actual ongoing capital expenditure. It also provides a forward looking forecast of ongoing capital incorporating up and coming projects (this feature will soon be added to the Australian version of the product). These numbers are then integrated into a formula which adds an estimate of the future average cash cost (assuming all projects are developed), the enterprise value per mineable oz (customized indicator) and future construction capital (associated with undeveloped projects) to provide users with a useful Total Cost per oz estimate. This enables investors to effectively compare gold mining companies from a very unique and useful perspective. If you are serious about researching gold mining companies I encourage you to pay us a visit. The North American version covers most of the established producers and many of the up and coming development companies listed on the North American exchanges. Disclaimer |

