|
|||
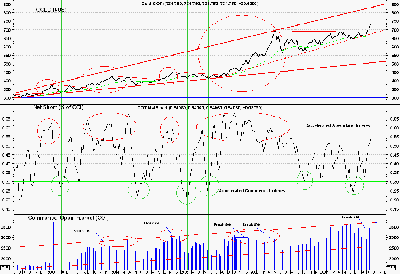
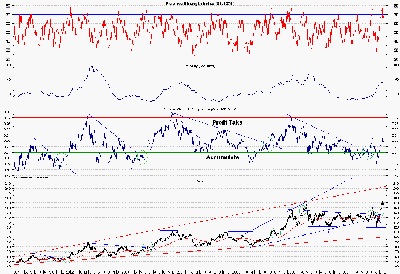
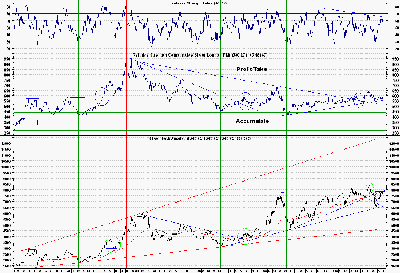
Stick to Your GunsTroy Schwensen The following is an extract from the August 07 Issue of The Global Speculator sent to subscribers on the 5th of October 2007. The month of September 07 finally saw the much anticipated move higher in the precious metals sector and a break of the 16 month consolidation. The Federal Reserve cut rates 50 basis points sending the US dollar into a predictable tail spin. At this juncture there has been a flood of bearish articles on the precious metals sector. The reasons have ranged from the sector being technically overbought, to the large commercial short position that has been building in recent COT reports. Whilst a simple look at RSI levels for Gold and the XAU make it pretty difficult to disagree with the overbought appraisal (at least on a short term basis), it's the bearish COT line of reasoning I want to spend a little time on. The chart below is a look at a weekly gold chart mapped with COT data looking at just the commercial side of trade. There is a very common view that it is the commercials that dictate the overall movement in precious metals markets. Whilst this may be true on any given day(s), in the overall scheme of things it is the speculative side of the market that drives prices both sharply higher as well as lower. The bottom section of this chart shows the total Commercial Open Interest (COI). The middle section shows the Net Short Commercial position as a proportion of the COI.  Looking at this chart we can see that the major movements in the gold price (Red Circled areas) have corresponded with relatively high levels of commercial net short positions (generally over 55% of COI). For every commercial short there is obviously a corresponding long which will be on the speculative side. It is these spikes in speculative interest that drives the gold price higher. The recent COT report released last Friday showed a record in COI. In terms of the Net Commercial Short position as a proportion of COI you can see on the chart that we are not setting any records despite being at high levels. The point I want to make here is that to use the COT data to support a selling decision can be a very dicey game, especially when the Gold price has broken out from a lengthy consolidation and the fundamentals are strong. In 2005/06 we saw many participants in the market try to play this COT game cute and were left flat footed as the record net commercial short position was maintained and the gold price surged higher regardless. As you can see in the chart above, the COT data can provide a very useful entry point when the commercials are covering their shorts into speculative selling of longs (Green vertical lines). As a selling indicator when net commercial shorts peak with speculative buying of longs, one has to be very careful. The other point I want to touch on in this issue is the US dollar. The fundamentals for the US dollar are incredibly poor right now despite the US dollar being technically oversold. Everyone knows the US runs a huge Current Account Deficit (CAD) but what does this actually mean for the US dollar? This means you have more US dollars paying for imports than you have foreign currency paying for US exports, not to mention the net transfer of income and expenses tied to foreign owned assets and debt. This in itself is not a problem as long as the US economy appears to be running well and the interest rates being offered compensates foreigners for the risk of investing these excess US dollars back into US assets. Australia is a good example of a country that runs a CAD almost comparable with that of the US. It is fair to say that monetary inflation here in Australia is more excessive than it is in the US. The Aussie dollar unlike the US dollar is setting record highs against the currencies of its trading partners, despite these negative factors. What's the difference? The difference is in the foreign perception of how well the Aussie economy is traveling. The Reserve Bank of Australia (RBA) unlike the Federal Reserve is raising interest rates. Foreigners therefore are being rewarded for the risk of investing in Australian assets. In other words there is a demand for this surplus in Australian dollars (courtesy of the CAD) that is flooding international foreign exchange markets. As long as foreign investors are not spooked by an international market event (The Sub prime woes, Yen Carry Trade Unwinding etc) and the Australian economy appears strong, there is no problem. When we look at the US economy right now we see things are not as stable, hence the recent cutting of interest rates. Now foreigners holding US dollars realize the US economy is a riskier proposition than it was 6-12 months ago and the interest rates on offer are not compensating them for this additional risk. Thus they are looking for more attractive alternatives (Europe, Canada, Australia etc) despite the universal monetary inflation that is presently occurring globally (Not just in the US). The ease at which the US dollar broke the USD Index level of 80 has caught many by surprise. Yes the US dollar could rally in the short term but in my opinion the fundamentals do not favor an extended rally for the reasons I have stated. If conditions stabilize in the US like many believe they have already started doing (Falsely in my opinion), then this could of course change. Apart from the Dow Jones index running back up towards 14,000, I have not read nor heard anything that convinces me that the recent rate cuts will be the last we will see in the foreseeable future. XAU  XAU GOLD RATIO  A look at the chart of the XAU for the month of September 07 shows the XAU definitively breaking resistance at 145 and rallying strongly up to as high as 173 (A new high) before consolidating back down towards 165. The XAU/Gold ratio has rallied up to breach 0.23 where it has run into some stiff resistance consistent with previous rallies. A look at the RSI (Top section) shows the precious metals shares had become particularly overbought. All in all things have pretty much panned out as we would have expected them to. Since the low for the XAU/Gold ratio was put in on the 16th August, the XAU has rallied 31.25% and the Gold price just over 10%. We are seeing the typical 3-1 leverage in the Gold shares over the metal which is consistent with a sustainable rally. OUTLOOK The two short term scenarios as I see it over the coming weeks and months: Scenario 1: The precious metals shares have pulled back off their recent highs and will spend the next few days/ weeks consolidating. This could see quite a lot of volatility. The US dollar despite its poor fundamentals has been technically oversold and may experience somewhat of a rally from here which could put some selling pressure on gold and the precious metals stocks. This will be a fairly short term consolidation followed by a continuation in the rally of both the XAU and gold. I am leaning towards this scenario. Scenario 2: The precious metals sector again gets caught up in a broad commodity sell off and/or a panic sell off in the equity market, resulting in the XAU falling all the way down to support at 145. This would more than likely be the scenario if the rate cuts fail to alleviate market fears and the markets come under more selling pressure as the credit squeeze tightens its grip again. The gold price theoretically should perform well under this scenario but as we saw in August quite often the baby gets thrown out with the bath water (at least in the short term). Intermediate Term Outlook: We have realized our first intermediate target of 165-170 (Close to the previous high). After a brief consolidation at this level, we could then see a more extensive rally that takes us to 200-230 over the next 3-6 months. NORTH AMERICAN SILVER INDEX (NASI)  The Silver index like the XAU rallied in September 07 and whilst it managed to breach the 150 day MA at 7,400, it failed to break the tough resistance at 7,800 and has since fallen away. The relative strength comparative is still managing to hold support but has only marginally rallied since August's low. Silver has clearly underperformed the gold price over the past month and we have seen this reflected in the silver shares with the index failing to replicate the new highs made by the XAU. OUTLOOK The two short term scenarios as I see it over the coming weeks: Scenario 1: The Silver index will continue to consolidate in its trading range of 6,600 - 7,800. If a rally occurs during the month the important resistance level remains the 7,800 - 8,000 range which should eventually be broken. I am presently leaning towards this scenario. Scenario 2: If the gold and silver price were to get caught up in the sharp fall of the other commodity prices and/or a sharp panic sell off in the equity markets, we could see a worse case scenario of a breakdown of the next support line at 6,600 and move down towards longer term support at around 4,500. Whilst this remains a possibility given the present climate of uncertainty, I don't support this scenario at the present time. Intermediate Term Outlook: Over the longer term my next target for the NASI is around the 11,000 mark towards the first half of 2008. CLOSING COMMENTS The precious metals markets have finally resumed their move higher and commenced the next stage of this bull market. It is at this stage, after a protracted consolidation, that people start to doubt the validity of the move higher and profit take anticipating pull backs and opportunities to cash in now and re-enter at a later stage. In my experience this is great in theory but very difficult to implement in practice. The job is made increasingly harder by the higher levels of volatility that we are presently experiencing. The XAU/Gold ratio, whilst having had a good run, is still significantly below profit taking territory (0.25 - 0.27) at 0.23. This suggests to me that sitting tight and riding the volatility is a sound strategy at this time. It's not sexy and exciting but there's a fair chance it will be rewarding. For anyone interested I write a free newsletter on the precious metals market which you can sign up for at the website below. Troy Schwensen CPA Troy Schwensen
is a full time investor/Trader who spent 8 years in the Accounting
and Finance industry which included roles with blue chip Australian
companies such as Goodman Fielder and Fosters where he spent three
years as a Senior Business Analyst. He made a decision to leave
this industry in 2002 after discovering a long term opportunity
to invest and trade in the precious metals market where he has
since used his analytical skills to build a sound working knowledge
of the sector and its comprising companies. |
