|
|||
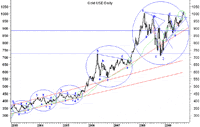
Gold Price Consolidation AnalysisTroy Schwensen It's been some time since I last wrote an article on the gold price. The gold price, up until recently, has been in one of its usual consolidation patterns after making all time highs back in March 2008. For those of you who have followed gold's bull market run since it began in 2001/02, you would be all too familiar with what we have just seen. The last 5 consolidation periods graphically look like this:  When gold is trading in one of these consolidation patterns (typically an abcde movement) what tends to be of interest includes:
A summary of the last 5 consolidation patterns make for interesting reading. Gold Price Consolidation periods  Please note that each consolidation begins with a high being made and ends with a breakout from the abcde pattern demonstrated in the chart above. Confirmation occurs when the old high gets taken out. Some interesting things to note are:
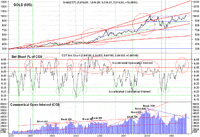
Taking the above into account, the probability of a new run in the gold price over the coming months looks very high. Everything is as you would expect based on past form. The prior resistance of the consolidation pattern should now provide strong support and is presently at around US$975. A break of this support would be a cause for concern and require a reassessment of the situation. Volatility will continue to be a key part of the landscape and threaten to shake out many. There are many analysts right now looking at the COT information and claiming the commercial net short position is high and a correction in the gold price is imminent. Let's now briefly take a look at what the net commercial short positions were as a % of the commercial open interest (COI) as each of the new highs were being made post consolidation:
Each new run in the gold price has always started with a commercial net short (% of COI) position of close to 55% or above. To see a graphical representation, look at the chart below. The middle section of the chart shows the commercial net short position as a % of the COI, the top section shows the gold price and the bottom section the commercial open interest (COI). Notice how these net short positions remain in the 50-65% range for the duration of each run up in the gold price (red circled areas). We have seen this time and time again. There is no question the risk of a shake out in the gold price is highest when these commercial net short positions are at these level. As you can see however, this characteristic also corresponds with the most significant moves higher in the gold price. Gold Commitment of Traders Chart  For anyone interested, I write a free monthly newsletter on the precious metals markets. This includes technical analysis as well as company updates on many prominent precious metals companies from around the world. Pay us a visit at the website below. Alternatively for all the latest fundamental information on gold stocks and sophisticated tools in which to utilize it, I invite you to visit the GoldNerds site. Many articles demonstrating how we have employed the product to indentify undervalued gold stocks are available at The Global Speculator website. ### Sep 30, 2009 Editor Editor GN North America In our ongoing effort to develop a comprehensive information package for gold investors, the recently released North American version of the GoldNerds product includes a rolling 4 quarter summary of actual ongoing capital expenditure. It also provides a forward looking forecast of ongoing capital incorporating up and coming projects (this feature will soon be added to the Australian version of the product). These numbers are then integrated into a formula which adds an estimate of the future average cash cost (assuming all projects are developed), the enterprise value per mineable oz (customized indicator) and future construction capital (associated with undeveloped projects) to provide users with a useful Total Cost per oz estimate. This enables investors to effectively compare gold mining companies from a very unique and useful perspective. If you are serious about researching gold mining companies I encourage you to pay us a visit. The North American version covers most of the established producers and many of the up and coming development companies listed on the North American exchanges. Disclaimer |

