|
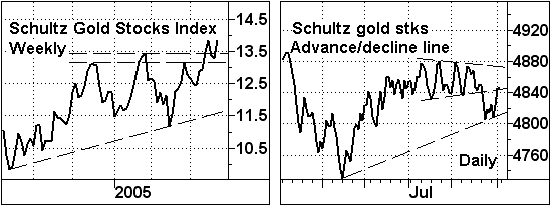
Down The Yellow Brick RoadHarry Schultz The yellow brick road runs through the pages of HSL (as U might expect) especially on pages 7-11. Look at the mini charts. On this page see the weekly Schultz Gold stocks Index (Its components are pure, unhedged golds with top relative strength). U see how it has broken above months of resistance, out into the blue sky. Next to it is the Schultz Gold Stocks Advance/Decline Line (which reflect the general gold mkt). Here U see the frustrating sideways action of recent months & the discouraging breakdown from a symmetrical triangle or trading zone. But on Friday, it poked its head above the resistance line; hopefully it will hold. If it falters, it'll retest the 4800 level. But, as most individual gold charts are in up-momentum mode, I suspect it will hold its present price, or at least at 4800. Now to turn from gold stocks to gold bullion, see chart on page 11, the gold weekly continuation futures. Here U see two symmetrical chart patterns over the past 2yrs. George the giraffe says: "U can see we have just broken above the latest one." Judy agrees. The implication is a $480 gold price somewhere ahead. The yellow brick road tour continues: see the CRB commodity index, page 11. It hit a new high on 9/2. That spells higher prices, inflation escalating, always a boon for gold. Next on your tour: a very important lesson & view for all. See US-$ index Dec futures daily chart, page 8. There is a clearly bearish H&S top. It broke the neckline, fractionally, on 9/2. If no immediate reversal occurs, this spells out a deeper US-$ fall. That is gold-bullish! But wait, now see the other US-$ chart, weekly, on pg 8. This bigger picture shows a potential reverse H&S, ie, a base for a notable US-$ rise. Note the right shoulder of this pattern is building. If it breaks under 85 (ie, matching left shoulder), it's $-demise. If it bounces off 85 & then rises over the neckline to 87.60 or so, we'll likely see a $ rally to 105 +/-. Would be gold-bearish. Last stop on the chartwalk: the Canadian-$ chart, page 11 shows extreme strength vs US-$. Most non-US$ currencies are strengthening (not this extreme), which augers well for gold, badly for US$. That concludes our yellow brick road tour. Conclusion: all these charts are gold bullish, but some have only fractional breakouts, so they require close monitoring. See Back to the Futures section for specific guidelines on gold, regardless of whether U trade futures. Also see Nutshell, pg 11. Among strongest gold charts: AngloAmerican, Agnico, FNX Mining-T, Gammon Lake, Meridian, Rio Tinto, Teck Cominco-T, Viceroy-T, Virginia-T, Yamana. Byebye from your Laissez-faire
Uncle Harry D (for Demystifying) Schultz  [Tons more follows for subscribers,] Archives
|

