|
|||
The most important chart in the financial worldSteve Saville
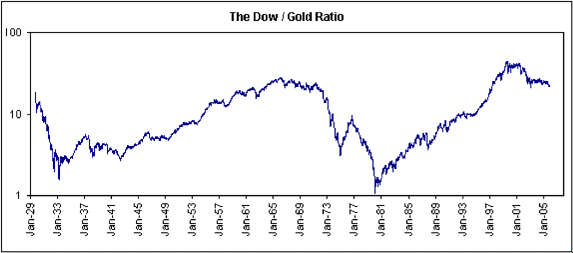
An argument against investing in gold that we occasionally see presented goes something like this: Although gold has done well over the past few years, it is still well below where it was in 1980. The Dow Industrials Index, on the other hand, is currently about 1200% higher than it was in 1980. For long-term investors it therefore makes a lot more sense to invest in the stock market -- represented, in this discussion, by the Dow -- than to invest in gold. It might be possible to come up with a sillier argument for favouring the Dow over gold, but we can't think of one. Yes, gold WAS a terrible investment during the 2-decade period beginning in 1980, particularly relative to the broad stock market. However, it is partly BECAUSE of this massive under-performance that gold has outperformed over the past 5 years and is set to outperform for at least another 5-10 years. Putting it another way, making the argument today that long-term investors should steer clear of gold and, instead, invest heavily in general equities simply because this was what worked during 1980-2000 would be akin to someone in January of 1980 advocating that investors concentrate on gold and shun the general stock market. After all, in January of 1980 the Dow had proven to be a terrible investment over a long period whereas gold had proven to be a spectacularly good investment (in January of 1980 the Dow was LOWER than it had been 15 years earlier whereas gold, over the same period, was up by more than 2000%). Over very long time periods each investment class cycles between massive under-valuation and massive over-valuation. During the late 1970s, for example, burgeoning fears of inflation and plummeting confidence in the monetary system caused a spectacular surge in the investment demand for gold and caused stock market participants to assign very low multiples to company earnings and dividends. As a result, the Dow became extremely under-valued in absolute terms and relative to gold. But rather than being a reason to dislike the stock market and favour gold, 15 years of terrible performance by the Dow and great performance by gold resulted in the stock market being priced to yield exceptionally GOOD long-term returns and gold being priced to yield exceptionally POOR long-term returns. By the year 2000, however, two decades of subsiding inflation fears and growing confidence in the monetary system had led to a situation where there was almost no interest in gold as an investment and where stock market participants were willing to assign phenomenally high multiples to company earnings and dividends. But rather than being a reason to favour the stock market and dislike gold, 18-20 years of terrible performance by gold relative to the stock market had set the stage for at least 15 years of dramatic out-performance by gold. All that was required to set the new long-term Dow/Gold trend in motion was for the long-term trend in confidence to reverse direction; and that happened when the NASDAQ bubble burst. The long-term oscillations from extreme under-valuation to extreme over-valuation and back again are clearly evident on the following chart of the Dow/Gold ratio (the number of ounces of gold it takes to buy the Dow Industrials Index). In our opinion, this is the most important chart in the world for long-term investors. When secular trends are set in motion they rarely last less than 15 years and they never end until an extreme is reached. The main message of the following chart, therefore, is that the current trend of under-performance by the Dow relative to gold is still in its infancy. Long-term investors would do well to keep this chart in mind and to over-weight gold-related investments in their portfolios until the Dow/Gold ratio drops to the bottom quartile of its 80-year range.  Steve Saville Regular financial market forecasts and analyses are provided at our web site: We aren't offering a free trial subscription at this time, but free samples of our work (excerpts from our regular commentaries) can be viewed at: http://tsi-blog.com Saville Archives |
